

1. Introduction
Allocating sanitary landfill is subject to numerous criteria, factors, and regulations (Lin & Kao, 1999). Sanitary landfill should not only meet the environmental and health regulations, but should also be accepted by the community lives close to it. Opposition from community could potentially grow due to for example Not-In-My-Backyard (NIMBY) syndrome. Without tool to guide the decision makers, allocating sanitary landfill could be a trivial task which could potentially grow stronger opposition. When it come to find optimum allocation, well defined procedure which incorporates GIS and decision makers'
preferences has proven to be more efficient than by manual methods (Ahmad, Azhar & Lukauskis, 2004).
In order to demonstrate the coupling of Geographical Information System (GIS) and Decision Making (DM) procedures (Eastman et al., 1993; Jankowski, 1995; Malczewski, 1999), this article used the dataset from Bandung Area, West Java, Indonesia. The result of this research is expected to provide additional information for local authorities in renewing their spatial plan.
Brief historical background on the site. Before 2005, Leuwigajah (24 ha) sanitary landfill was used to dispose domestic and industrial waste from West Bandung and its three adjacent regions; Cimahi, Bandung City, and Greater Bandung. Following the methane explosion in 2005 (figure 1) which killed hundreds of people and buried dozen of settlement, Leuwigajah was immediately closed. Emergency step taken was to find new location for sanitary landfill to replace Leuwigajah in order to prevent the spreading of diseases through flies from un-disposable waste.
Brief explanation on theoretical background. While only brief explanation is provided here, interesting readers is suggested to read Aronoff (1989) for introduction in GIS and
Malczewski (1999) for multi-criteria decision analysis. GIS is a computer-based system that provides the following four sets of capabilities to handle geographical referenced data (Aronoff, 1989); (i) data input, (ii) data management (data storage and retrieval), (iii) manipulation and analysis, and (iv) output. Data input refers to the capabilities in gathering and collecting data from different input sources such as satellite images, digitizer, or GPS point survey. Data management includes those capabilities in storing and retrieving data from database. Manipulation and analysis relate to the capabilities of GIS to carry out certain objectives, while the output means capabilities of GIS in performing the results in table, map, diagrams, or other representatives.
Despite GIS aims to aid the decision making (Jiang & Eastman, 2000), it has limitations such as: (i) incapable of processing multiple objectives, (Chakhar & Jean-MarcMartel, 2003) (ii) limited ability in integrating geographical information with subjective values/priorities imposed by the decision maker (Malczewski, 2004) and (iii) it does not permit the assessment and comparison of different scenarios (Eldrandaly et al., 2003). To overcome these limitations, GIS-DM is introduced.
Figure 1 Satellite images of Leuwigajah Sanitary Landfill before and after Methane Explosion Source: SPOT-4 Image 2004 (left) and Google Earth 2005 (right). The left and right images show the situation before and after explosion, respectively. The debris was thrown away 1 km apart from the centre of explosion.
In this paper, the GIS-DM procedures use the following steps:
- 1. Defining particular criteria for suitable sanitary landfill sites;
- 2. Deriving weights from different decision makers' preferences using Analytic Hierarchy Process (AHP) (Saaty, 1990). The Analytic Hierarchy Process (AHP) is a mathematical method for analyzing complex decisions with multiple criteria. The weight criterion in AHP is determined by using pairwise comparison judgments in matrix format comparing the relative importance for every two choices.
- 3. Identifying suitable sites for sanitary landfill based on different decision makers' priorities;
- 4. Comparing different alternatives from the different decision makers' priorities in terms of its sensitivity analysis.
The above procedure is clearly illustrated on Figure 2. The "intelligence" phase starts with the identification of the problem and end with standardization of the criteria. This phase was done in ArcGIS environment. In the "design" phase, the weight was synthetically derived from four different decision makers who give four different priorities based on their own point of view about the proposed criteria on locating sanitary landfill. Analytic Hierarchy Process (AHP) was used as the method in this phase. We used Expert Choice software to handle various preferences and calculate their respective weights as provided in screenshots on figure 3. The "choice" phase was intended to incorporate the decision makers' preferences coming from AHP into GIS environment. This was undertaken under the Spatial Analysis module in ArcGIS.
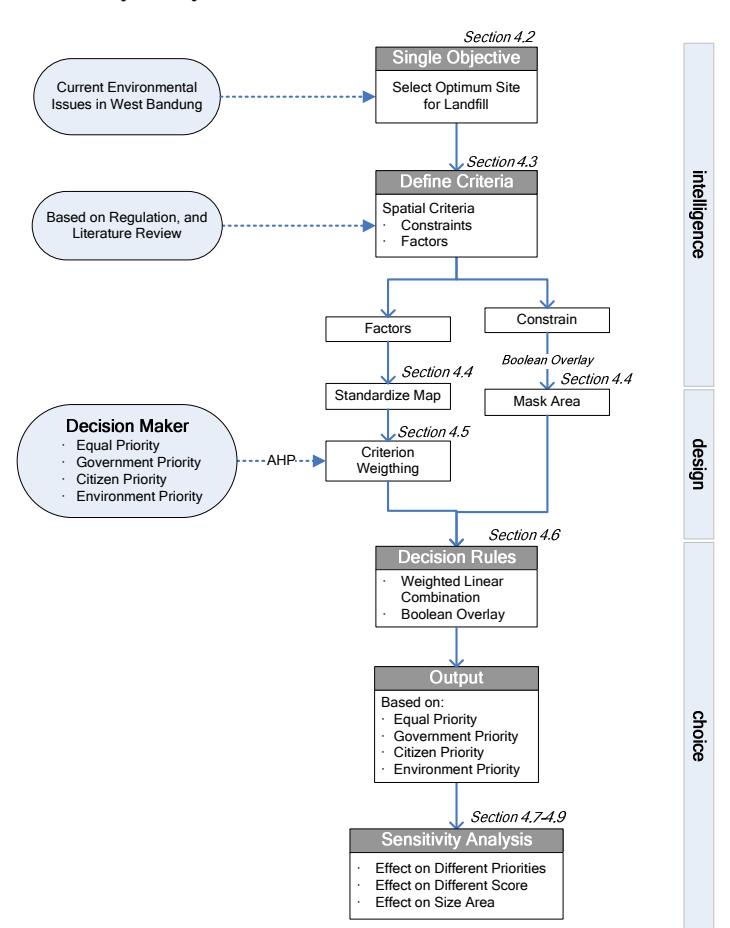
Figure 2 The Procedure for sanitary landfill Allocation
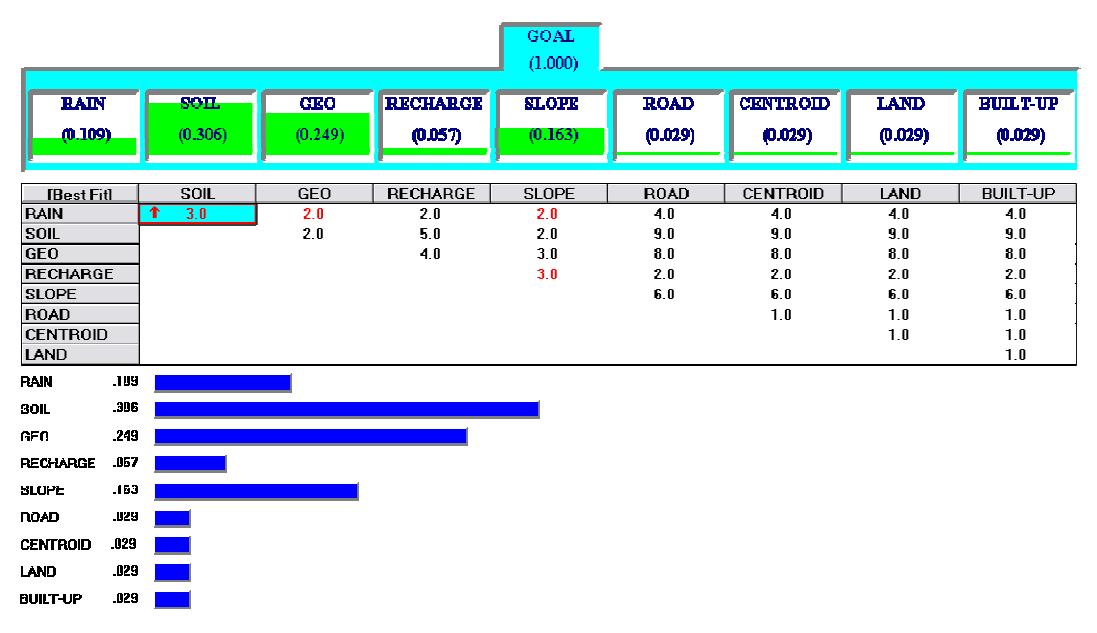
Figure 3. Screen shoot of Expert Choice
2. Materials and methods
2.1 Intelligence phase: Defining the criteria
According to the Indonesian National Standard for locating the sanitary landfill (SNI 03-3241- 1991 and SK SNI T-11-1991-03), there are 15 criteria that should be fulfilled to find suitable landfill. Those criteria can be divided into two groups i.e. constraints and factors. Constraints are based on Boolean criteria; true or false with no possibility to have partial membership. In our particular case here, constraints divide the proposed area into two parts: potential or allowed area for locating sanitary landfill. In GIS-DM procedures, generating criterion map based on Boolean sets standardization can be illustrated in figure 4. The following are the list of the constraints which are used on the remaining part of this paper:
1. Hydrology. sanitary landfill (i) must not be close to water bodies, either lake, wetland or river,(ii) must not be less than 100 m from public water intake, (iii) must not be in an area of 25 years recurrent flood, and (iv) must have a Ground Water Table (GWT) with 3 m depth or lower.
- 2. Geological Hazardous Area. The standard stipulates that sanitary landfill must not be located in Holocene fault and volcanic hazardous area.
- 3. Distance to Airport. The site must be at least 1.5 km away from the commercial airport runway, or 3 km for the turbojet airport runway. This constraint is used to avoid flight distraction caused by birds flying around the sanitary landfill.
- 4. Conservation Area. The site must be outside the forest conservation area.
Factor is used to measure the degree of suitability for ideal sanitary landfill. Fuzzy sets ware used here to define the degree of suitability in terms of a continuous membership function. Fuzziness is a type of imprecision characterizing classes that for various reasons cannot have or do not have an abrupt boundaries (Burrough & McDonnell, 1998). In a fuzzy set, the grade of membership is not expressed as Boolean true false as in constraint, but rather expressed in term of a range that can vary continuously between 0 and 1. The concept of fuzzy set in GIS-DM procedures can be illustrated using a clay criterion map as in Figure 5;
Figure 4 Boolean membership in Slope Criterion
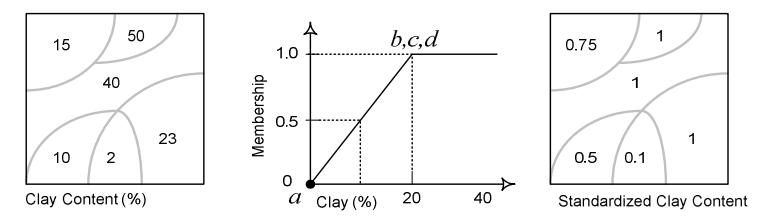
Figure 5 Example of Fuzzy Sets membership in Clay Content Criterion Analysis
The following are the factors which based on the Indonesian National Standard for locating sanitary landfill (SNI 03-3241-1991 and SK SNI T-11-1991-03) and afterward were refined using literatures about sanitary landfill:
- 1. Rain and wind intensity. Rain intensity could affect the amount of leachet potentially contaminate the ground water while wind direction could potentially spread either diseases or odor.
- 2. Soil Type. Preferable soil type for bedding and covering the sanitary landfill must have (i) low permeability, (ii) low (effective) porosity, (iii) large thickness, and (iv) high natural retention capacity for hazardous substances (Dorhofer & Siebert, 1998).
- 3. Geology. Particular rock types suitable as a geological barrier for sanitary landfill are having cohesive and argillaceous rocks properties (Dorhofer & Siebert, 1998). Aquifers, whether sand or gravel layers or heavily fractured rocks like sandstone or limestone, cannot be regarded as barrier rocks.
- 4. Recharge Area. The northern and southern part of West Bandung are mountainous spotted with numerous springs and wells, most of which are used by the local communities. It is important to keep these
- spring and wells clean and uncontaminated by landfill leaches.
- 5. Slope. To keep maintenance easy and to avoid any loose material due to accident such as earthquake, methane explosion, flood, harsh wind, or landslide, any slope steeper than 30% will be considered as less suitable. While ideal slope for sanitary landfill is between 0-30%.
- 6. Road. It is preferable to locate sanitary landfill between 500-600 m from the main road as less than 500m sanitary landfill will disturb the convenience of the road user while beyond 600m is considered to be less efficient as it needs additional costs for new road.
- 7. Center of Waste Producer. The time distance between the sanitary landfill and the centre of waste producer should be around 15 minute by truck. Further than that distance can be regarded as having lower suitability. The layer was derived using "Euclidian Distance" from the center of activities in West Bandung assuming that the area around this point will produces the highest amount of waste than others.
- 8. Land Use. Locating landfill in residential, industrial, school, hospital or any other services land use should be avoided. It is preferable that the landfill is surrounded
- by buffer area where wind, noise, and view are covered by plants or natural landscapes.
- 9. Built-up area. NIMB syndrome should be minimized. It is preferable to find an area where population density is minimal. It is assumed that the population density can be approached with the density of built-up area (expressed in m2 /m2 ). If the density of built up area is low, there will be only a few landowners, and this, in turn, will minimize the social problem. Demography in terms of population density is also important to minimize disturbance from landfill operation to people living nearby. These disturbances can arise from noise and odor. Density of built-up area was derived using the size of contiguous builtup area divided with the total area. This was done using the Density module from Spatial Analyst in ArcGIS.
Figure 6 displays the raw values which are not yet transformed through numerical classification. For the sake of conciseness, the numerical classification of each factor in form of table will not be provided here except for built-up area as an illustration. Complete classification can be provided by contacting to corresponding author.
2.2 Design phase: Defining preferences using different scenarios
The "design" phase determines which criterion receives higher weight than other, or stated in other words; which criterion is more important than others. As weights can be varies depending the decision maker, we propose here four scenarios which consist of three different scenarios thus different interests and one equal scenario to be used as a benchmark for the other three. We tried as close as possible to mimic the real situation when the decision makers use their reasoning in deciding the preferences. The four different priorities are presented as follow:
- 1. Equal Priority. All criteria are weighted equal. It is assumed to be a compromise scenario where decision makers think all criteria have an equal importance. Rain intensity = soil type = geology = recharge = slope = road = center of waste = land use = built up.
- 2. Government Priority. In Indonesia, the government will be the one who build the landfill. They are also in charge for daily operation and management. Thus, the most important thing to consider in their opinion would be the operational costs. Government needs to reduce the cost for buying the land, making construction for the landfill, and transporting the daily waste. Using these reasons in mind, the government will arrange their criteria as follows: land use > built up > center of waste > road > recharge area = slope = soil type = geology = rain intensity.
- 3. Citizen Priority. Citizens always want to put the sanitary landfill as far as possible from their own yards or their main activities (Not in my backyard syndrome). Therefore they prefer the relative importance of each factors as follow; built up > recharge area > land use > soil type = rain intensity = geology = slope = center of waste = road.
- 4. Environment Priority. Environmentalist tries to minimize the impact of sanitary landfill to the environment. Their idea is to conserve the environment by minimizing possible threat from sanitary landfill for instance leaching to groundwater and soil. Thus, they need to make sure that the soil and underground beneath sanitary landfill will not be infected by leaching and in the future, can be re-used for agricultural area or other functional uses. Therefore, they prefer the following relative importance of criteria; soil type > geology > slope > rain intensity > recharge area > center of waste = land use = built up = road.
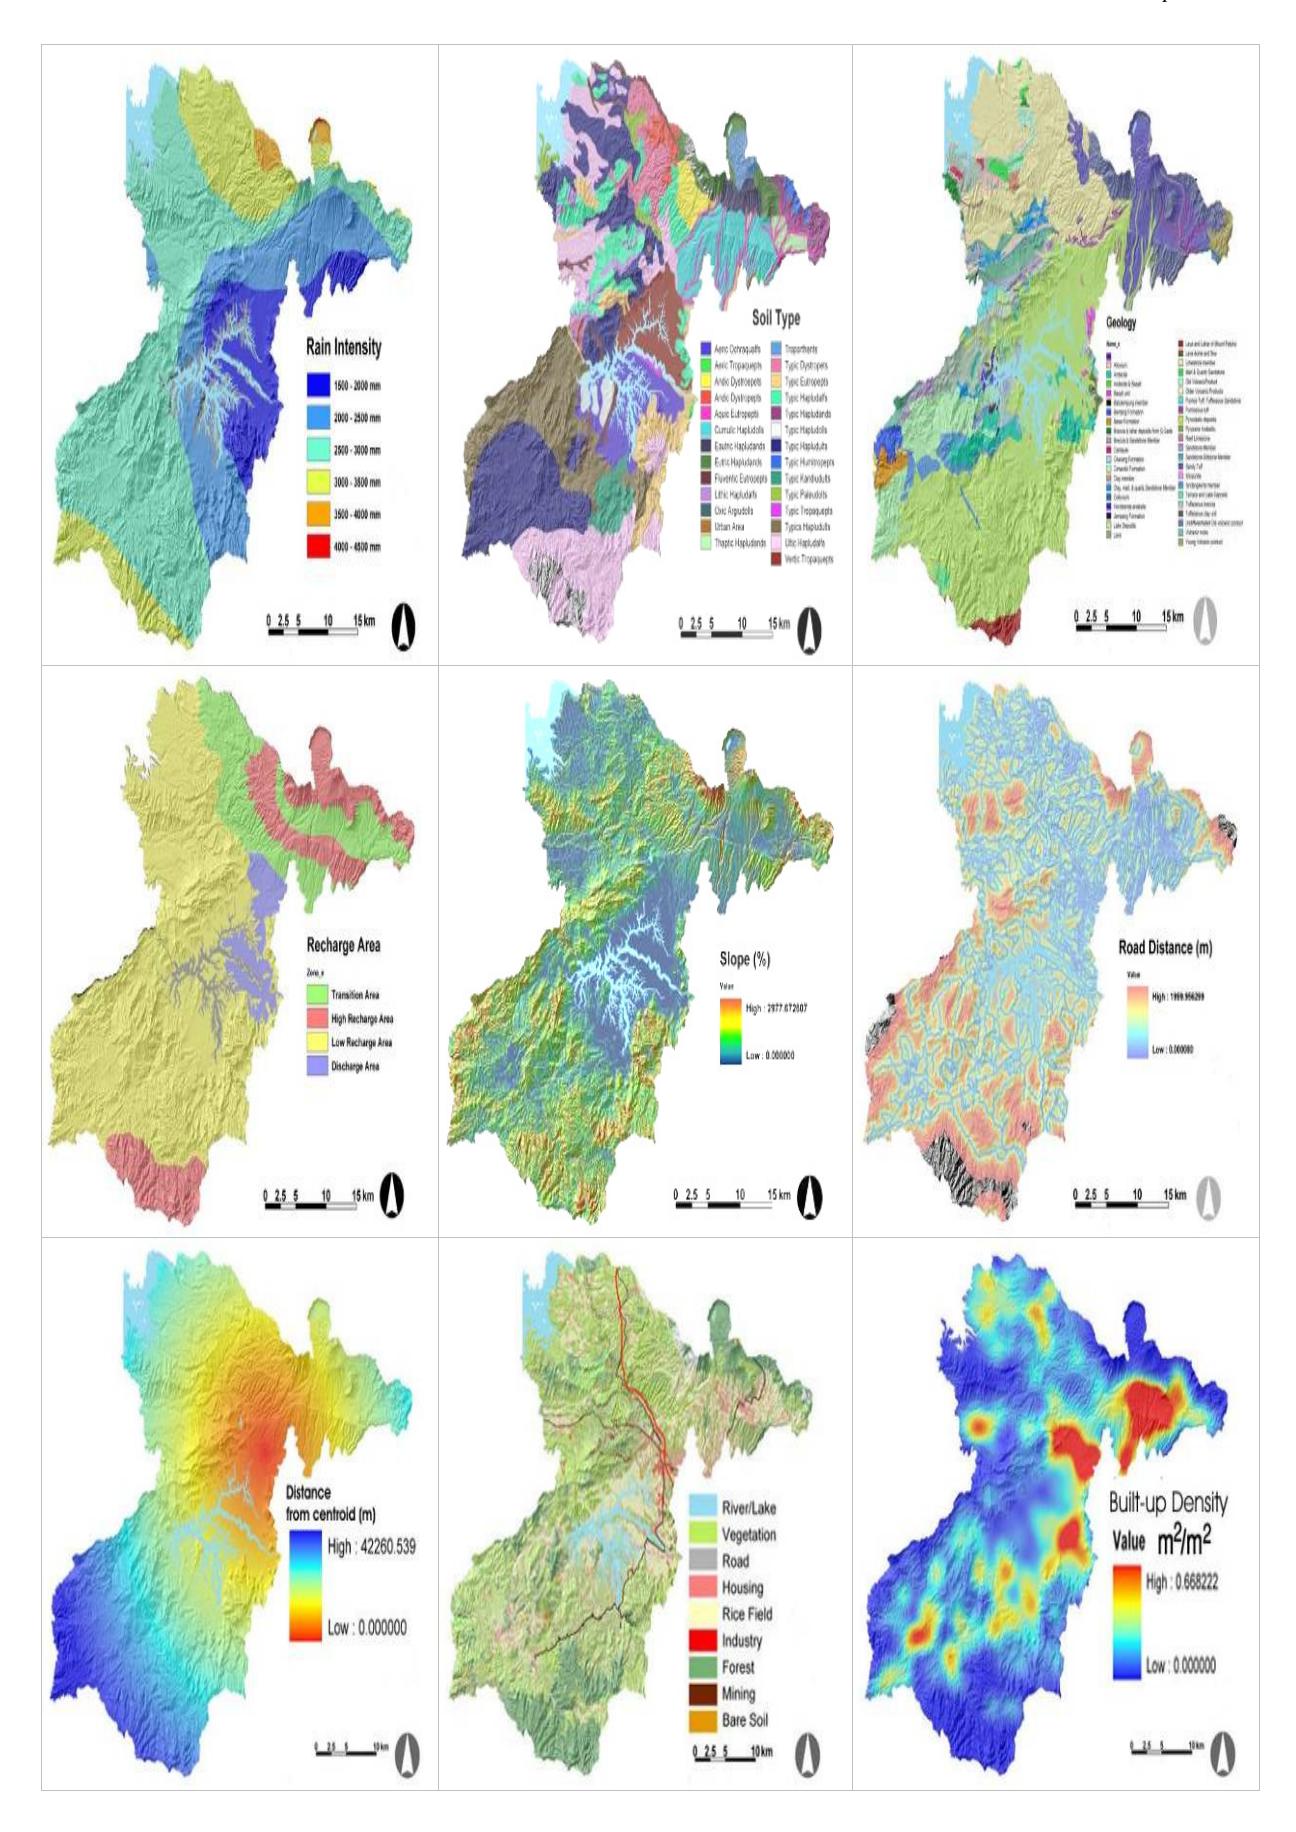
Figure 6. Criteria Used for locating sanitary landfill in West Bandung Map source: Tarkim Jabar 2004. (Settlement 2006)
All the preferences were subsequently quantified using Analytic Hierarchy Process (AHP) methods. This method quantifies all the preferences from each decision maker (scenario) by means of pairwise comparison matrix which was developed in the frame of an Analytic Hierarchy Process (AHP) by Saaty (1990). In this process, the decision makers have to compare two criteria at one time and choose this relative importance of one criterion to another criterion. Pairwise
comparison matrix for every priority and corresponding weight on every criterion is presented in Table 1. The grey cells on the table are the reciprocal cells of the opposite pairwise values e.g. pairwise value of 3 will have 1/3 on its correspondence reciprocal cell. The pairwise comparison matrix allows us to deriving the eigen value which is the weight of each criteria.
Table 1 Pairwise Comparison Matrix for Every Priority to Derive Criterion Weighting
| No | Parameter | Pairwise Comparison | Weight | ||||||||
|---|---|---|---|---|---|---|---|---|---|---|---|
| (1) | (2) | (3) | (4) | (5) | (6) | (7) | (8) | (9) | |||
| Equal Priority 1 1 1 1 1 1 1 | |||||||||||
| (1) | Rain intensity | 1 1 | 1 1 | 1 | 1 | 1 | 1 | 1 | 1 | 1 | 0.11 |
| (2) | Soil type | 1 | 1 | 1 | 1 | 1 | 1 | 1 | 1 | 1 | 0.11 |
| (3) (4) | Geological type Recharge area | 1 | 1 | 1 | 1 | 1 | 1 | 1 | 1 | 1 | 0.11 0.11 |
| (5) | Slope | 1 | 1 | 1 | 1 | 1 | 1 | 1 | 1 | 1 | 0.11 |
| (6) | Distance to road | 1 | 1 | 1 | 1 | 1 | 1 | 1 | 1 | 1 | 0.11 |
| (7) | Proximity to centroid | 1 | 1 | 1 | 1 | 1 | 1 | 1 | 1 | 1 | 0.11 |
| (8) | Land use | 1 | 1 | 1 | 1 | 1 | 1 | 1 | 1 | 1 | 0.11 |
| (9) | Built up area | 1 | 1 | 1 | 1 | 1 | 1 | 1 | 1 | 1 | 0.11 |
| Government Priority | |||||||||||
| (1) | Rain intensity | 1 | 1 | 1 | 1 | 1 | 1/3 | 1/5 | 1/9 | 1/7 | 0.03 |
| (2) | Soil type | 1 | 1 | 1 | 1 | 1 | 1/3 | 1/5 | 1/9 | 1/7 | 0.03 |
| (3) | Geological type | 1 | 1 | 1 | 1 | 1 | 1/3 | 1/5 | 1/9 | 1/7 | 0.03 |
| (4) | Recharge area | 1 | 1 | 1 | 1 | 1 | 1/3 | 1/5 | 1/9 | 1/7 | 0.03 |
| (5) | Slope | 1 | 1 | 1 | 1 | 1 | 1/3 | 1/5 | 1/9 | 1/7 | 0.03 |
| (6) | Distance to road | 3 | 3 | 3 | 3 | 3 | 1 | 1/2 | 1/4 | 1/3 | 0.09 |
| (7) | Proximity to centroid | 5 | 5 | 5 | 5 | 5 | 2 | 1 | 1/3 | 1/2 | 0.16 |
| (8) | Land use | 9 | 9 | 9 | 9 | 9 | 4 | 3 | 1 | 2 | 0.35 |
| (9) | Built up area | 7 | 7 | 7 | 7 | 7 | 3 | 2 | 1/2 | 1 | 0.24 |
| Citizen Priority | |||||||||||
| (1) | Rain intensity | 1 | 1 | 1 | 1/6 | 1 | 1 | 1 | 1/3 | 1/9 | 0.04 |
| (2) | Soil type | 1 | 1 | 1 | 1/6 | 1 | 1 | 1 | 1/3 | 1/9 | 0.04 |
| (3) | Geological type | 1 | 1 | 1 | 1/6 | 1 | 1 | 1 | 1/3 | 1/9 | 0.04 |
| (4) | Recharge area | 6 | 6 | 6 | 1 | 6 | 6 | 6 | 2 | 1/2 | 0.27 |
| (5) | Slope | 1 | 1 | 1 | 1/6 | 1 | 1 | 1 | 1/3 | 1/9 | 0.04 |
| (6) | Distance to road | 1 | 1 | 1 | 1/6 | 1 | 1 | 1 | 1/3 | 1/9 | 0.04 |
| (7) | Proximity to centroid | 1 | 1 | 1 | 1/6 | 1 | 1 | 1 | 1/3 | 1/9 | 0.04 |
| (8) | Land use | 3 | 3 | 3 | 1/2 | 3 | 3 | 3 | 1 | 1/3 | 0.11 |
| (9) | Built up area | 9 | 9 | 9 | 2 | 9 | 9 | 9 | 3 | 1 | 0.38 |
| Environment Priority | |||||||||||
| (1) | Rain intensity | 1 | 1/3 | 1/2 | 2 | 1/2 | 4 | 4 | 4 | 4 | 0.11 |
| (2) | Soil type | 3 | 1 | 2 | 5 | 2 | 9 | 9 | 9 | 9 | 0.31 |
| (3) | Geological type | 2 | 1/2 | 1 | 4 | 3 | 8 | 8 | 8 | 8 | 0.25 |
| (4) | Recharge area | 1/2 | 1/5 | 1/4 | 1 | 1/3 | 2 | 2 | 2 | 2 | 0.06 |
| (5) | Slope | 2 | 1/2 | 1/3 | 3 | 1 | 6 | 6 | 6 | 6 | 0.16 |
| (6) | Distance to road | 1/4 | 1/9 | 1/8 | 1/2 | 1/6 | 1 | 1 | 1 | 1 | 0.03 |
| (7) | Proximity to centroid | 1/4 | 1/9 | 1/8 | 1/2 | 1/6 | 1 | 1 | 1 | 1 | 0.03 |
| (8) | Land use | 1/4 | 1/9 | 1/8 | 1/2 | 1/6 | 1 | 1 | 1 | 1 | 0.03 |
| (9) | Built up area | 1/4 | 1/9 | 1/8 | 1/2 | 1/6 | 1 | 1 | 1 | 1 | 0.03 |
2.3 Choice phase: Decision Rules to derive a composite map
In this phase, the decision rules are decided. This phase runs in ArcGIS© environment and aims to integrate the selected criteria, and decision makers' preferences into one assessment map. The two most common decision rules for assessing the objective are: Boolean overlay and the Weighted Linear Combination (WLC). In the boolean overlay, the entire criteria are assessed by a threshold of suitability to produce boolean maps. There are two common operations in Boolean overlay which are intersection (AND operation) and union (OR operation). Using the boolean overlay AND on the five constraints, the available searching area for sanitary landfill has significantly been reduced from entire West Bandung administrative area into less than 60% of it. The boolean overlay had rule out areas which are not available and non convertible for sanitary landfill. Figure 8 illustrates the possible searching areas for sanitary landfill.
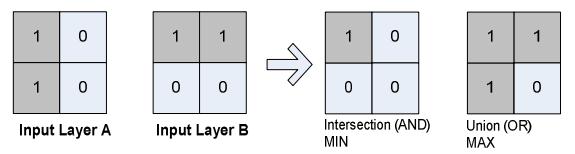
Figure 7 Boolean Overlay for Two Input Layers
The second decision rule is Weighted Linear Combination (WLC). WLC is based on summation of all criteria after multiplied it with its corresponding weight. WLC implements a straightforward process which includes simple map algebra operations as the following equation (Jiang & Eastman, 2000).
\[S = \sum w_i x_i \times \prod c_j\]
Where S= suitability score, wi= weight of each factor derived from pairwise matrix oh AHP, xi= criterion score from factor classification, cj= criterion score (0 or 1) from constraint j.
The suitability score has ranges from 0 to 10 which represent low and high suitability areas, respectively. This process was rapidly done using Model Builder from ArcGIS and the complete step by step process was illustrated in Figure 9;
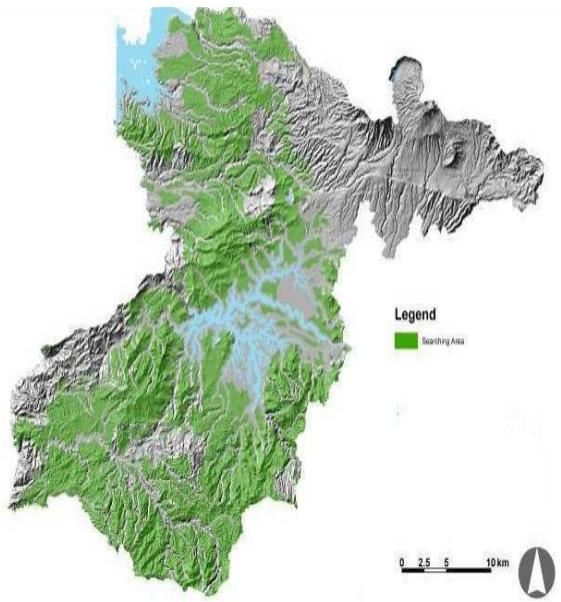
Figure 8. Potential Searching Area for Sanitary Landfill Derived from Constraints
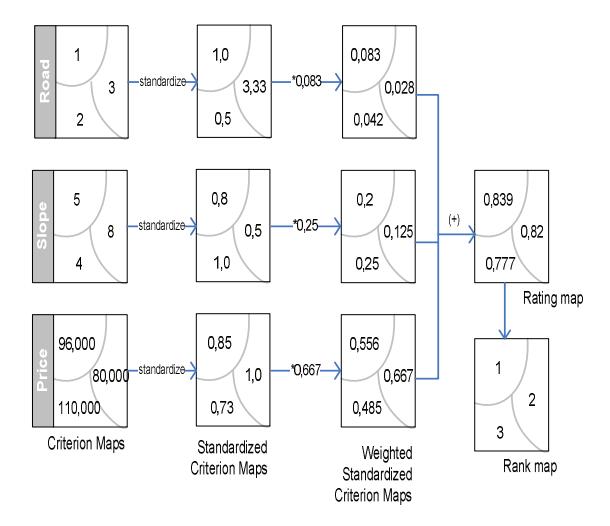
Figure 9. Example of Weighted Linear Combination Method
3. Results and Discussion
3.1 Effect of Priorities in the Selection of Suitable Areas for sanitary landfill
Suitable areas for sanitary landfill from each scenario are displayed on Figure 10 with green
color represents highly suitable areas whereas red represents low suitable areas for sanitary landfill. The general pattern on each priority suggests that indeed each different scenario gives different results. We can immediately see that for equal scenarios, there are least areas for sanitary landfill whereas on environment scenario, more areas for sanitary landfill are available. While on the government and citizen scenarios, they resemble relatively identical pattern with suitable areas on the southern and far northern part of West Bandung. In detail, the total suitable area based on suitability score is presented in Table 3
Definitely, each scenario was shaped by its weights which were derived from the preferences from decision makers. We know from section 2.1, that the government scenario prefer heavily on land use which coincidently parallel to the citizen scenario on built up areas. Classifying built up areas from land use data causes the results of the two scenarios resemble relatively identical pattern. Continue to the environment scenario, it gives unusually everything "green" areas for sanitary landfill which contrary to what we would expect on environment protections' areas. This could stem from the preference of the environmentalist which tends heavily on soil type criterion while almost every soil types are available for sanitary landfill.
Using GIS only without additional preference from the decision maker returns to an "equal" scenarios which turns out to be unrealistic because in reality, preferences always appear and drives the decision out from the "equal" preferences. On the other hand, using DM tools only will not take location problem into account because the tool only concerns on the pairwise relation on every two options apart from where the locations are. Thus coupling the GIS and DM tools is obviously of a paramount advantage in this case.
Table 2. Standardization Score for built-up area in Sanitary Landfill
| Class | Built up (m2 /m2 ) | Score |
|---|---|---|
| 1 | 0 - 0.000001168 | 10 |
| 2 | 0.000001168 - 0.000002336 | 10 |
| 3 | 0.000002336 - 0.000003504 | 9 |
| 4 | 0.000003504 - 0.000004672 | 7 |
| 5 | 0.000004672 - 0.000006229 | 4 |
| 6 | 0.000006229 - 0.000008175 | 1 |
| 7 | 0.000008175 - 0.000010511 | 0 |
| 8 | 0.000010511 - 0.000014015 | 0 |
| 9 | 0.000014015 - 0.000021411 | 0 |
| 10 | 0.000021411 - 0.000099661 | 0 |
3.2 Selecting the Most Suitable Location Landfill based on Contiguous Area
On the previous section, GIS-DM has demonstrated and contributed to a better understanding on choice of every decision makers. Nevertheless, on the practical base, this is not enough. The results showed
Table 3 Total Area of Equal, Government, Citizen, and Environment scenarios with different Suitability Score
| Score | Priority (unit in ha) | ||||||
|---|---|---|---|---|---|---|---|
| Equal | Government | Citizen | Environment | ||||
| 9 | 131.73 | 1,054.37 | 539.48 | 1,757.15 | |||
| 8 | 7,766.47 | 7,925.22 | 15,462.95 | 27,956.21 | |||
| 7 | 25,053.18 | 14,064.65 | 7,141.24 | 18,422.03 | |||
| 6 | 17,258.48 | 11,382.55 | 8,818.53 | 3,352.31 | |||
| 5 | 4,060.14 | 10,732.82 | 7,553.43 | 2,727.20 | |||
| 4 | 2.24 | 6,078.93 | 13,055.13 | 99.39 | |||
| 3 | 0.00 | 2,764.15 | 1,740.30 | 0.00 | |||
| 2 | 0.00 | 246.19 | 1.68 | 0.00 | |||
scattered areas with various sizes and discontinued. To be reasonably manageable, minimum size for sanitary landfill has to be defined. By using simple assumption derived from Indonesian National Standard for locating the sanitary landfill, the minimum size of sanitary landfill to be considered was numerically done in table 4.
Despite every scenario has suitability score of 9 as shown on Figure 11, the "equal" scenario returns to zero solution because it does not have areas wider than 43 ha, whereas the rest of the scenarios at least has one solution. As in figure 11 suggests, generally the solution for location of sanitary landfill in West Bandung are on the far northwest of Saguling lake, and
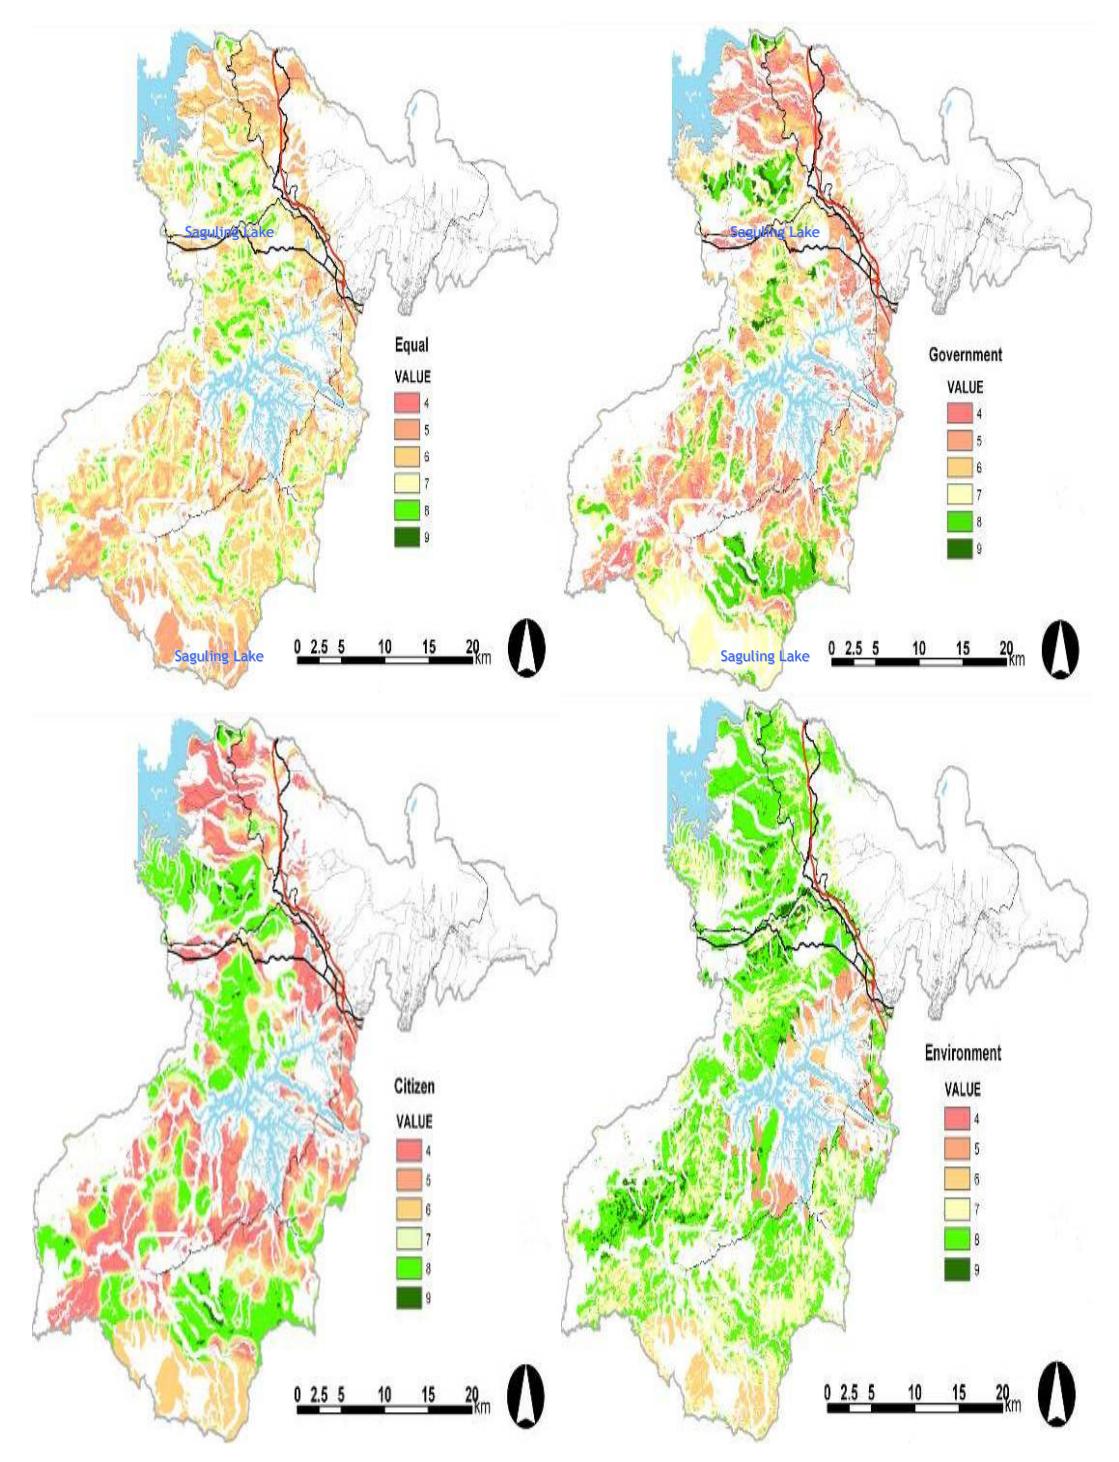
Figure 10 Sanitary Landfill Suitability Maps using Different Priorities
Table 4 Calculation of Minimum Size needed for sanitary landfill
| Calculation | Assumptions | Result |
|---|---|---|
| Population (people) | - | 1,436,777.0 |
| Waste production (litre) | 2 litre/people/day | 2,873,554.0 |
| Waste production in a year (litre) | 365 days/year | 1,048,847,210.0 |
| Compacted Volume (litre) | 4 volume into 1* | 262,211,802.5 |
| Compacted Volume (m3 ) | - | 262,211.8 |
| Area needed with particular depth (m2 ) | 10 meters | 26,221.2 |
| Area needed per year (ha) | - | 2.6 |
| Life Time | 10 years | |
| Area needed in base year (y0ha) | 2.6 | |
| Population growth (a%) | 3.69 | |
| Expected life time (n—year) | 10 | |
| Size of the area for 10 years (ha) | ||
| (yo+(y0(1+a)n-1).(n/2) | 31.0 | |
| Additional receiving area 4 ha | 35.0 | |
| Additional leachate area 4 ha | 39.0 | |
| Additional buffer 10% | 3.9 | |
| TOTAL (ha) | 42.11 |
Source for assumptions: Indonesian Standard for sanitary landfill.
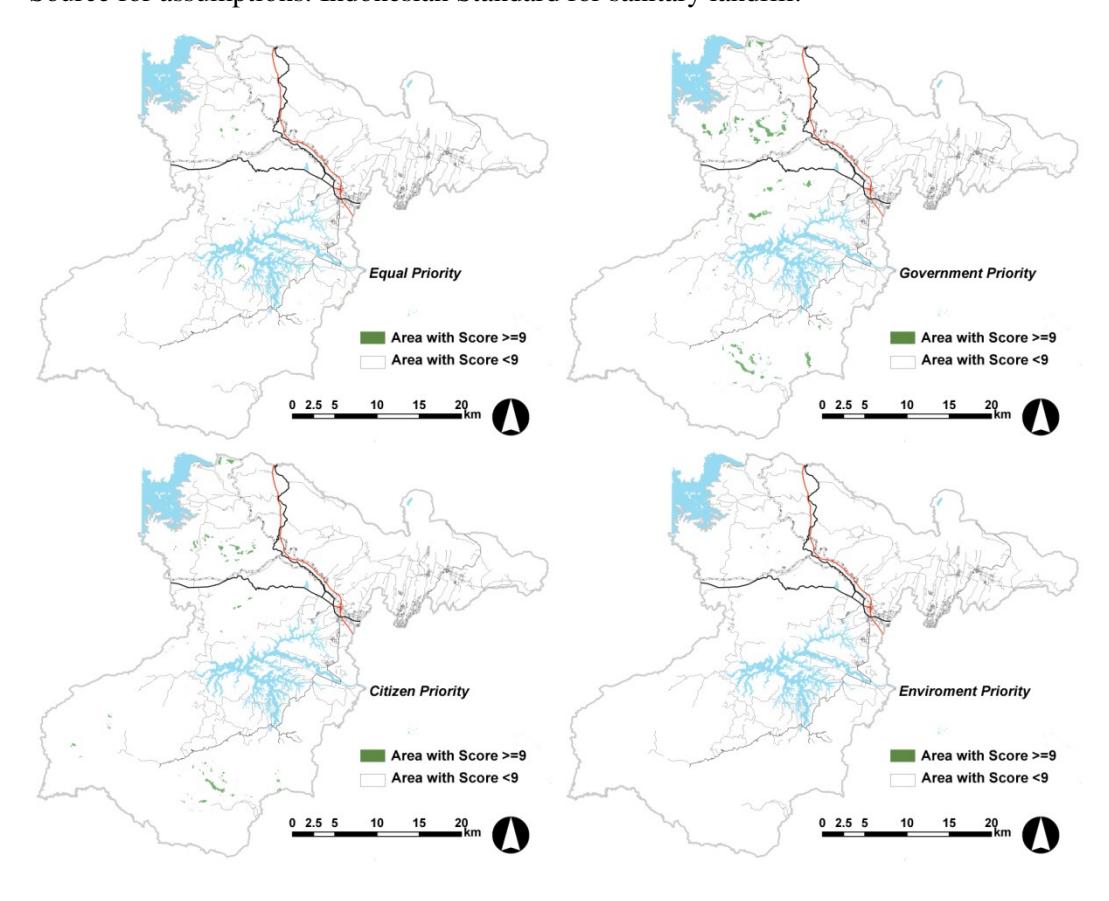
Figure 11 Sanitary Landfill based on continuous areas
southern part of West Bandung whereas on "environment" scenario, this is hardly recognized due to limited areas. The result from "environment" scenario as on F, also suggest that the available areas are scattered into smaller sites. These can easily be seen by comparing result on figure 9 and figure 10 where the first has wider "green areas" as suitable areas, the latter has hardly seen "green areas".
In our case here, there will be no "best" scenarios above all. The decision will always depends on the preferences from decision makers, and GIS-DM works only to assist the decision makers to reduce the option on various location of available landfill. In the case where dispute on landfill allocation emerge, the prime decision maker i.e. government could simply simulate the preference from each party to understand what they wants, and eventually could settle down the problem by looking for the compromised location easily using GIS-DM as simulated in this paper. Finally, the solution offered by GIS-DM is by no means replacing the traditional manual procedures. In fact, it is necessary to finally test each solution by taking detail sampling for example soil sampling, geological testing, or social acceptance to acknowledge the real situation of each solution.
4. Conclusion
This paper has demonstrated the ability of GIS-DM procedure in solving Single Objective Multiple Criteria type of problem. It was done by simulating different scenarios of preferences on criteria for sanitary landfill allocation in West Bandung, West Java, Indonesia. The results suggest that allocating sanitary landfill is sensitive to the preferences of each criterion. Changing the combination of preferences will shift the results to another shape. It can be suggested that local government who will allocate the sanitary landfill should recognize all the preferences from every stake holder in order to acknowledge their preferences and minimize the subsequent disputes.
Looking on the results from every scenarios particularly on "government" and "citizen" scenarios, it can be suggested that GIS-DM procedures, like other GIS-based procedures, is sensitive to input data as the main source for subsequent analysis. Similar pattern on government and citizen scenarios can be addressed to the similar input i.e. land use criterion for the analysis whereas on environment scenarios, the "all green" solution was derived from the less meaningful attribute of soil type.
Obviously, solutions offered by GIS-DM procedure should be accompanied by a true field sampling to identify real and recent situation of the site. Thus, GIS-DM can be used as preliminary step to filter unnecessary sites to be sampled.
In respect to the ideal situation, the mapping database used in this paper was based on 2004 dataset and can even be older for tabular database, thus it is necessary to update the dataset to make better results. As regard to validity of the dataset, this paper did not validate the mapping database which might leads to unreal situation and becomes the source of deviation. It is suggested to validate the mapping database at early stage or to find another source of validation before using the database. Fulfilling these two remarks would inevitably improve the validity of the results.