

I. Introduction
In this globalisation era, rich countries are getting richer and poor countries are getting poorer each year. This does not mean that poor country does not do anything. The fact is that all country produces and sells something, but why richer countries have higher return? Not only advancement in production technology and human capital for production, rich countries also have an enormous market access for their products. With their limitation in all
resources (development budget, human capital and influencing power) how could other countries compete? This article tries to illustrate how this growth centre based concept implemented in the real world. The comparison will be between three established Free Trade Zones, i.e. Batam (Indonesia), Subic (the Philippines), and Shenzhen (the People's Republic of China). Batam development started in 1973 and expanded as a bonded warehouse in 1978.
The present Batam is a Free Trade Zone with an enclave industry zone and governed by authority administration. The Subic FTZ was founded in 1992 and located at a strategic bay location. It is a whole free trade zone area and governed by a single authority. The Shenzhen SEZ is the oldest and largest in China and was founded in 1980 with manufactures mainly from Hong Kong. The Shenzhen SEZ is a part of Shenzhen City with its own Free Trade Zone authority and developed with solely for industrial and investment destination.
This paper is divided as follows, second section introduce concepts of free trade zones and current developments. In section three we overview recent development of each free trade zone with competitive factors and performance indicators. Then we present a slightly statistics calculations in section four. Eventually in section four we summarize the paper and discuss possible future development.
2. Concepts of Free Trade Zones and Special Economic Zones
Economic geography attempts to solve the limitation of development resources with agglomeration and spatial concentration economies concepts (Amiti and Cameron, 2007). The defining issue of the new economic geography theory is explaining the formation of a large variety of economic agglomeration in geographical space. Marshall identified three reasons for concentrations, i.e. pool market for workers and firms, specialized supplier and knowledge/technological spill over (Krugman, 1991a, 1991b).
The neoclassical approach views that economic growth is the increase of productivities to generate and accumulate resources and argues that output growth is a result of three factors of production (Pike et al, 2006). In regional growth, neoclassical assumption has two main impacts, (i) as the stock of capital increase, regional growth become slow and halt and (ii) the first impact leads to convergence among regions since diminishing return of investment occurs in rich regions and poor regions has the resources to develop (Cricelli and La Bella, 1999). However, this view was challenged by the cumulative causation theory that emphasizes that growth tends to fees itself to circular and cumulative way that leads to uneven development between regions (Myrdal, 1957). This theory's argument was that increasing return is the result of agglomeration external economic and historical path of localities. Furthermore, the development of prosper regions have effects to other regions through labor and resources linkages, known as "spread effect" (Hirschman, 1958). The theory was further developed by Fujita and Krugman (1991, 2004) that argues that the increasing returns to scale of spatial concentration explains both concentration and dispersion. The vertical structure of firm relations used as a model of upstream and downstream sectors to describe backward and forward linkages that tend to concentrate the producers in a single location (Krugman, 1991a). In addition, the authors argue that the decline of transport costs also contributed to the increase of supplierproducers networks and integration.
Following this path, policy makers and economic experts established free trade zones as a revival of world's major ports for transhipment, storage, and re-export of goods without customs formalities (Wong and Chu, 1984). The first concept to adopt these was the export processing zones (EPZ) that is defined as establishment of modern manufacturing offering incentives and suitable packages for both domestic and foreign firms. The second concept is the Free Trade Zone (FTZ) refers to EPZs that have free port, commerce and finance facilities. The most complete concept is the special economic zones (SEZ) that have much larger spatial size and economic capacities. The SEZ is a comprehensive area with various sectors besides manufacturing such as real estate development, tourism, agriculture, and financial centres (Wong and Chu, 1984).
The free economic zones in general refer to central government's intensive investments in a potential region with wide opportunity to develop and promote by a set of policies that are not applicable to other regions (Ge, 1999). The areas usually are areas with comprehensive natural endowments, already established market access and integrated infrastructure.
3. Zones Overview, Competitive Factors and Performance Indicators
In this section general overview about the zones will be discussed including history, social geography and recent developments. In addition, the competitive factors and performance indicators will be described. The comparison will be divided into two indicators, i.e. Competitive Factors (Natural Condition, Human Capital, Policy, etc) and Performance Indicator (Investment, Export-Import, etc). The comparison observes agglomeration and specialization impacts Free Trade Zone's economic performance.
3.1. Batam Free Trade Zone
Batam Island was established as a logistic base for Indonesia Oil and Gas Company (Pertamina) to store and distribution route of oil mining in the 1960s. Considering its prime and strategic location, in 1973 the Indonesian government declared it as an industrial zone and established Batam Industrial Development Agency (BIDA) as the region administrator. In 1978, the Indonesian government promoted Batam island's status as a bonded zone and in 1992 the bonded zone was expanded by adding 5 small islands surrounding Batam island, known as Barelang (Batam-Rempang-Galang) islands (Batam Industrial Development Authority, 2008; Aritenang, 2003). Batam Island is located within Riau Islands areas, which used to be under the administration of Riau Province and now it is a part of Riau Islands Province. Batam is accessible by various transportation modes. The Hang Nadim Airport is one of Indonesia's international airports and has the runway for large passenger carriers. Up to 2002, at least four domestic airways and two international airways operated services in Batam skies with an annual total service of 16.000 flights. Moreover, Batam Island is also accessible by ship, which usually transits as part of the trip from Sumatra to Java. Batam Island also has several ports to serve sea transport between Riau Islands such as Batam centre, Sekupang, Batu Ampar, and Kabil. In many aspects, Batam's location, development and government investments is unrepeatable and unique Indonesia (Phelps, 2004).
Together with transport accessibility, low cost land and cheap labour cost attracts the number of multinational enterprises (MNE) to Batam with Singapore's government initiative
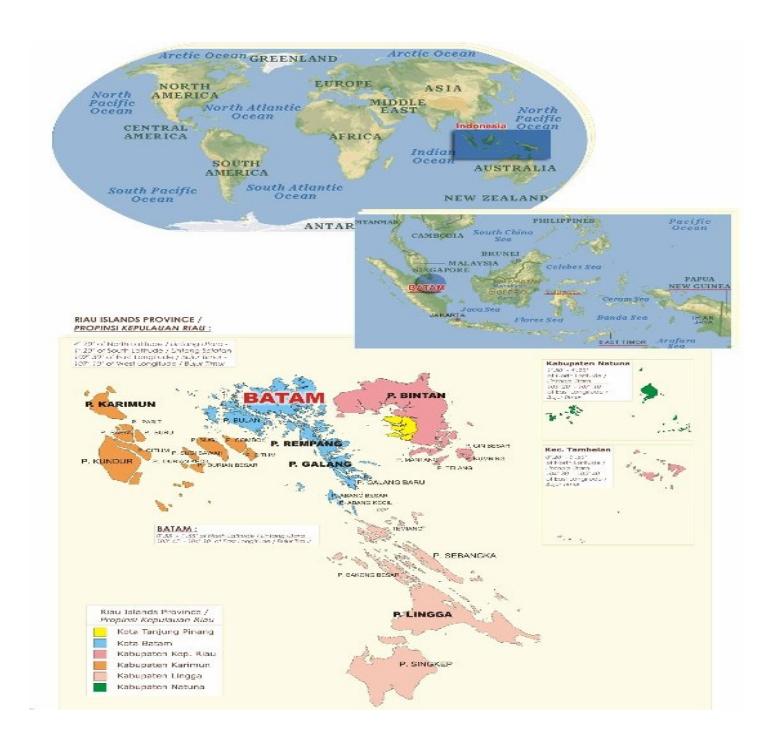
Figure 1. The location of Batam Island Source: www.batam.go.id, 2008
(Phelps, 2004). In line with its economic growth, between 1995-2002 Batam population also grew rapidly with more than 112% or approximately 12% annually. Immigration plays important role in this fact since more than 50% of the annual population growth is new comers. Consequently, Batam since the last ten years has encountered squatter and slum problems. In 2002, it was estimated that 50.000 slum housing units were built. Not only against the law, these slums and squatters also created other problems related with environment, health services, urban infrastructure and education. It was revealed that the squatter has blocked the catchments area which causes flood and clean water problems (Muliono, 2001). Another population problem is the increasing number of dependency ratio in Batam Industrial Zone. In 1995, the ratio was 1.6 and increased in 2002 to 3, which means that each industry worker has to work for 3 persons including themselves. This fact eventually decreases
income per capita and quality of living within the zone (Seda, 2003).
Batam Island could be considered as a small Indonesia with many ethnic and traditional languages can be found. The Java ethnic is dominant with 27% of the total population followed by Malay (21%) and other ethnics including Chinese, Sumatran and Flores. Four main languages that are used are Indonesia, Malay, Chinese, and English (by the business and industrial workers). The activities of Batam industry started with foreign direct investments from Singapore, which built the first industrial zone in Batam, Batamindo. Up to 2002, more than 12 industrial zone had been established and had provided more than 172,000 jobs. Both domestic and foreign investments were worth US$ 7.3 billion with more than 8000 companies. In addition, Batam has also been listed as tourism destination area, rank number two after Bali. Most of the tourists come from Singapore since the low
price that Batam offers for hotels, golf resort, yachting, and food tourism. In the information technology, Batam is also one of the country's most advance regions. In 2001, Batam Intelligence Island (BII) was launched and consisted of e-government, e-infrastructure, and e-business. This fibber optic and microwave based-technology serves sectors such as governments, industry, education, communication, and tourism.
3.2. Subic Bay Free Trade Zone
The zone was built on the former United States of America (USA) military base operated between 1900 and 1991. Based on Act 7227, the Philippines' government established Subic Free Zone with Subic Metropolitan area as the authority (SBMA). Subic free zone use sfacilities that the USA military used to own as industrial purpose facilities such as military gym converted to public gym, military warehouse converted to industrial warehouse, etc (Subic Bay Metropolitan Authority, 2008).
Subic is located at the northwest of Manila, the Philippines capital city and has a total area of 42 km2 . Subic area is accessible by many transport modes including highroad from Manila and Clark Zone (Philippines new free zone), Subic Bay International Airport, and shipment. The zone is a restricted area with only 3000 inhabitants and the nearest city from Subic is Olongapo with 240.000 residents and most of the industrial zone workers are recruited from this city. The white-collar worker and expatriate are provided with housing while the industrial workers are provided with flats and low price housing rent. As an international industrial zone, the common languages are Filipino and English.
Subic's development consists of industrial and trade activities with land divisions for several purposes such as commercial and tourism (181
Ha), business parks (5 Ha), offices (0.85 Ha), and shipment activity (1.5 Ha). In addition, Subic also has developed Subic Gateway consists of convention hall, shopping mall, and hotels. Moreover, the zone has also built Techno Park which is a joint investment with Japan for hosting Japanese industries such as Omron cooperation, Nihon Inter Electronics, and Sankyo Seiki (Subic Bay Metropolitan Authority, 2008). Other recent development includes Subic Bay industrial zone, Subic Bay Art Centre, and Moonbay Marina for exclusive residents. Subic has also established its high technology industries and supported it with Global Information Super Highway for E-Subic and Cyber City (following the Silicon Valley concept).
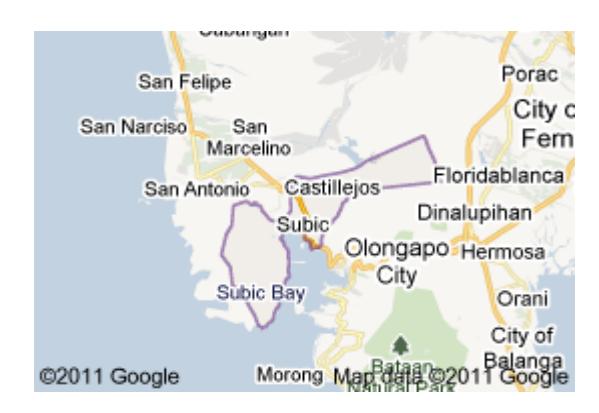
Figure 2. The location of Subic Bay Free Trade Zone.
Source: //maps.google.co.id, 2008
3.3. Shenzhen Special Economic Zone
Shenzhen was established as a free zone in 1980 following China's open trade regulation as one of the first five free zones in China and one of two free zones in Guangdong province, beside Zhuhai SEZ. Before the development as a SEZ, Shenzhen was a fisherman village, but changed dramatically considering its advantage as it shares a common border with Hong Kong. The Chinese government decided to invest in Shenzhen as a means to share Hong Kong's high trade activities (Putatunda and MacPherson, 2001; Shenzhen Municipality, 2008).
The Chinese government established two free zones within Shenzhen, Shatojiao and Futian free zone, in 1987 and 1991, respectively. Later, Yantian free zone was build 1996 and Louhu district was established as financial and trade centre while Nanshan district is known as centre for high technology industries. Shenzhen zone is located at the South China Sea with a total area of approximately 2020 km2 . City of Shenzhen has eight districts including Futian, Nanshan, Luohu, Yantian, Bao'an and Longgang. While only the first four districts are included in Shenzhen Free zone.Shenzhen is also easi to reach because it has its own international Airport and many seaports including international port at Yantian. Shenzhen has 9 ports across its 230 km of beach line, both for passenger and cargo. Shenzhen is accessible by sea transportation from other China trade centres such as Hong Kong, Zhuhai, Macao, and Kowloon. In addition, Shenzhen is also connected by railway with other cities including Guangzhou and Beijing. Hence, it is evidence that Shenzhen was established as a recipient of migrated manufactures from Hong Kong as it shifts as a financial centre
Since it was opened 25 years ago, Shenzhen's population had grown rapidly from 30,000 in its early years to up to 7 million residents in 2008 (Shenzhen Municipality, 2008). The authorities claim that Shenzhen's population is highly educated with 8060 people from 100.000 graduated from tertiary education and dominated by working age people (25-60 years old). The population structure has contributed significantly in Shenzhen's role as centre for high industry manufacturing location. Since the mid 1990s, Shenzhen started high technology industries and since then it has been significantly contributed to Shenzhen's export up to 41.5% and 17.2 % of its income in 2002. Overall, the high technology industry is worth more than 46% of all national products in the sector including telecommunication, computer software, bioengineering, and financial services. Besides manufacturing industry, Shenzhen has also developed as a financial service with more than 55 domestic and 200 international financial companies. Moreover, Shenzhen's stock exchange has a value of RMB 1.74 billion. Shenzhen has tourism locations such as Splendid China (miniature of China) and several theatres (Shenzhen Investment Board, 2008). In economic sector, Shenzhen's GDP grew rapidly almost 32% in average annually. Shenzhen GDP worth US$ 2.5 billion with almost 50% is from industrial sector. Foreign direct investment (FDI) is US$ 21.6 billion, which are 18% of total FDI in Guangdong province and the fourth largest in China cities. Meanwhile Shenzhen has the highest export value among China's cities with 14.5% of national total export.
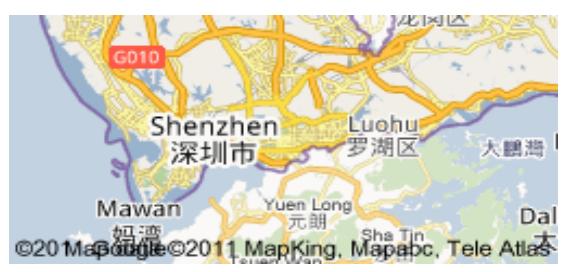
Figure 3. The Location of Shenzhen Free Trade Zone.
Source: www.sz.gov.cn, 2008
3.4. Competitive Factors
This research uses formal convergence equation following the neo-classical approach (Islam, 2003). Natural Resources: Natural resources in this study are defined as natural characteristics that are used as basic resources in developing the zone. First, total area of the free zone - the more area the more potential to develop. Shenzhen is a free zone with the largest total area, i.e. 2021 km2, followed by Batam (715 km2) and Subic (600 km2). Second, all of the free zones are located at the seashore, both for shipment access and passenger ships. A certain depth (i.e. 13 meters) is required to construct a seaport and for free zones, which is aimed as a trading economic centre with vessel cargo. Third, the physical type is also considered to influence the potential growth of the free zone. While Shenzhen and Subic are located within the main land and have an unlimited land expansion, Batam is an island. As a matter of fact, Batam has already anticipated its growth by connecting several nearby small islands (known as Barelang islands). Finally is the distance to an economic centre. Both Shenzhen and Batam are established to handle multiplier effect from their nearby economic centres, Hong Kong and Singapore, while Subic depends much on its location at the centre of South East Asia region.
Human Resources: Human resources are important factor in developing the free zone. More population at working age could mean more working force for the Free Zone. Per 1000 population, Batam has the most working age population (767 inhabitants), Shenzhen (710) and Subic (602). In addition, knowledgeable and skilled workers will also attract firms since it will lower training and education cost. Skilled worker (university diploma) is calculated at each 1000 population and found the most in Shenzhen (166 people),
Subic (106) and Batam (40). This figure is shocking since it means that Batam has the lowest ratio of working age population and skilled workers. This perhaps will influence the industry type that established in Batam. Moreover, it is found that the free zones are not a traditional culture related. All zones are dominated with migrants, both domestic and foreign. Shenzhen is an open city with many expatriates. While Batam has been an industrial zone that attracts many labour from many regions in Indonesia. Subic, on the other hand, as a former USA base, has already established an open society and English language based community.
Local Policy: As the policy maker, local authorities plays important role in operating the free zone. The local authorities are responsible to forming local policies including investment service and working permit. Shenzhen and Subic free zones are administered by a single authority, which will ensure local policies and regulations, Shenzhen city council and Subic Bay Metropolitan Authority, respectively. While Batam free zone, since the Autonomy Act of 1999, is administered by two authorities, i.e. Batam Industrial Development Agency and Batam City Council. Although currently it has been separated, two local governments still raise uncertainty in the zone. Moreover, local policies could also measure in investment services. Shenzhen investment procedure is reckoned better than others because it only involves a single authority, the Shenzhen city council. While in Subic, the investment procedure includes central authority such as Revenue Department and Stock Exchange Commissioner. In Batam, investment procedure starts from BIDA, sent to Investment Coordination Bureau (BKPM) and later on to the Department of Finance, with a total of 3 weeks. In addition, there is also a resident regulation in all free zones but in Batam the regulation is not strict as in other zones. In Subic and Shenzhen, only those that have working permit are allowed to enter the free zones.
Infrastructure: Infrastructure is the main capital investment that government has to do. Overall, Shenzhen is the most advance free zones with 17 ports with a total 7.600.000 TEUs, and total berth of 2350 m that could handle 10 vessels at the same time. By road, Shenzhen is accessible with a 145 km high road from Guangzhou, largest city in Guangdong Province and trains from other cities in mainland China and Hong Kong. Batam infrastructure has 6 ports with a total of 100.000 TEUs and berth length 420 m. Batam is connected with ferryboat and ships from other cities. Subic has 1 main port with 560 m berth length. Airport cargo capacity is also important in trade movement. Shenzhen has one international airport with a 338.000 ton cargo capacity followed by Batam international airport with 16.230 ton and Subic international airport with 30.000 ton.
Public utilities are crucial in attracting firms. The better and cheaper the utilities, the more they draw firms. Subic offers the best utilities with electricity at US$ 0.03/KwH with a total power 130 MW and water supply at US$ 0.6/m3 with a total of 382 litres per second. Shenzhen provides a total of 3000 MV (US$ 0.06/KwH) of electricity and water supply 4768litre/second (US$ 0.18/m3). Batam has quite expensive utilities with a total of 377 MV (US$ 0.5/KwH) of electricity and water supply 1760 litre/second (US$ 0.78/m3). Other utility is the availabilities of fix phone lines, which will be important for the firm activities. Shenzhen has provided 2.130.000 phone line, Batam at the second place with 100.000 lines and Subic with 61.000 lines.
National Policy: National level policy affected the free zones directly and indirectly. First is the zone's establishment act and regulation. Shenzhen and Subic establishment is clear and rigid in their own act. Shenzhen is established by the State Council Regulations for the Special Economic Zone by Standing Committee of 1980, while Subic is established under the Act of Bases Conversion and Development Act of 1992 under Republic Act 7227. On the other hand, Batam was established under Presidential Decree No.74 of 1971 as petroleum hub, then Industrial Zone with Presidential Decree No. 41/1978 and Bonded Zone with Presidential Decree No. 28/1992. The latest regulation is the Government Regulation of 2006 which stated the area as an enclave Free Trade Zone. Related with the central government policy, the formation of the authority is also an interesting subject to be concerned. Both Batam and Subic have autonomous authorities, which act as representative of the central government, while Shenzhen free zone is governed by the city council. A short analysis of the authority could be examined below
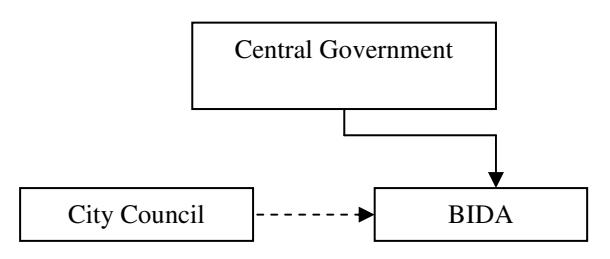
Fig. 4. BIDA Governmental Form
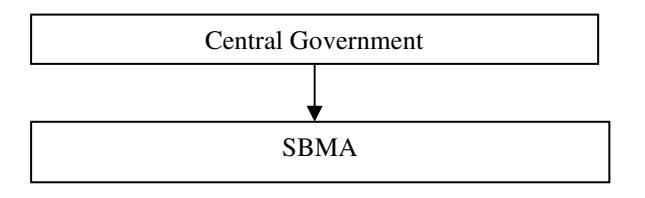
Fig. 5 SBMA Governmental Form
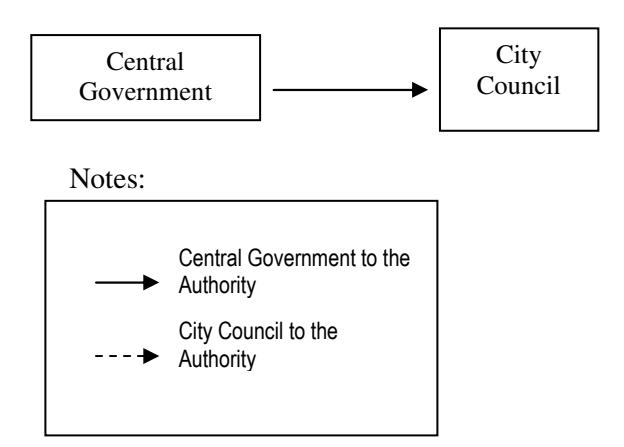
Fig. 6. Shenzhen Governmental Form
The figures above (Fig. 4-6) illustrate the relationship between the governments. The BIDA is a representative of the central government. BIDA and the City Council agreed to administer different activities in the region. While BIDA works on the enclave FTZ and manufacture, the City Council is responsible for land administration and community matters. The second figure shows that SBMA is a representative of the central government to administer the Subic free zone. The last figure suggests that the Shenzhen City council is the administrator of the Shenzhen special economic zone.
Shenzhen has a tax holiday policy to companies until they gain profit. For non high technology companies, tax holiday is given for 2 years which is then continued with a 50% revenue tax for the next 2 years. For high technology companies, holiday tax is given for 3 years which is then continued with 20% and 50 % of revenue tax for the next 2 and 3 years. Subic, on the other hand, only gives 3%-5% tax privilege for revenue tax and there is no additional tax holiday in Batam. Another national policy is the minimum wage, with the lower the labour wage, the more attractive for firms. Shenzhen regional wage is the lowest with US$ 40 per month compared with Batam and Subic at US $ 53.7 and US$ 117
respectively. Other facilities and services that a zone offers will also attract firms. For example, all free zone also has provided free port, tourism services, and warehouse. Shenzhen has more to offer with forming a financial centre including Bank, securities companies and insurance firms. All these additional services are expected to draw more industrial firms to the free zone.
Market Access: The central Government's foreign policy also plays a crucial part in developing the free zone. Shenzhen has a huge opportunity to grow and develop since China has regulated Hong Kong as the centre for financial service and all industrial matter will be moved to Shenzhen. This policy has increased Shenzhen competitive position since foreign companies can rely on advance facilities that has already been established in Hong Kong. Shenzhen also has enjoyed China's cooperation with Japan (8.5% of total investment in Shenzhen) and USA (6.3%). Batam and Subic also try to gain more trade from the region, as Indonesia and Philippines is part of the Association of Southeast Asia Nations (ASEAN) and Asia Pacific Economic Cooperation (APEC). In addition, tied with history and current cooperation, Subic also could gain more foreign firms based on the Philippines' cooperation with USA. On the other hand, Indonesia does not have a special trade agreement with USA, although studies have been conducted (Hufbauer and Rahardja, 2007).
3.5. Performance Indicators
Investment: Investment indicator shows the number of investment, both domestic and foreign investment in the free zone. In 2005, Shenzhen had the highest total investment with US$ 21.600 million with 10.000 investors, followed by Batam US$ 3620 million with 611 investors and Subic US$ 1046 million with 618 investors. Although Batam has fewer firms than Subic, its investment value is higher. This shows that firms in Batam have higher value than in Subic. Another analysis is the Government-Private investment ratio. The higher the ratio the more effective is government's investment to attract companies. Comparing the three free zones, Shenzhen Government successfully obtained firm investments 3.2 times than it invested, followed by Batam (1.7) and Subic (1.5).
Investment growth also highlights free zones performance. Recently, Shenzhen grew rapidly with almost 29% annually, while Subic at the second place with 12% and Batam with the slowest growth (9%). An interesting finding was that the growth in the free zones was not interrupted by the Asia financial crisis in 1997. In 1997-1998, Batam experienced 4% growth, while Subic and Shenzhen had a higher growth (21%). Trade (Export Import): Free zone export import indicator shows trade activities with foreign countries. With the highest investment and firms, Shenzhen has the highest export with a value US$ 46.557 million, followed by Batam US$ 5000 million and Subic US$ 1310 million. During 1995- 2005, Subic experienced the highest export growth at 23.4% annually while Batam export, with a relatively steady investment growth, only grew 11%.
However, Batam export value worth 8% of total national export, below Shenzhen contribution to China export at 14.3% and Subic only add 4% of Philippines total export value. Another comparison is the ratio of export-import that can indicate free zones activities orientation. Batam ratio index (0.1) is the highest followed by Subic (0.08) and Shenzhen (0.07). This figure shows that products in Batam are traded to foreign countries compared with other zones.
Gross Domestic Product (GDP): Gross domestic product (GDP) illustrates total production of a region. Shenzhen has the largest economy activity with a GDP at US$ 81.120 million and Batam almost US$ 9167. While Subic, which is considered as a part of Olongapo city, has a GDP at US$ 8087 million. According to other performance indicator, Subic experienced the most rapid GDP growth between 1995-2005 at 10.1%, followed by Batam (6.86%) and Shenzhen (5.92%). In addition, GDP/capita figures are also valuable to view to understand a region's population productivity. Shenzhen has the highest productivity per capita with US$ 17370.45 compared with Batam (US$ 1577.71) and (US$ 3341.74). A shocking finding is that the GDP/capita in Shenzhen experience a minus growth (-15%) while it still grew in Batam and Subic, 7% and 7.43% respectively. This figure shows that Shenzhen population growth is higher that the region's output growth.
Tax Revenue: Tax revenue is the main funding source for a region. The more economy activity within a region, the more tax revenue it could gain. The highest tax revenue is Shenzhen (US$ 2303 million) followed by Batam (US$ 94 million) and Subic (US$79.6 million). Subic also obtain the highest tax revenue growth at 23.5 % annually, in contrast Batam and Shenzhen obtain tax revenue growth at 26.9 % and 23.5%. In national terms, Shenzhen tax revenue contributed 2.2% of total national revenue while Batam and Subic only 0.9%. Migration and Employment Rate: Development in a region will not only attract firms, but also migrants. Economic activities have increased job vacancies in the regions, both skilled and unskilled jobs. For a zone like Batam, which is still dominated by intensive labour industries, economic growth has drawn many unskilled workers. This is an ironic story
since the job vacancies are not as many as the domestic migrants and causes unemployment rate increases. Shenzhen free zone is the most populated zone with migrants, which is 80% of its population. While more than half of Batam residents are migrants (52%) and Subic population are made up of 27.5% of the population. Between 1995 and 2005, labour forces grew > 130% in Subic followed by Shenzhen (81%) and Batam (46%).
An important regulation that has been implemented in Subic and Shenzhen is the migration policy. In both zones, only permitted person is allowed to enter the zone, such as labour worker and tourist. This is applied to prevent over populated and unemployment rate that could be found in Batam.
4. Statistical Analysis
This chapter assigns several basic statistic formulations to view the zone from different perspectives. First, general overview about the free zones could be done with the Location Quotient analysis. This simple calculation could show the level of industrial output and compare it between the free zones. Second, we assign the statistic formulation using correlation analysis to examine the relation between the competitive factors and performances. In this analysis, dummy variable is employed to qualitative data so it can be analyzed in the correlation statistics. The output of this analysis is the significant level of each competitive factor to affect the free zone's performances.
4.1. Location Quotient (LQ)
Location Quotient calculates the contribution of an economic sector within a region by a ratio between the indexes in the region with national index (Tarigan, 2006). The formulation is as follows:
\[LQ = \frac{x_{ir}/GDP}{x_{in}/GNP} \tag{1}\]
The xir is sector's share in GDP share and xin is sector's share in GNP. The equation explains the ratio share between Industry and Service sectors in Free Zone and whole national, each relative to its gross product value. The LQ value between sectors is also quantified.
Table 1 Region growth domestic product/GDP (US$ million)
| GDP | |||
|---|---|---|---|
| Industry | Service | Total | |
| Batam | 578.7 | 191.32 | 916.7 |
| Subic | 566.1 | 242.6.1 | 808.7 |
| Shenzhen | 40.560 | 38937 | 81120 |
Table 2 Country gross national product/GNP (US$ million)
| GNP | |||
|---|---|---|---|
| Industry | Service | Total | |
| Indonesia | 228.000 | 287.848 | 654.000 |
| Philippines | 99.200 | 148.000 | 310.000 |
| China | 3.631.000 | 2.541.000 | 7.262.000 |
Table 3 location quotient index
| LQ | |||
|---|---|---|---|
| Industry | Service | ||
| Batam | 1.81 | 0.47 | |
| Subic | 2.18 | 0.63 | |
| Shenzhen | 1.01 | 1.37 | |
The calculations above indicate that free zone is more industrialize than the nation as a whole. Subic rapid industry growth has the highest LQ index (2.18) compared to Batam (1.81) and Shenzhen (1.01). The table also shows that both Shenzhen and China are industrial regions. In the service sector, Batam and Subic indexes are lower than the national index. This suggested that there are other regions in Indonesia and Philippines that serve as its service and financial centre, such as
Jakarta and Manila, in respective countries. On the other hand, the service sector activities in Shenzhen show higher than in the country's index, explaining that Shenzhen is an established economic activity region in China for both industrial and service sectors.
4.2. Correlation Analysis
In this correlation analysis, two types of statistical analysis are employed, Pearson (for qualitative data e.g. ordinal) and Kendall's (for quantitative data e.g. nominal). The significance level is decided at the 0.5, which confirmation at 0.5 or above there is a strong correlation between the competitive factor and the performance indicator and if it is less than 0.5 than the competitive factor does not affect free zones performance. It can be summarized that some of the competitive factors are not significant because there are more factors that are not observable in this research.
It can be seen that the total area is significant competitive for all performance indicators, which means that the larger the area, the more possibility to gain more growth in free zone performances. In addition, the physical condition (island) is not preferred (negative sign), since it may limit the free zone's development. However, this factor (0.40) and the distance to economic centre (0.23) are not significant to affect the free zone performance. Human capital factor are also considered important as a competitive factor. Except the relation with culture and total population, all other competitive factor remains less significant. The only performance that is significantly affected is the employment rate. The more population available and working force, the higher the employment rate. Next analysis is the local policy. Although not significant, the index for resident regulation is higher than investment procedure.
In the infrastructure factors, almost all factors are significant to the free zones performances. With a good and accessible infrastructure, it is expected that firms will be attracted and economic activities can perform in the free zone. Not only the provided infrastructures, the price competitive factor also has a positive significant correlation with the level of economic performances. Lower price will benefit firms so it can cut cost production and increase productivity. While in the national policy, regulation and the formation of the authority are not significant to affect the performances. But minimum wage salary is significantly important for the free zones. This competitive factor has a correlation index more than 0.6 for each economic performance. Other competitive factor is international cooperation conducted by the host country. Although not significant, this factor remains important since it opens market access of free zones firms. For example, firms in Batam are entitled to export their products to ASEAN countries with a low tariff since the region has implemented AFTA.
A fundamental important finding from the comparison is that more infrastructure and result oriented policies attracts more investment. Also to mention that first nature of geography (natural physical of the zone) plays an important role in infrastructure, which will affect the performances. With results from the comparisons and additional statistical methods (location quotient and correlation statistics analysis), the finding concludes that in order to attain benefits from the Free Trade Zone, there should pool market for firms and labours, both agglomeration of industry and skilled workers. Attached with special privileges (tax holiday, special policy regime, etc), free zone offers a lower cost of production, which means competitive product price. Second, with the intermediate and final producer already located in the Free Trade Zone, more related industries
will take place in the zone (self sustain). Finally, by operating free trade zone, there would be knowledge and skill transfer from the foreign company expertise to local workers. Overall, the zone will bring increasing return with more investment to the country and economic activity.
5. Conclusion
From the study, several findings can be concluded several findings that will be valuable for future development. First, based on its natural characteristic (first nature), Free Trade Zone should be located at a strategic location such as at International trade route or near an economic centre activity. This is important since free trade zone has to attract firms and firms required a location, which will guarantee that their allocation to the zone will benefit them. For example, Batam and Shenzhen were established to gain multiplier effect from economic centres near them, i.e. Singapore and Shenzhen, respectively. In addition, Subic is located at a strategic sea trade route that connects south East Asia and East Asia, which will be a good hub for international firms to operate within the areas. Second, unlike common cities, Governments have to establish infrastructure as a basic requirement for the free zone. Government has to invest in infrastructure to run and support firm's economic activity within the zone. Such basic infrastructures are transportation (airport, port, highways) and utilities (phone line, electricity, water). Third, government is required to provide constant and reliable policies for the zone. Both high and low level policies have to be unambiguous through time to ensure reliable investment climate. This research has proven that policies are crucial factor for the free zone development. Forth, national cooperation will affect the free zone performances. Both multilateral and bilateral
cooperation by a country in which a zone is located will determine a zone's development. For example, free trade agreement (FTA) between USA – China and USA-Philippines means more products from both countries could enter USA, including products from its free zone. The consideration of Indonesia currently for FTA with USA and trade agreement with other countries will be important for Batam Free zone future growth.
However, there are several arguments that challenge the SEZ. First, SEZ firms are mainly loose companies that simply relocate to SEZ to gain tax privilege and the nature of SEZ that focus on exports. This will cause a significant revenue loss to the government. Furthermore, SEZ is argued to exacerbate the income and wealth inequalities. Moreover, since the public does not have access to the proceeding of SEZ's, it will be difficult to ensure if the remaining 65% area is being used for productive purposes. In addition, following the cumulative caution theory, the SEZ will exacerbate disparities and wealth inequalities as countries experiences established SEZ in areas where there is strong tradition of manufacturing and exports. Further research recommendation is to conduct a research on comparison study between free trade zone and cluster industries. Both concepts are spatial concentration development but with different approach. While free trade zone relies on reducing tariff and applying tax privileges, a cluster industry considers intense networks between firms.
Acknowledgment
This article is a follow up of previous thesis. Author wishes to acknowledge the help of people that has realized the thesis, including the research supervisor, statistics assistants, and staffs at Batam Statistics Bureau.