
Introduction
The debate on the merits and costs of decentralization policy has turned the attention of many scholars and experts to the subject of politics, governance, economics and administration. Referring to the concept of multi-level governance in comparative politics and governance as presented by Hague and Harrop (2010), it is stated that in decentralization policy, most power and authority will be devolved to the lowest tiers of government (local governments), who will enjoy a certain degree of autonomy to optimally utilize their financial and economic resources in achieving their goals. As a consequence, it seems reasonable to assume that decentralization
1 International Development Department, the University of Birmingham, The United Kingdom. Email:
mxr338@student.bham.ac.uk. 2 Comparative Public Policy, Osaka School of International Public Policy (OSIPP), Osaka University, Japan.
policy tends to create polarization, i.e. an increasing inequality between districts/cities or local governments due to their different capacities and choices of suitable strategies.
In terms of public services provision, it is argued that districts that are prosperous and rich in natural resources have better opportunities to provide good quality services compared to economically and financially poor districts/cities. As a result, the gap in the quality of public services among local governments will increase over time, which is called polarization.
The setting of Minimum Service Standards (MSS), introduced in 2005, as a key focus of the implementation of decentralization policy in Indonesia is a strategy that seeks to deal with this problem. Since MSS sets the same output and time targets for a minimum quality of basic public services that should be fulfilled by districts across regions, it seems reasonable to expect that depolarization in the delivery of public services will occur as a result of MSS implementation.
This study examined the impact of MSS on depolarization among districts in Indonesia, focusing on the quality of health services. Two research questions are addressed in this paper:
- 1. Does decentralization policy in Indonesia cause polarization in the quality of basic public services among districts? If so, what are the rationale and empirical evidence? If not, what does the empirical evidence show and why?
- 2. Is the introduction of MSS able to accomplish depolarization in the delivery of health services across regions? What is the explanation and empirical evidence?
The methodology used in this study was to make a comparison between achievements of local governments to reach the set targets for the delivery of public services. The achievements were measured by taking the average achievement of local governments in delivering public services, specifically in the health sector, and compare the results with the targets. A sample of regions was selected by cluster sampling to capture a representation of the population, although we acknowledge that the problem of the sample being somehow biased can not be avoided.
Moreover, we examined the relationship between decentralization policy and quality of public services. The fiscal capacity of local governments was treated as an independent variable to capture the phenomenon of decentralization and the achievement of local government in delivering a particular quality of service was treated as a dependent variable. We deployed time series linear regression with fixed effect estimation, as we were only interested in the effect of decentralization policy that is assumed to change over time. If this assumption is held, we expect a robust finding on the impact of decentralization policy on the quality of public services.
This paper will begin with discussing the concept and rationale of Indonesia's decentralization policy regarding public services. It then continues with the reason why decentralization can lead to inequality traps concerning resources and public services as well as a discussion of the current condition of Indonesia's public services. Subsequently the concepts, design and institutional arrangement of MSS will be discussed and its potential to cause depolarization of public services in Indonesia. Finally, the results of an empirical investigation of the effects of MSS on polarization or depolarization in the delivery of public services, especially in the health sector, will be revealed. This section includes the limitations of the methodologies and data set used, as well as potential research in the future.
Concept and rationale of decentralization in Indonesia with respect to public services
Indonesia, as the one of the most diverse countries in the world in terms of ethnicities, cultures and languages, seems to be executing the concept of decentralization as suggested by Smith (1985), who emphasized two main components of decentralization. Firstly, the delimitation of territory, which is realized through the creation of local governments. Local governments were split into a greater number after the implementation of decentralization, from 27 provinces and 314 districts in 1998 to 34 provinces and 503 districts in 2014. Secondly, the transfer of power. Most of the power, authority and functions of central government have been transferred to both the first (provincial) or the second tier (districts/cities) of government, except the 6 (six) main authorities (i.e. defence, security, taxes) that belong to the central government on account of their national and international implications. Most international experts and scholars, such as Aspinall and Feally (2003), Alm et al. (2004), Hofman and Kaiser (2006), call this 'big bang' policy and characterize Indonesia as one of the most decentralized countries in the world since all government's powers and authorities have been radically, rapidly and significantly devolved to local governments as autonomic entities.
Indonesia's decentralization policy was introduced in 1999. Implementation was started by the stipulation of Law 22/1999 on Local Governance, later revised as Law 32/2004 and Law 23/2014, being the basis and grand design of decentralization policy implementation in Indonesia. Two rationales can be identified in Indonesia's decentralization implementation: fair allocation of resources and enhancement of the quality of public services.
Fair allocation of financial resources between the central government and local governments and among local governments is one rationale in Indonesia's decentralization implementation. This rationale is underpinned by the dissatisfaction of local governments with the central government because most of their valuable non-renewable resources such as oil, gas and mining were taken without fair mutual benefits or feedback to the regions, especially the regions that were rich in resources. Another rationale is enhancing the quality of public services. It is believed that decentralization policy will improve the efficiency of public services by increasing intergovernmental competition, bringing government closer to the people, and improving the accountability of local governments.
Moreover, local government, as the lowest level of government, is better able to capture the interests and needs of local people compared to central government, as elaborated by Oates (1972) and Seabright (1996). Local governments are more reactive, sensitive and responsive to local needs and interests. Bardhan and Mookherjee (2006) argue that local government is the most efficient way to deliver public services since it can best match local preferences and supply services as well as gain real and accurate information from local people in a short time.
Decentralization policy is also expected to improve the accountability of local government and shorten the long accountability route in the provision of public services. According to this rationale, decentralization policy commonly works by the practice of local democratization. This means that decentralization policy requires local leaders to be more accountable to local parliament and local people than the central government. Local leaders will continually improve their performance, see the performance of bureaucracy as a main concern, increase his/her transparency and accountability to local parliament and the people, and increase the satisfaction of the people with the public services that are delivered. Because of the tight competition for election, there are big incentives for local leaders to deliver less wasteful products and services as well as influence the bureaucratic system to be more transparent and accountable to them and the local people (Schulze and Sjahrir 2014; Faguet 2011). As a consequence, the performance and accountability of local leaders as well as overall local governments could improve, which is likely to lead to more effective and efficient public services delivery.
Decentralization policy also improves the accountability of local government by shortening the long route of accountability as presented by the World Bank (2003) and Ahmad et al. (2006) in Figures 1 and 2 below. Instead of taking a long route of accountability, while providers to the poor are held accountable only by national policy makers, a short route of accountability is made via local policy makers.
Figure 1. Accountability Under Centralized System
Source: Adapted and modified from World Bank (2003, p. 6-10) and Ahmad (et al. 2006, p. 243-259)
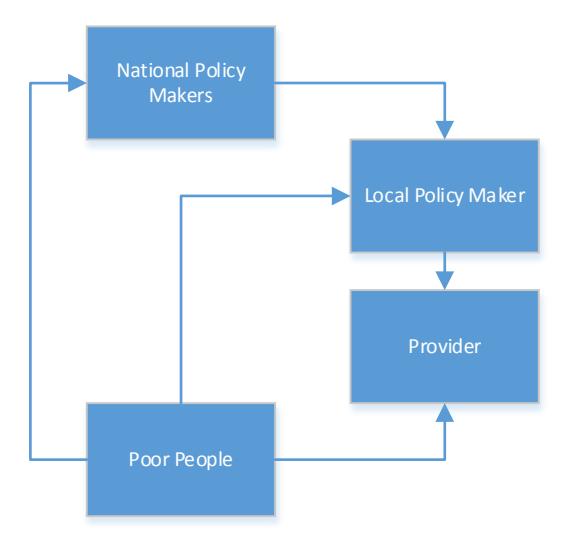
Figure 2. Accountability Under Decentralisatized System
Source: Adapted and Modified from World Bank (2003, p. 6-10) and Ahmad (et al. 2006, p. 243-259)
Decentralization and inequality traps concerning resources and public services
From the discussion above, by introducing decentralization policy it seems reasonable to expect that services are quicker to deliver, a government that is more responsive and reactive to local issues and problems as well as better performance of government in delivering services in terms of capturing local interests. All these rationales seem to be leading to the improvement of the quality of public services and depolarization in the delivery of services among regions. However, in practice the relationship between decentralization policy and public service improvement is not always robust and does not always show a positive correlation, as shown by Ahmad and Brosio (2009), who looked into some cases in developing countries such as in Ethiopia and Pakistan in the education, health and infrastructure sectors.
In Indonesia, the quality and efficiency of public services vary. Good quality and efficient public services can be seen in some sectors and regions. Bahl (2009) has shown that more than 70 percent of households in a number of regions in Indonesia agree that services in health, education, administrative and police services have been improved since the introduction of decentralization policy in 1999. Using regression techniques to analyse a number of variables that represent the quality of services in health, education and infrastructure, decentralization policy seems to have increased the quality of services in a number of regions, especially those that had low quality of services previously (Schulze and Sjahrir 2014). This improvement seems to lead to a convergence in the quality of education and infrastructure among regions.
However, in other cases, the basic public services did not significantly improve nor did they positively affect low income people. Figure 3 shows the relationship between life expectancy rate and per capita expenditure in Indonesia, using data from the year 2013. Here, a higher life expectancy implies a better quality of health services. From the relationship, low income regions have a low life expectancy rate. This implies that local governments with low capacity deliver low quality health services. Similarly, Kristiansen and Pratikno (2006) found that decentralization policy in the education sector in Indonesia neither improved transparency, accountability or financial allocation to primary and secondary education, nor the inequality of these services across regions.
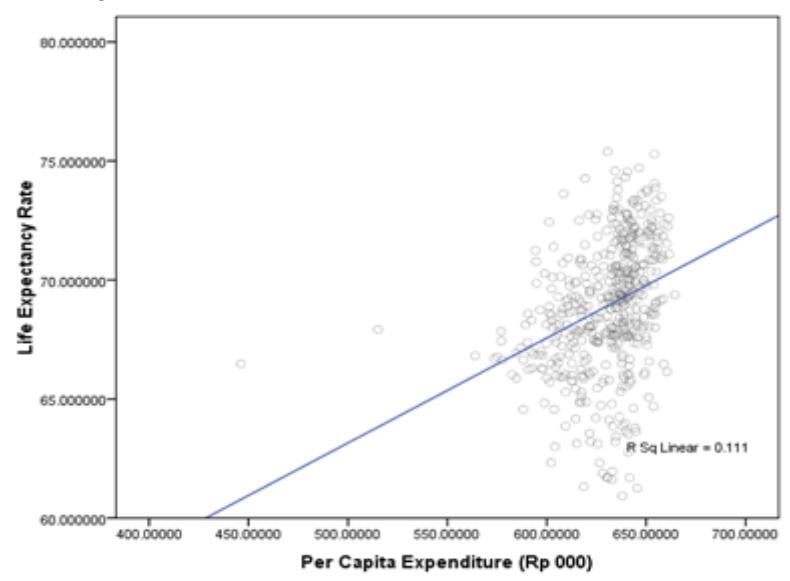
Figure 3. Life Expectancy Rate and Per Capita Expenditure in Indonesia, 2013 Source: Data analysis, 2015
Empirical evidence has also shown polarization in the quality of public services as a consequence of the inequality of the economic and social level among regions after the implementation of decentralization policy in Indonesia. Aritenang (2008, 2009), utilizing the Gini and Williamson Index, has studied the phenomenon of disparity among regions because of the difference in financial capacity and impacts of central government transfer. Aritenang (2015) argues that fiscal decentralization has allowed local governments to impose taxes and levies on economic activities, which led to significant local revenue disparities. Utilising the Gini Coefficient of each province in Indonesia over the year 2012 to measure inequality and fiscal expenditure as an indicator of fiscal decentralization, the relationship between inequality and fiscal decentralization shows a positive correlation. This implies that high fiscal expenditure of local governments tends to cause high inequality of income.
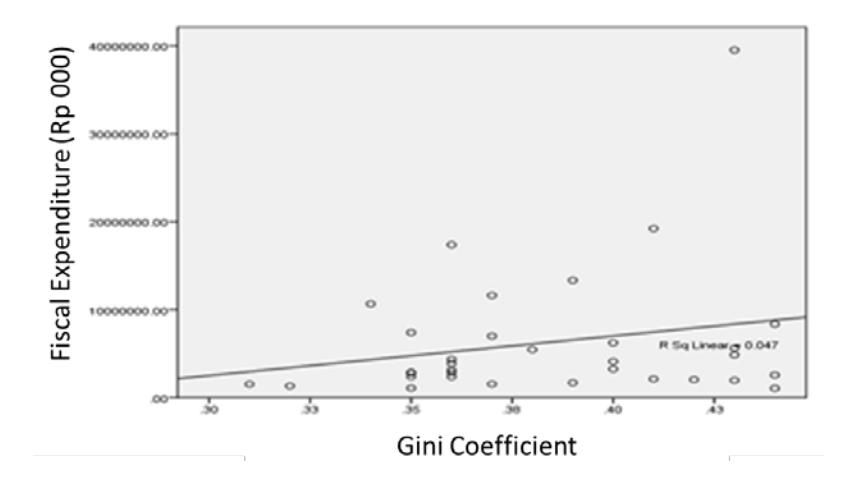
Figure 4. Relationship between Inequality and Fiscal Expenditure Source: Data analysis, 2015
It can be also considered that the reduction of dissatisfaction of local governments with the central government because of unfair revenue sharing, as one of the rationales of Indonesia's decentralization policy, has shown relatively satisfactory results. The enhancement of the quality of public services and the reduction of inequality in public services across regions have remained the main challenges for the implementation of Indonesia's decentralization policy. This is why the problem of low quality of public services and inequality in public services across regions are seen as an 'unfinished agenda' after a decade on decentralization implementation in Indonesia by Strategic Asia (2013).
Minimum service standards and its potential to reduce inequality in public services
In response to the unsatisfactory condition of public services in Indonesia in 2005, the central government introduced Minimum Service Standards (MSS). This strategy was a way to improve the performance and accountability of local governments to provide basic public services at a minimum required quality level. It was expected that MSS could provide an effective breakthrough and key focus in decentralization implementation, aimed at enhancing the quality and efficiency of basic public services as well as reducing inequality in services across regions.
MSS is actually a particular regime of performance measurement of local governments in Indonesia's decentralized system. MSS has been applied by stipulation of Law 32/2004, which was later regulated in detail in Government Regulation (GR) 65/2005 as a guideline for the sector ministries to set indicators and targets for MSS and mechanisms for local governments to implement MSS at a local level within their sectors. In GR 65/2005, MSS is defined as the types and quality of basic public services that should be received by each citizen at a minimum level.3
Some scholars have different interpretations of the definition of MSS. Ferrazzi (2005) defines MSS as a tool to influence and control local governments in fulfilling their 'obligatory functions' in delivering basic services according to required quality standards set by the central government. Roudo (2014) argues that MSS is not only a key strategy in decentralization policy in view of accelerating the improvement of the quality of public services, but also an effort to reduce regional disparity in the provision of basic public services that may lead to a particular convergence.
From its definition, we can assume that MSS has the potential to significantly reduce inequality in the quality of public services across regions, which leads to depolarization in the delivery of public services by setting the same standards everywhere and ensuring that each local government fulfils the agreed indicators and targets. To ensure its potential for creating depolarization, we will take a brief look at the policy design and institutional arrangement of MSS.
According to its design, MSS is embedded in local obligatory functions that are strongly related to the provision of public services. 'Obligatory function' refers to all 'concurent' functions' or 'shared competences' that are compulsorily implemented by each local government, regardless of its capacity. There are 26 obligatory functions stated in Government Regulation (GR) 38/2007 but only few of them are classified as basic public services that reflect the minimum citizen's socio-economic needs and rights that should be fulfilled by the government and are guaranteed by the constitution, such as education, health, and infrastructure.
Mohamad (2007) and Haryanto (2010) note these basic services that are protected by the constitution and are related to the fulfilment of basic welfare, public order, national unity, and commitments to national and international conventions. Based on these criteria, in 2012, 15 MSS have been set and applied at the district level and 9 at the provincial level, consisting of 65 services and 174 indicators and targets. This was simplified into 6 MSS in the new Law 23/2014, which shows the seriousness of the central government to improve MSS practice in Indonesia.
In terms of institutional arrangement, the relationship between actors in MSS implementation can be seen in Figure 5 below.
3 There is no significant change in terms of meaning and definition between what is defined in GR 65/2005 and what is stated in the new Law 23/2014. MSS is still defined as the types and minimum quality of services that should be provided by the government to the people.
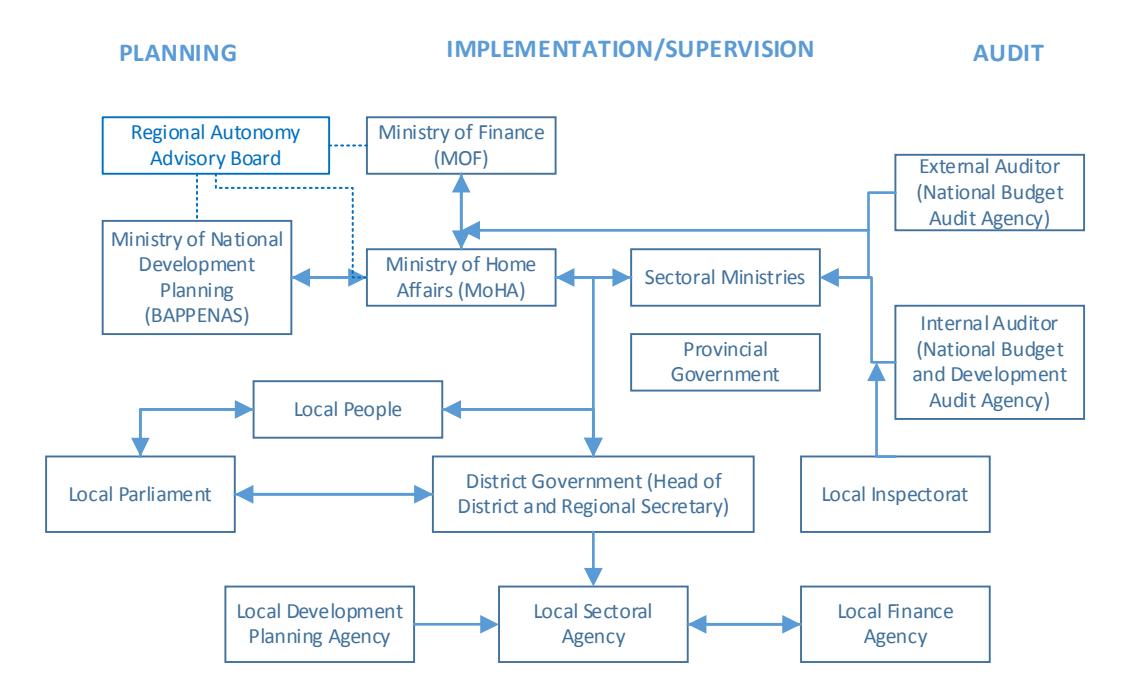
Figure 5. Relationships Between Actors in the Design of Policy and Implementation of MSS Source: Analysis
From Figure 5, it can also be seen that MSS achievement by each local government will be simultaneously assessed by the central government, local parliament and local people. At the central level, at least 3 (three) main actors/stakeholders have roles in the assessment and evaluation of MSS achievement: MoHA, sectoral ministries, and both internal and external auditors. The assessment process is started by self-assessment or self-evaluation by local governments of their achievement before it is checked and validated by the sectoral ministries. The governor, as an extension of the central government, helps the sectoral ministries in compiling data about the achievement of the MSS targets from the districts/cities in their regions besides the achievement of targets at the provincial level. Here, the roles of external and internal auditors are considered not too significant.
Moreover, the accountability mechanism that is part of MSS, will put pressure on each local government to achieve MSS targets and to continually improve their performance in delivering services. Local leaders will continually improve their performance and accountability in delivering services to the local parliament and the local people in an effort to show their political accountability and gain popularity for the next election. Public managers and bureaucrats are also more responsive in increasing the satisfaction of local leaders as a form of their accountability. Since a high level of pressure emerges from the institutional arrangement of MSS, improvement in the quality of public services by each local government as well as depolarization in the delivery of public services can be achieved.
Empirical results from local government self-assessment
Among many MSS sectors, two main sectors, education and health, are at the heart of MSS implementation and are deemed the most required for all aspects of people's life, without any
intention to deny the importance of the other sectors. Besides that, both these two sectors, especially the health sector, are the most prepared MSS sectors in terms of supported regulations as well as monitoring systems for the provision of data on the achievement of MSS targets. Therefore, in seeking empirical evidence whether the introduction of MSS causes depolarization in the delivery of public services, we will focus on the health sector.
The Minimum Standard of Services for health were designed by the Health Ministry as mandated in Law No. 32 2004 and Government Regulation (GR) No. 65 2005. Moreover, the Minimum Services Standards on Health Services is regulated in detail by the Health Minister's Act No. 741/MENKES/PER/VII/2008 on Minimum Standard of Services for Health Services at Municipal and City Level. The MSS consists of 4 types of services and 18 target indicators. Details of the health MSS and its indicators are shown in Table 2<sup>4</sup>.
Table 2. Minimum Standard of Services for Health Targets and Indicators
| No | Types of Services | Indicators | Targets | Targeted Year |
|---|---|---|---|---|
| 1 | Basic services | Scope of daily visits to pregnant mothers (K4 criteria) | 95% | 2015 |
| Scope of visits to pregnant mothers with complicated problems | 80% | 2015 | ||
| Scope of aid from health workers or nurses | 90% | 2015 | ||
| Scope of service to mothers after giving birth (childbed) | 90 % | 2015 | ||
| Scope of treatment of newborns with complicated problems | 80% | 2010 | ||
| Scope of baby visits | 90% | 2010 | ||
| Scope of universal child imunization in subbistricts | 100 % | 2010 | ||
| Scope of services to under 5-year old children | 90 % | 2010 | ||
| Scope of provision of additional food to breastmilk to children from poor families from 6 months to 2 years | 100% | 2010 | ||
| Scope of services to under 5-year old children who are malnutritioned and get special treatment | 100% | 2010 | ||
| Scope of quality of health of students in primary schools | 100% | 2010 | ||
| Scope of members of active family planning | 70% | 2010 | ||
| Scope of observation and treatment of people with illness | 100% | 2010 | ||
| Scope of basic health services to poor families | 100% | 2015 | ||
| 2 | Recommended services | Scope of recommended services to poor families | 100% | 2015 |
| Scope of first-level emergency service that should be supported by health infrastucture |
<sup>4</sup> Currently, GR 65 2005 as well as Health Minister's Act No. 741/MENKES/PER/VII/2008 are under revision due to the stipulation of Law 23/2014 as a revision of Law 32/2004 on Local Governance, as the stepping point of those two regulations.
| No | Types of Services | Indicators | Targets | Targeted Year |
|---|---|---|---|---|
| in districts | ||||
| 3 | Epidemic investigations and cures in special circumstances | Scope of village or subdistricts with less than 24-hour epidemic investigations in special circumstances | 100% | 2015 |
| 4 | Health promotion and people empowerment | Scope of active alertness of villages | 80% | 2015 |
Source: Adapted and Modified from Healh Minister Decree No. 317/MENKES/SK/V/2009
The local governments have been asked to fulfill the targets of health services delivery using their own budget. The implementation mechanism of the health MSS is stated in Health Minister Decree No. 317/MENKES/SK/V/2009 on Technical Guidelines for Health MSS Planning and Budgeting at Municipal and City Level. Basically, the mechanism consists of socialization, building baseline data, setting annual targets, costing, and integration of MSS information into planning and budgeting, and reporting.
In our analysis, we utilized data compiled by the Ministry of Home Affairs (MoHA) and the Ministry of Health on the achievements of each district with respect to targets set in MSS. These data are based on each district's self-assessment. This means that each local government or unit that is responsible for implementing MSS within its sector measures its own achievement based on guidelines provided by the central government.
In the data compiled by MoHA, we found that not every local government reported its MSS achievement. There were difficulties related to incomplete annual reporting, variability of target measurement, and the different formats of the reports that should be submitted by the local governments, which have led to unecessary information being included in the report.
To investigate the polarization of the quality of basic public service among districts, time-series data are necessary. Complete time-series data of health services will reveal any particular trend in the quality of health services year by year. From the data compiled by MoHA, we selected 54 local governments from 534 local governments in total, considering regional representation and data completeness. The selected sample is shown in figure 6.
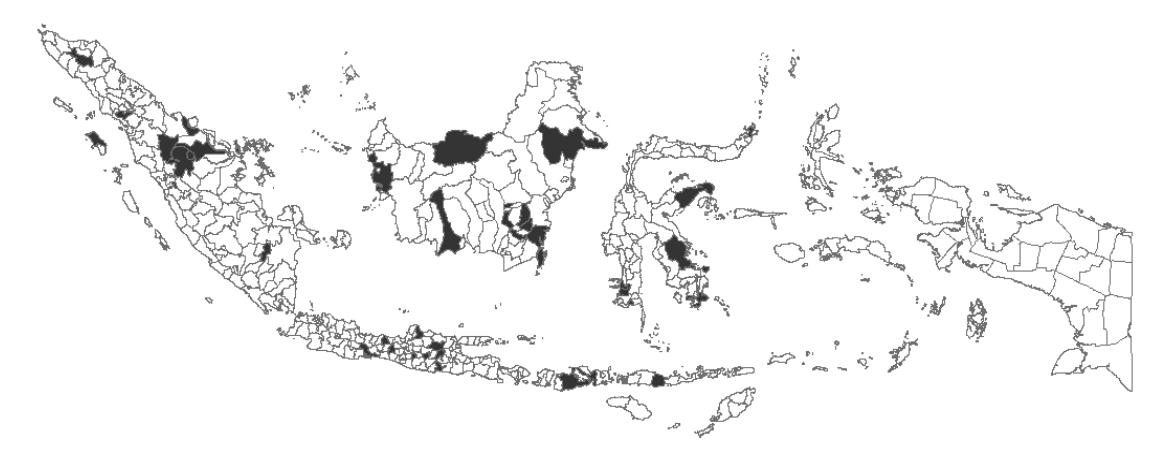
Figure 6. Distribution of Municipals and Cities Selected Sample Source : Analysis
The time period covered is 4 years, from 2010 to 2013. We consider 2010 as the effective start year of MSS implementation. The technical guidelines for health MSS were published in 2009 and the local governments started implementation in 2010. The data about the achievement of MSS targets of each local government have been updated until 2014. However, only a small sample of local governments has data on 2014. Therefore, we decided to use 2013 as the end limit of the time periods.
In order to make generalizations about the quality of health services, we took the average of the health performance indicators, which was calculated by essentially taking the averages of 14 standardized core indicators of the quality of health services, as shown in Table 2.
Overall, the quality of health services increased from 2010 to 2013. By setting the average value of the health MSS targets to 91,25%, the average achievement of the sample of local governments was 74,58% at 2010. The quality of health services steadily grew to 76,79% in 2011, 77,46% in 2012, and 76,01% in 2013. Nevertheless, it can be seen that the quality of health services still remained far from the minimum target set in MSS. By observing the data, however, it can also be understood that depolarization in the delivery of services could potentially occur among regions. It can occur in the future, considering the trend in the reduction of the gaps between performance and targets of districts that are currently not able to reach their targets, while the performance of some districts that have achieved outputs that exceed their targets is maintained.
In addition, a scatter plot shows the districts that are trending to reach the minimum level of the targets, as can be seen in Figure 7. This trend implies that some local governments have succesfully reduced the gap between their performance and the targets. We calculated that 39 local governments (72%) reported an improvement in the quality of health services. On the other hand, 16 local governments (28%) from the sample in this research are less likely to improve the quality of health services, whether they have a fluctuating performance or are consistently worse off.
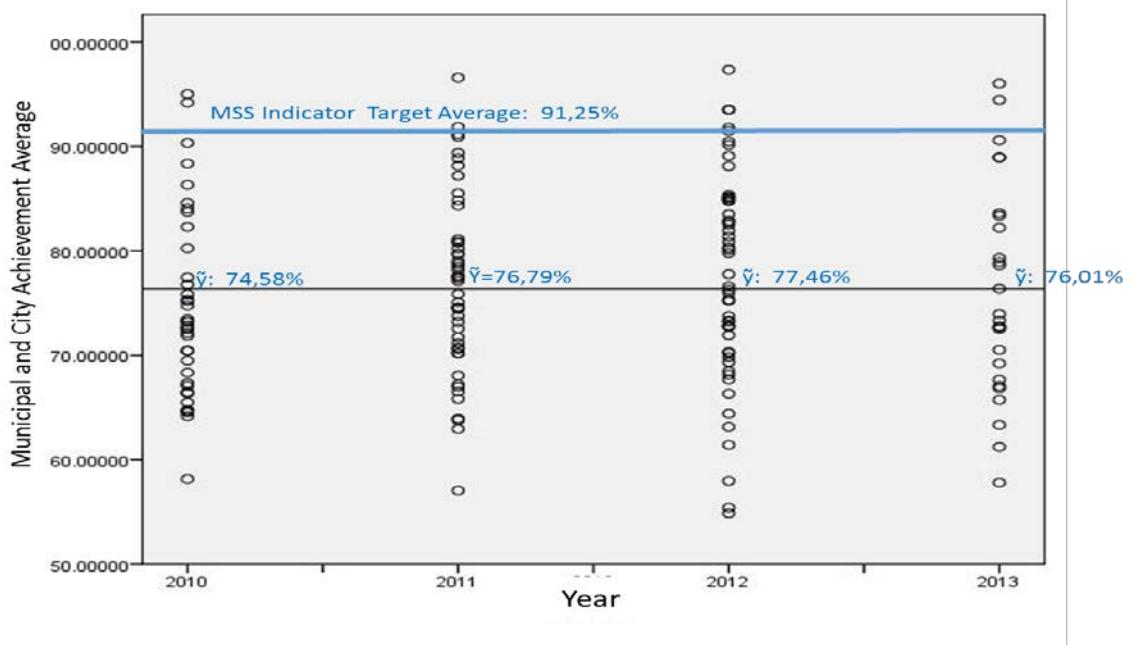
Figure 7. Depolarization of Health Service Quality on Local Government Source: Analysis
However, we acknowledge the weaknesses in the validity of self-assessment data. In the first place, these can be caused by a lack of knowledge and skills to execute the self-assessment according to the official guidelines. They can also be caused by the overrating of target achievements, as well as a lack of data from independent sources to confirm the self-assessment outcomes. The World Bank (2011) argues that constructing and re-confirming data is a main challenge of local governments in assessing MSS implementation so that they are sometimes uncertain whether they have already achieved a target indicator or not since MSS was introduced in 2005.
In the data from some of the local governments that we utilized, we made a correction when the achievement of the target exceeded the maximal indicator value. For instance, the report from the district of Pringsewu shows an achievement of 130,5% coverage of baby care visits in hospital in 2010. From our point of view this seems unreasonable because the maximum coverage is 100%. World Bank (2011) acknowledges this problem as a lack of understanding of the technical guidelines from the Ministry of Health, especially the numerators and denominators that are used to translate the data collected in the field into MSS indicators.
In the second place, neither the local governments nor the central government are ready to effectively implement MSS. The reports that were submitted to MoHA have not been re-assesed by the responsible and authorized sector ministry. Although the technical ways are dealing with sector ministries, MSS achievement is actually a performance indicator of MoHA. If MSS is not successfully achieved, then MoHA is likely get blamed. Therefore, MSS monitoring and evaluation at the national level is placed under MoHA coordination. However, local governments are often confused whether they have to report their MSS achievement to the sector ministry or to MoHA.
Moreover, we propose to re-check and re-asses the utilization of the achievement of MSS indicators that was reported by local governments as an indicator to measure the quality of health services in Indonesia. The World Bank (2011) has analysed each MSS indicator in the health sector and found that some were similar to Millennium Development Goals (MDG) indicators. For instance, MDG Goal 6, especially the improvement of maternal health as Target 5A (proportion of births attended by skilled health personnel, reduced by three-quarters between 1990 and 2015) is similar to MSS health indicator 1.3, i.e. the scope of aid from health workers or nurses. We argue that the MDG data are more reliable because they were gathered and have been continually rechecked by MDG's joint secretariat, the Ministry of National Development Planning (BAPPENAS), the Ministry of Health, and the National Statistical Agency. The data include all municipalities and cities over the year 2013.
Apart from the weaknesses in the validity of the self-assessment data, we also acknowledge that differences in financial, economic and natural resources are the main determinants why one district is more successful in achieving the MSS targets than another district. We did a regression analysis to check any correlations between differences in income and achievement of local governments to improve their quality of health services. In this analysis, we used cross tabulation data analysis to seek empirical evidence of a correlation between financial resources and the quality of health services.
The variable of local government income was divided into 2 categories: (1) original regional revenue, i.e. local government income generated from taxes and levies in their own region; and (2) fiscal transfer, which is divided into three common types of fiscal transfer that are adopted by the Indonesian central government: general allocation funds, revenue sharing, and specific
allocation funds. The data of income of municipalities and cities were compiled by the Ministry of Finance and were published in the year 2013.
The indicators that we utilized to see the correlation between the quality of health services and local government income were: (1) Percentage of infants who got breastfeeding; (2) Percentage of infants who got immunization; (3) Percentage of pregnant mothers who got childbed treatment; (4) Percentage of women who participated in family planning; (5) Infant death rate; and (6) Percentage of infants who were exclusively given breastfeeding. From Table 3 it can be seen that the relationship between the quality of health services and local government revenue variable. However, some coefficients have a significant correlation with local government revenue. The original regional revenue and revenue sharing have a significant positive relationship with the percentage of infants who got immunization. This implies that municipal or city government with high original regional income and revenue sharing have a high percentage of child immunization services delivery. The other variables that showed a significant correlation were specific allocation funds with the percentage of pregnant women who got childbed treatment. The coefficient also shows a significant positive correlation between high allocation of specific allocation funds and services to mothers after giving birth.
Table 3. Relation between MSS and Local Government Income
| Standardized Coefficient (t-value) | Origin Regional Income | General Allocation Funds | Specific Allocation Funds | Revenue Sharing |
|---|---|---|---|---|
| Percentage of infant who got | 0.391 | -0.344 | 0.945 | -0.107 |
| breastfeeding | (0.699) | (0.733) | (0.353) | (0.837) |
| Percentage of infant who got | 0.933** | -0.244 | -0.323 | 0.835** |
| immunization | (2.089) | (-0.686) | (-0.94) | (1.978) |
| Percentage of pregnant mothers who got | 0.345 | 0.414 | 0.805** | -0.248 |
| childbed treatment | (0.762) | (1.144) | (2.306) | (-0.578) |
| Percentage of women who participated in | 0.729 | 0.004 | -0.548 | -0.877** |
| family planning | (1.582) | (0.012) | (-1.546) | (-2.014) |
| Infant death rate | -0.6 | -0.274 | 0.589* | 0.425 |
| (-1.284) | (-0.735) | (1.638) | (0.962) | |
| Percentage of infants who were given | -0.252 | -0.004 | -0.158 | 0.229 |
| breastfeeding exclusively | (0) | (-0.01) | (-0.373) | (0.439) |
Figures in parentheses (**) and (*) denote a significance level of 5% and 10% respectively. For two-way error components, the quantities in (.) are t-values.
Conclusion
Focusing on the quality of health services, this paper suggests a potential impact of MSS on depolarization among districts in Indonesia. We investigated the impact of MSS on the improvement of the quality of public services on the basis of accountability mechanisms. The motivation of local leaders to improve MSS performance in order to gain a positive evaluation from the central government and local parliament as well as to gain popularity with the people to win elections, can be considered as incentives to implement MSS well. Local governments put efforts into pushing the quality of public services to the minimum level that is required by MSS. As pressure emerges from the policy design and institutional arrangement of MSS, improvements in the quality of public services by each local government as well as depolarization in the delivery of public services among regions can be achieved.
Based on the data on MSS achievement compiled from self-assessment reports by local governments, it is considered that MSS can potentially improve health services in municipalities and cities in Indonesia, since we did find improvement in the quality of health services. Focusing on the health sector, our findings suggest that the phenomenon of depolarization in the delivery of public services exists. The majority of local governments comprising the sample in this study did better in improving the quality of health services by seeking to reduce the gap between their current services and the MSS targets. The high concentration in the scatter plot shows that the quality of health services in the sample areas steadily increases toward the minimum level of service quality required by MSS. In other words, MSS as an effort to minimize disparities/inequality traps as unintended consequences of decentralization potentially creates depolarization in the delivery of public services. In addition, differences in fiscal capacity among local governments are associated with levels of achievement of MSS targets. Local governments with high financial capacity are more likely to achieve MSS targets easily, and vice versa.
Finally, in order to reduce inequality of public services, we suggest that MSS is important as a checkpoint for local governments in delivering public services. However, due the differences in resources, proper fiscal transfer needs to be designed aiming to create depolarization in the delivery of public services, at least to a minimum degree. This will be a good starting point for achieving equality among regions.