
Introduction
Background
A region always grows and develops in line with its development activities. Development is needed to stimulate the region in terms of its infrastructure, social aspects and economy in order to achieve welfare for the society.
Rustiadi, et al. (2011) define development as an activity carried out in a region to improve the quality of life in society. Regional development can be defined as a series of efforts and measures taken to utilize the regional potential, connect and balance national development, increase inter-regional harmony, and integrate development sectors in order to achieve a better system of life (Hariyanto and Tukidi, 2007; Mulyanto, 2008).
Djakapermana (2009) stated that in the process of regional development, the characteristics of the region must first be understood. A region is a geographically bounded (by geographical coordinates) and has a specific meaning or is in line with certain observed functions. Isard (1975) considered a region not merely an area with certain boundaries, but as a meaningful area because it has problems that are interesting for regional experts to address, especially because they involve socio-economic issues.
The concept of the region, especially concerning its typology was developed by Richardson (1969), Johnston (1976), Hagget, Cliff and Frey (1977), and Blair (1991). Each expert has varying definitions and classifications based on the problems and regional development objectives. However, according to Rustiadi, et al. (2011), a framework for classifying the concept of the region that is able to accommodate various concepts includes (1) a uniform region, (2) a system/functional region, and (3) a planning or programming region. From another point of view, the development of the concept of the region and its real-world application will result in territorialization.
Territorialization is the division of a larger region into contiguous regions while optimizing the objective function, which is usually measured by the homogeneity (or heterogeneity) of each region (Guo, 2008). According to Tarigan (2005), territorialization encompasses the dividing of a large area into a unity of several smaller areas.
The development system in Indonesia based on a regional approach is implemented through a system of regionalization or territorialization that divides regions into development regions (DR). The purpose of this is to ensure harmonious and balanced development, both between sectors within regions and between regions, as well as to direct the development of regions in accordance with local potential and capacities (Nurhadi, 2012; Utoyo, 2009).
The economic growth of a region is one of the indicators of regional progress. The higher the economic growth in a region, the more advanced the region should be. A national development approach that greatly emphasizes macroeconomic growth tends to ignore the great inter-regional development inequality that exists. Investment and resources are absorbed and concentrated in urban areas and growth centers, while the hinterlands experience excessive resource depletion (Baransano et al., 2016; Sukma, 2015).
Development regions can be linked to the development of regional-scale clusters. Vukovic and Wei (2010) suggested that an important component of regional competitiveness is the development of clusters. Regions that develop clusters are almost always more competitive than other regions because clusters are characterized by greater specialization, better information capacity, better business organization, and experience the positive effects of a network of entrepreneurship.
The Malang Regency government has divided its territory into six development regions (DR) as stipulated in Regional Regulation No. 3/2010 on Malang Regency Regional Spatial Plan. A development region is an area consisting of one or several sub-districts that form a unity of social service, economy, and community systems. Each development region functions in line with its potential and based on directives on its main activities based on the dominant activity in each development region.
Development regions are areas that are prioritized to be developed based on their characteristics and potential. Thus, this policy is expected to create growth centers able to stimulate and incite growth in the region itself and in its hinterland (Hariyanto, 2006). The foundation for this is the growth center theory developed by Christaller (1933), Perroux (1955), and Myrdal (1957). According to Marsudi Djojodipuro (1992) in Nurhadi (2012), the essence of the ideas of growth poles and growth centers is based on:
- 1. The concept of "leading industries"; that there are large companies that dominate other economic activities at the center of the growth pole. Such industrial location is influenced by several factors such as the location of resources, good infrastructure, and a sufficient labor force.
- 2. The concept of polarization; that the rapid growth of leading industries can push the polarization of other economic activities into the growth pole. The direct effects of this are economies of agglomeration.
- 3. The concept of spread effect (value added); growth poles will increase the benefits in their surroundings, i.e., benefits gained in the surrounding environment.
The acceleration of development through a development region (DR) strategy is an effort to implement regional development policy, which allows the development region to function in accordance with its stipulated functions and roles, enabling the creation of a more balanced regional development pattern (Hariyanto, 2006). The division of development regions is a consideration for a more effective development approach and a more focused development process in Malang Regency.
Each development region has different characteristics but, in general, can be categorized into three types, i.e., regions with an advanced, medium or low level of development. The indicators that can be used to measure the level of development in each typology of regions may include economic indicators (GRDP), infrastructure indicators (the availability of facilities and infrastructure and the level of accessibility) and social indicators (poverty).
The development documents of Malang Regency, the Regional Spatial Plan (RTRW), the Regional Medium Term Development Plan (RPJMD) and the Regional Development Work Plan (RKPD) contain very limited information on the characteristics/typology of development regions. Efforts to present the characteristics of development regions into a typology can facilitate the regional government in mapping and evaluating the conditions and problems and concurrently find alternative solutions for each typology. Understanding the characteristics of each typology can provide information about a more strategic approach to the management of each typology (Budiyantini and Pratiwi, 2016).
The main study objective is to analyze the development level of Malang Regency based on the typology of development regions. The target objectives are to develop typologies of the development regions based on analysis of (1) the diversity of the economic sector, (2) the hierarchy of the development regions, and (3) the level of accessibility of the development regions.
Research Methods
Location and Time of Study
The research was carried out for 7 months from April to October 2016. The research location is Malang Regency, East Java and is 3534.86 km2 in size. The administrative map of the development regions in Malang Regency is shown in Figure 1. The study location covers the following six development regions (DR):
- 1. DR I Malang City Ring covering nine sub-districts surrounding Malang City, i.e., Dau, Karangploso, Lawang, Singosari, Pakisaji, Wagir, Tajinan, Bululawang, and Pakis.
- 2. DR II Kepanjen covering ten sub-districts, i.e., Kepanjen, Wonosari, Ngajum, Kromengan, Pagak, Sumberpucung, Kalipare, Donomulyo, Gondanglegi, and Pagelaran.
- 3. DR III Ngantang covering three sub-districts, i.e., Ngantang, Pujon, and Kasembon.
- 4. DR IV Tumpang covering four sub-districts, i.e., Tumpang, Poncokusumo, Wajak, and Jabung.
- 5. DR V Turen and Dampit covering four sub-districts, i.e., Turen, Dampit, Tirtoyudo, and Ampelgading.
- 6. DR VI Sumbermanjing Wetan covering four sub-districts, i.e., Sumbermanjing Wetan, Gedangan, and Bantur.
Types and Sources of Data
The data used in this study is secondary data collected from literature study, related agencies or from various other sources. Secondary data include Malang Regency in figures 2013-2016, Malang Regency Human Development Index of 2015, the Malang Regency Gross Regional Domestic Product of 2007-2012, and the Malang Regency base map.
Data analysis methods
A. Analysis of Economic Sector Diversity of Development Regions
The development of a system (region) can be understood from the increasing number of system components and the spread (spatial reach) of these components. Both of these refer to increased component quantity and expansion of the spatial relationship of the components in the system and with other systems (Panuju and Rustiadi, 2013).
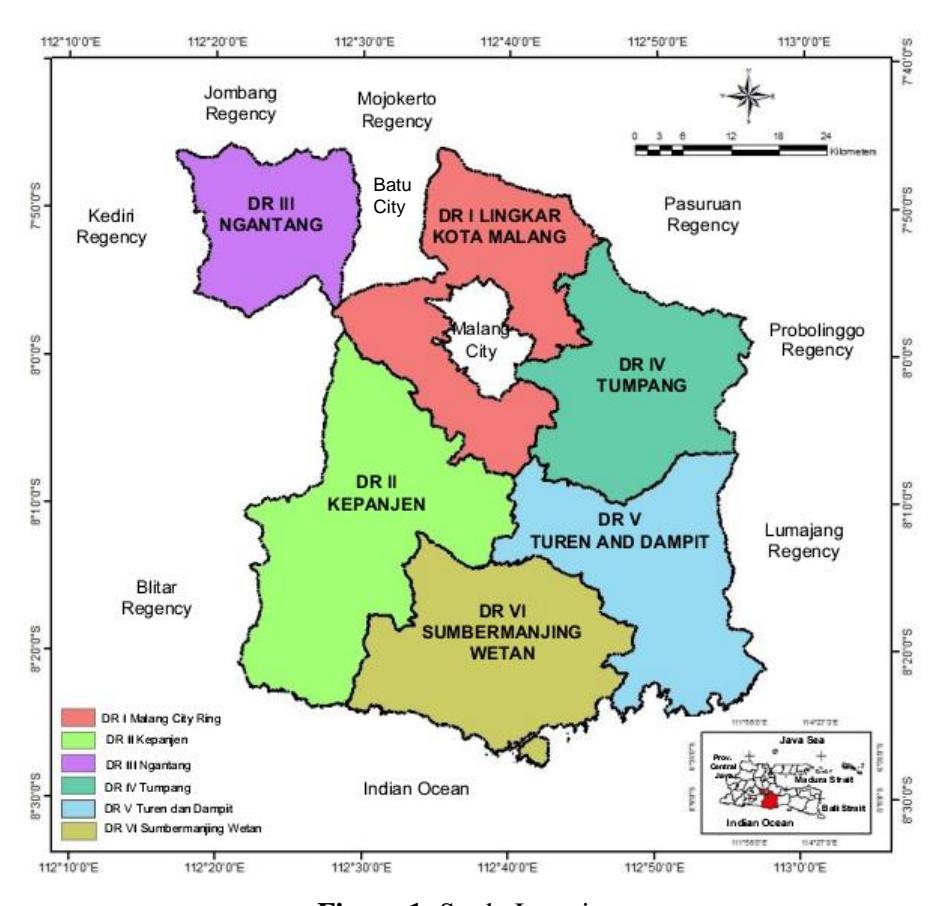
Figure 1. Study Location
The Entropy Diversity Index (EDI) can be used to measure the progress/development of a region and to see its dominant economic sector. The assumption is that the larger or closer to 1 the EDI value of a region is, then the region is developed. Conversely, the smaller or closer to an EDI value of 0, the region is underdeveloped. The general formula of entropy as stated by Sudarya et al. (2013) is:
\[S = -\sum_{i=1}^{n} \sum_{j=1}^{n} P_{ij} \ln P_{ij}\] where:
S = entropy value
Pij = the ratio of the frequency of occurrences in category i in DR j
i = category of activity i, j = category of region j (development region/DR)
n = total categories i and j
In this study, the analysis with the Entropy Development Index (EDI) in six development regions in Malang Regency uses the following two approaches:
- (1) Based on the GRDP in the year 2012 using constant prices in 2000 published in 2013 by the Malang Regency Regional Development Planning Agency in cooperation with the Malang Regency Statistics Agency. This is the most recent data because since 2014 to date no new GRDP data for each DR has been published.
- (2) Based on the working population by sector in 2012 published in 2013, published annually by the Malang Regency Statistics Agency in cooperation with the Malang Regency Regional Development Planning Agency. Data of the year 2012 were used to see the connection between economic activity (GRDP) and the working population in each sector for the same year.
B. Hierarchical Analysis of Development Regions
In general, to see the hierarchy in development level of the development regions, especially in terms of infrastructure it is possible to use a scalogram analysis by calculating the number of units and types of infrastructure in each region. The assumption is that if a region has a relatively complete range of facilities compared to other regions, then the region is able to function as a growth center (Rahayu and Santoso, 2014; Syafi'i and Santoso, 2015). The development level of a region based on a scalogram analysis is reflected by the Regional Development Index (RDI). This index is grouped into three hierarchical classes, based on the standard Deviation (St Dev) of the RDI and its mean values as in Table 1.
Table 1. Determination of Hierarchy Interval Value
| No. | Class | Interval Value | Hierarchy Level |
|---|---|---|---|
| 1. | Hierarchy I | ΣK ij> Mean (K ij) + St Dev (K ij) | High |
| 2. | Hierarchy II | The mean (K ij) <ΣK ij | Medium |
| 3. | Hierarchy III | ΣK ij| Low | |
Note: ΣKij = Weighted Index Value
The data for the scalogram analysis is the number and type of facilities for each DR. The variable used to measure accessibility is the average distance of the sub-districts in each DR to the regency capital. The facilities variable includes 13 types of educational facilities, 10 types of health facilities, 7 types of places of worship and 7 types of services trade facilities.
The data used is of the year 2012, published in 2013. It is published annually by the Malang Regency Statistics Agency Malang in cooperation with the Malang Regency Regional Development Planning Agency. The data of the year 2012 was used to be able to compare it to other analyses that use the same data.
C. Analysis of the Accessibility of Development Regions
Martono (2008) stated that accessibility is always linked with the road network as one of its infrastructures. The level of accessibility of a region can be identified by the density and connectivity of road networks. The more complete, the denser, and the higher the connectivity between road networks indicates that the level of accessibility of the region is better or higher.
Road network performance depends on topological characteristics that help determine the road connectivity (Oluwole and Daful, 2014). The level of accessibility can be measured using an alpha (α) and beta index (β). The alpha index describes the density of the network, while the beta index measures the degree of connectivity in a network. Chen et al. (2014) stated that:
Alpha (α) index is defined as the ratio between the actual and maximum number of circuits in the fully connected network, using the formula:
\[\alpha \text{ index} = \underline{(e - n + q)}\] \[(2n - 5q)\]
Beta index (β) is defined as the average number of roads (e) per node (n) in a network, using the formula:
\[\beta \text{ index} = \underline{e}\] where:
e = the number of roads (edges/links)
n = the number of nodes/vertices
q = sub network (q = 1 for fully connected networks)
The way to determine the number of nodes/vertices and roads (edges/links) can be seen in Figure 2.
4 nodes/4 edges 9 nodes/12 edges 16 nodes/24 edges
Figure 2. How to Determine the Number of Nodes/Vertices and Roads (Edges/Links)
The analysis of the level of accessibility with ArcGIS is done using road network maps based on the Malang Regency Regional Spatial Plan 2010 issued by the Malang Regency Development Planning Agency. This is the most recent map because since 2010 no new roads were constructed in Malang regency. The variable of the road network is measured for all national, provincial, regency and village road networks. Two variables are calculated, namely:
- (1) The number of nodes connected by roads.
- (2) The number of roads or road networks (edges/links) that connect nodes.
The road density is quantitatively calculated based on the alpha index with a value range between 0-1. The higher the index value, the denser the road network in the region. The road network connectivity is quantitatively calculated based on the beta index with a value range between 0-3. The higher the beta index value, the higher the connectivity of the region. The natural and social conditions and the quality of road infrastructure are relatively equal in all regions.
D. Analysis of Grouping of Development Regions
The analysis of grouping development regions is done by using a cluster analysis. Cluster analysis is a statistical analysis of multiple variables that are used to n individuals or objects that have the variable p, and will be grouped into k groups. Objects in one cluster resemble larger properties compared with individuals in other clusters (Dillon and Goldstein, 1984 in Lathifaturrahmah, 2010).
According to Santoso (2010) in Ratnasari (2011), there are two approaches to cluster analysis, namely:
a. Hierarchical Method
This method groups two or more objects that have the closest similarity. Then the process is continued with other objects that have a second closeness. This approach is continued so the cluster will form a type of tree where there is a clear hierarchy between objects, from the most similar to the least similar. Dendrograms are commonly used to help clarify hierarchical processes.
b. Non-Hierarchical Method
This method classifies by first determining the number of desired clusters. After the number of clusters is determined, a clustering process is performed without following a hierarchical process. This method is commonly called K-Means Cluster.
If there is a large difference between variables that can cause bias in the cluster analysis then the original data needs to be transformed (standardization). Large data discrepancies can cause an invalid calculation of distance (Yulianto and Hidayatullah, 2014).
In this research, a cluster analysis is pe rformed on 6 development regions (DR) in Malang Regency using comprehensive and proportional variables to adjust for the area and population size in each development region. Nine variables were used, i.e., average education index, purchasing power index, life expectancy index, human development index (HDI), the ratio of the length of roads in the regency to the region's size, population density, household density, the ratio of working population to the total population, and the ratio of poor families to the total population in 2012.
Results and Discussion
Typology of Development Regions based on the Analysis of Economic Sector Diversity
The typology of development regions is based on the analysis of the diversity of the economic sector using the Entropy Diversity Index (EDI), measured from the GRDP and the working population. The analysis shows relatively similar numbers, i.e., of 0.28-0.93 (GRDP) and 0.28- 0.89 (working population) with an average EDI value for Malang Regency of 0.56. When viewing the total EDI value of each development region (DR), DR I Malang City Ring and DR II Kepanjen have EDI values above the regency average, seen from components of GRDP and working population.
DR I Malang City Ring was ranked first with an EDI value of 0.93 for GRDP (27.93%) and a working population value of 0.89 (26.43%). DR II Kepanjen ranks second with an EDI value of 0.77 for GRDP (23.25%) and a working population value of 0.79 (23.48%). Both regions can be classified as areas with high levels of development.
The dominance in population in DR I Malang City Ring (35.32%) and DR II Kepanjen (23.95%) is caused by the concentration of economic activities in the two development regions. This causes the two development regions to be a center of mobility for the population from development regions in their vicinity. The diversity of activities in these two development regions also greatly affects the development of Malang Regency as a whole.
DR V Turen and Dampit is ranked third with a GRDP EDI of 0.57 (17.22%), which is above the average EDI value of Malang Regency. However, the EDI value for working population of 0.53 (15.76%), is slightly below the average EDI value of Malang Regency. The development level of DR V Turen and Dampit can be categorized as medium.
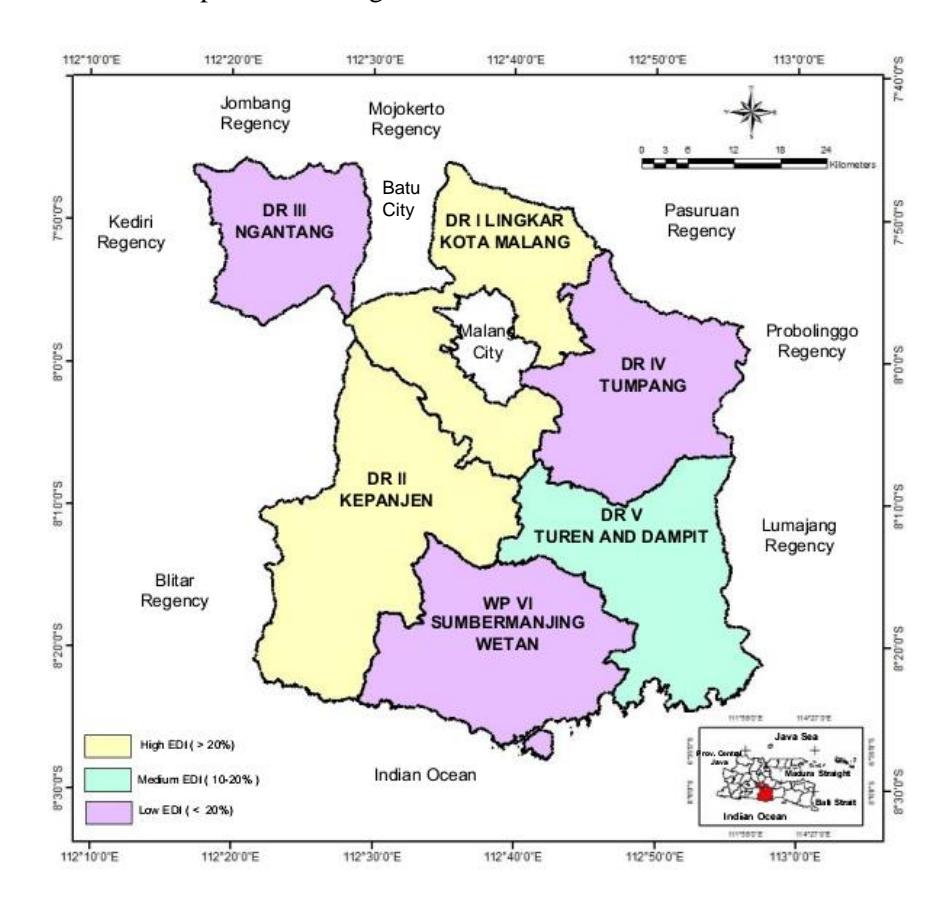
Figure 3. Entropy Diversity Index of GRDP and Working Population Development Regions in Malang Regency
Three development regions are ranked lowest, i.e. DR IV Tumpang, DR III Ngantang and DR VI Sumbermanjing Wetan with total EDI values below the average of Malang Regency. Thus, their development level can be categorized as low. DR IV Tumpang is ranked fourth with EDI values of 0.44 for GRDP (13.32%) and 0.50 for working population (14.67%). WP VI Sumbermanjing Wetan is ranked fifth with IDE values of 0.33 for GRDP (9.83%) and 0.38 for working population (11.34%). DR III Ngantang is ranked last with EDI values of 0.28 for GRDP (8.45%) and 0.28 for working population (8.32%). The results of the EDI value analysis are presented in Figure 3.
In addition to looking at the typology of the development regions based on diversity analysis, EDI analysis can also be used to look at the economic structure, i.e. the compositions that shape or play a role in the economy of a region. The economic structure is classified into three sectors, i.e., primary (agriculture), secondary (industry) and tertiary (services). The primary sector includes agriculture; mining and excavation. The secondary sector includes processing industries; construction; as well as electricity and clean water. The tertiary sector includes trade, hotels, and restaurants; transportation and communications; finance, leasing, and corporate services. The contribution of the EDI value in 2012 in the development regions of Malang Regency based on the GRDP and working population by business sector are presented in Table 2.
Table 2. Entropy Diversity Index (EDI) Values in the Development Regions in Malang Regency by Business Sector for 2012
| No | Type of Entropy | Business Sector | Entropy diversity index (EDI) value per development region | Malang | |||||
|---|---|---|---|---|---|---|---|---|---|
| DR I | DR II | DR III | DR IV | DR V | DR VI | Regency | |||
| 1 | CDDD | Primary Sector | 0.21 | 0.24 | 0.10 | 0.14 | 0.19 | 0.09 | 0.97 |
| 2 | GRDP Entropy | Secondary Sector | 0.29 | 0.14 | 0.05 | 0.07 | 0.10 | 0.07 | 0.72 |
| 3 | Епиору | Tertiary Sector | 0.43 | 0.39 | 0.14 | 0.23 | 0.28 | 0.17 | 1.65 |
| Total | Total EDI GRDP Value | 0.93 | 0.77 | 0.28 | 0.44 | 0.57 | 0.33 | 3.33 | |
| 1 | Working | Primary Sector | 0.25 | 0.23 | 0.09 | 0.15 | 0.16 | 0.12 | 1.00 |
| 2 | Population | Secondary Sector | 0.22 | 0.19 | 0.06 | 0.12 | 0.13 | 0.09 | 0.80 |
| 3 | Entropy | Tertiary Sector | 0.42 | 0.37 | 0.13 | 0.23 | 0.25 | 0.18 | 1.58 |
| Total EDI Working Population Value | 0.89 | 0.79 | 0.28 | 0.50 | 0.53 | 0.38 | 3.38 | ||
Source: EDI analysis processed from data of the Malang Regency Statistics Agency and Malang Regency Regional Development Planning Agency (2013)
Table 2 shows that DR II - DR VI have a similar economic structure, both in terms of GRDP and working population, in which the tertiary sector ranks first, followed by the primary and secondary sector. DR I Malang City Ring has a different structure in terms of GRDP entropy where the tertiary sector is ranked first, the secondary sector second, and the primary sector ranked last. The contribution of the EDI value of working population shows no shift where the population working in the tertiary sector is ranked first, while the primary sector still ranks second ahead of the population in the secondary sector.
Typology of Development Regions based on the Analysis of Development Region Hierarchy
The typology based on the analysis of the hierarchy of development regions using scalogram analysis shows the Regional Development Index (RDI) value of each development region ranges between 21.44-65.12 with an average RDI value of 43.72 for Malang Regency. DR II Kepanjen, which is the center of government of Malang Regency, is categorized as a hierarchy I region with the highest RDI value of 52.36. This means that this region has a generally high level of infrastructure availability; its higher and more adequate level offers the potential to become a service center or growth center.
DR III Ngantang and DR I Solo City Ring can be categorized as hierarchy II regions with RDI values of 52.36 and 44.37 respectively. The availability of infrastructure in these regions is assumed lower than in hierarchy I. That is why these regions cannot become activity/service centers for their surrounding regions; rather they only function as the hinterland.
WP V Turen and Dampit, WP VI Sumbermanjing Wetan, and WP IV Tumpang can be categorized as hierarchy III regions with DRI values of 42.20, 36.80, and 21.44 respectively. The availability of infrastructure in these regions is assumed less complete and adequate than hierarchy I and hierarchy II. The regions belonging to the third hierarchy have the lowest regional hierarchy. Most regions in Malang Regency are in this category. The analysis of hierarchy of development regions can be seen in Figure 4.
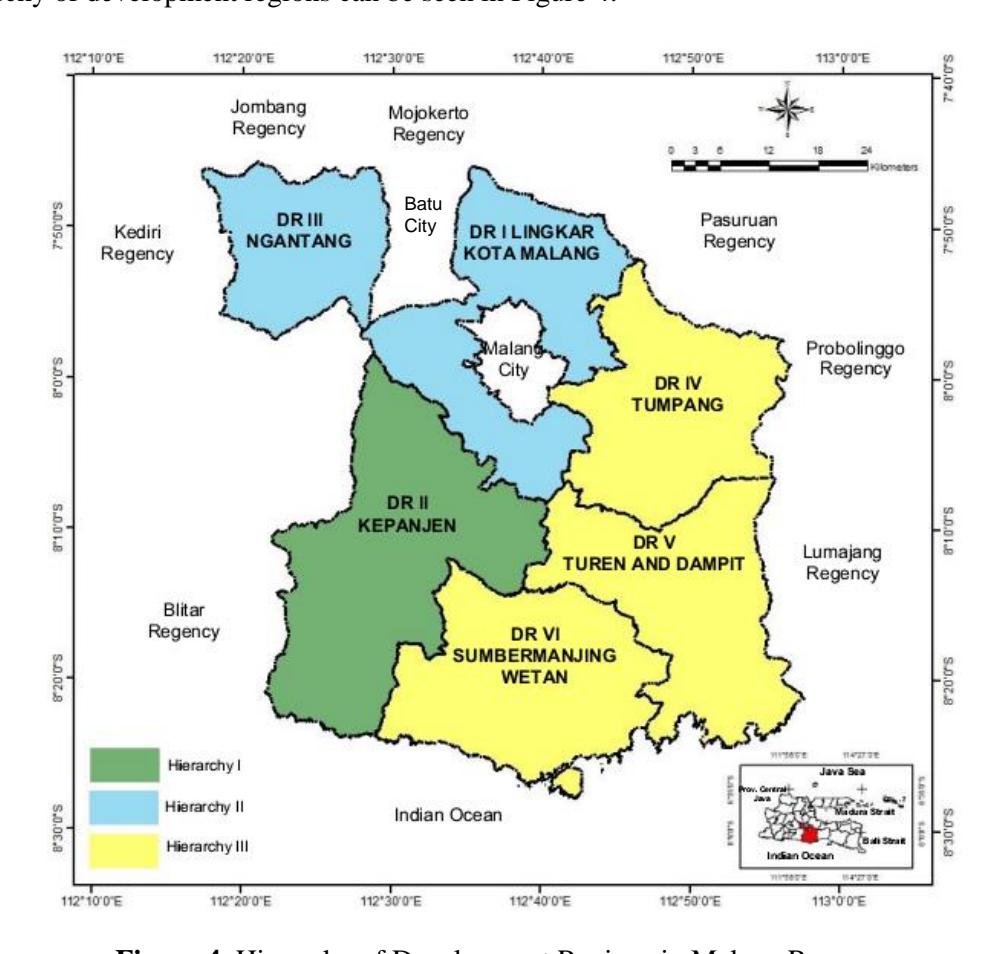
Figure 4. Hierarchy of Development Regions in Malang Regency
Typology of Development Regions based on the Analysis of the Level of Accessibility of the Development Regions.
The typology of development regions based on the analysis of the level of road network accessibility shows that the road density index (α index) and connectivity index (β index) of all development regions (DR) in Malang are on the same level, as shown in Table 3. The map of the road network (links) and nodes of the development regions are shown in Figure 5.
Table 3 shows that the values of the road density index (α index) for all development regions in Malang Regency, in general, are relatively similar, i.e., low levels ranging from 0.06 to 0.09. The varied extent and topographical conditions of Malang Regency are among the reason for the low road density index.
| Table 3. Road Density Index and Connectivity Index of the Development Regions in Malang | ||||
|---|---|---|---|---|
| Regency | ||||
| No | Development Region (DR) | Data | Results | |||
|---|---|---|---|---|---|---|
| Number of nodes/vertices | Number of road networks (edge/links) | Road density index (α index) | Connectivity index (β index) | |||
| 1 | DR I | 4.837 | 5.467 | 0.07 | 1.13 | |
| 2 | DR II | 5.702 | 6,600 | 0.08 | 1.16 | |
| 3 | DR III | 2.197 | 2.508 | 0.07 | 1.14 | |
| 4 | DR IV | 2,572 | 2,879 | 0.06 | 1.12 | |
| 5 | DR V | 3,872 | 4,568 | 0.09 | 1.18 | |
| 6 | DR VI | 1.827 | 2.094 | 0.07 | 1.15 | |
Source: Analysis
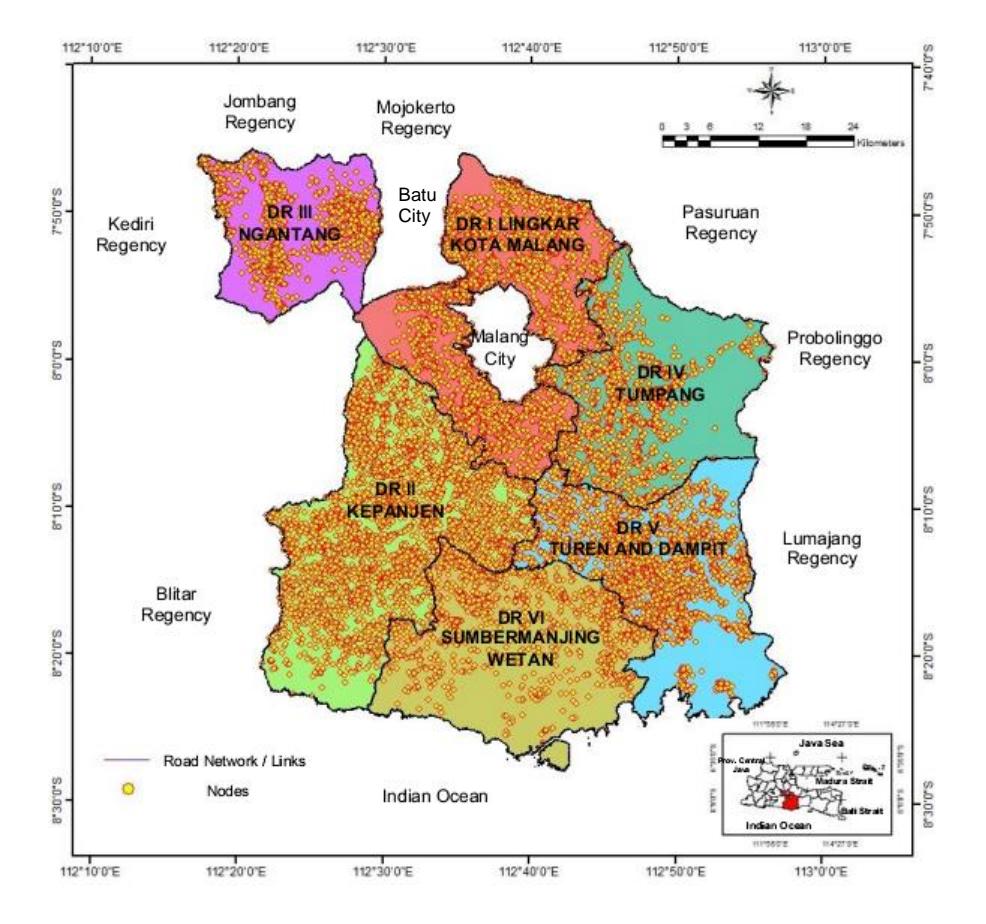
Figure 5. Road Network and Nodes in the Development Regions in Malang Regency
The connectivity index (β index) values of all development regions are also relatively similar, i.e., at medium levels ranging from 1.12 to 1.15. This connectivity can facilitate the mobility of people, goods, and services between regions.
Typology of Development Regions Based on Cluster Analysis
The typology of development regions based on cluster analysis with a hierarchical method (joining/tree clustering) resulted in the dendrogram as shown in Figure 6
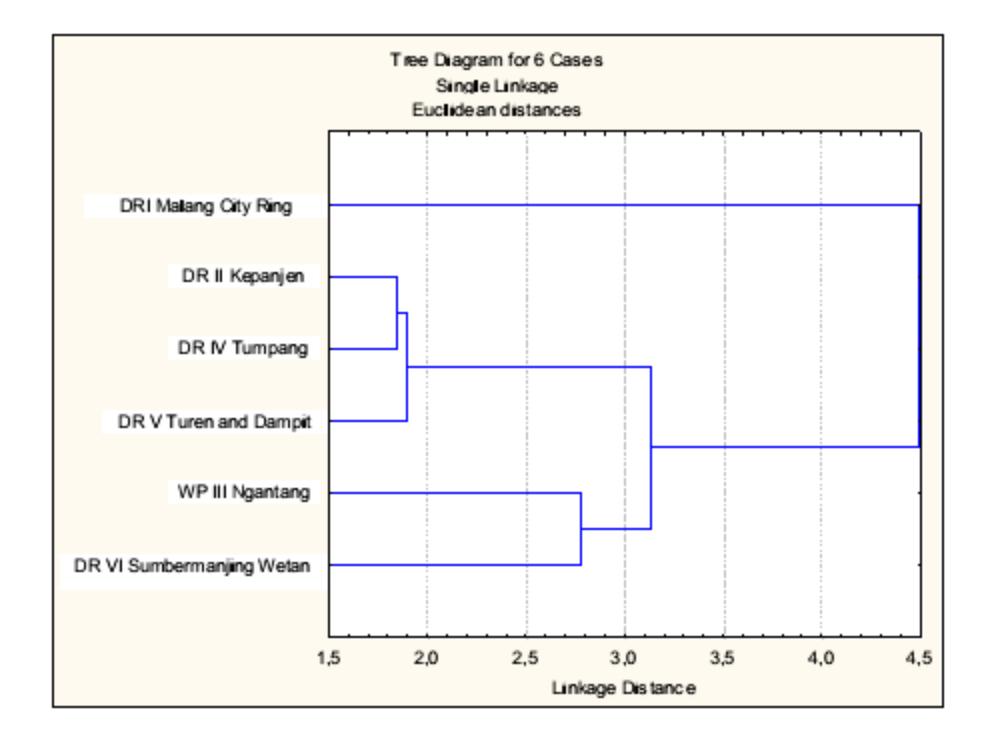
Figure 6. Dendrogram of Cluster Analysis
Based on Figure 6, the optimum number of groups in each cluster can be determined by observing the longest distance (linkage distance) from one connection to the other. Cutting the number of clusters is done at a distance of 3.0, which is half of the longest line (DR I Malang City Ring) on the dendrogram.
The determination of these cuts is subjective so the clustering of regions is significant or has meaning in its interpretation. Based on these cuts, the development regions in Malang Regency can be divided into 3 clusters with DR I Malang City Ring as a separate cluster. The three development regions of DR II Kepanjen; DR IV Tumpang and; DR V Turen and Dampit are combined into one cluster. The other cluster is made up of DR III Ngantang, and DR VI Sumbermanjing The map of development region typology can be seen in Figure 7.
The non-hierarchical method (K-means clustering), besides being used for data analysis of relatively large samples, can also be used to test the consistency of cluster analysis with a hierarchical method (joining/tree clustering). This is done by classifying the mean value of each identifier variable of each cluster into three classes. The result shows the consistency of the cluster members that were divided into three classes. The three classes are (1) typology/cluster I consisting of one development region, i.e., DR I Malang City Ring; (2) typology/cluster II consisting of three development regions, i.e., DR II Kepanjen, DR IV Tumpang, and DR V Turen and Dampit; and (3) typology/cluster III consisting of two development regions, i.e., DR III Ngantang and DR VI Sumbermanjing Wetan.
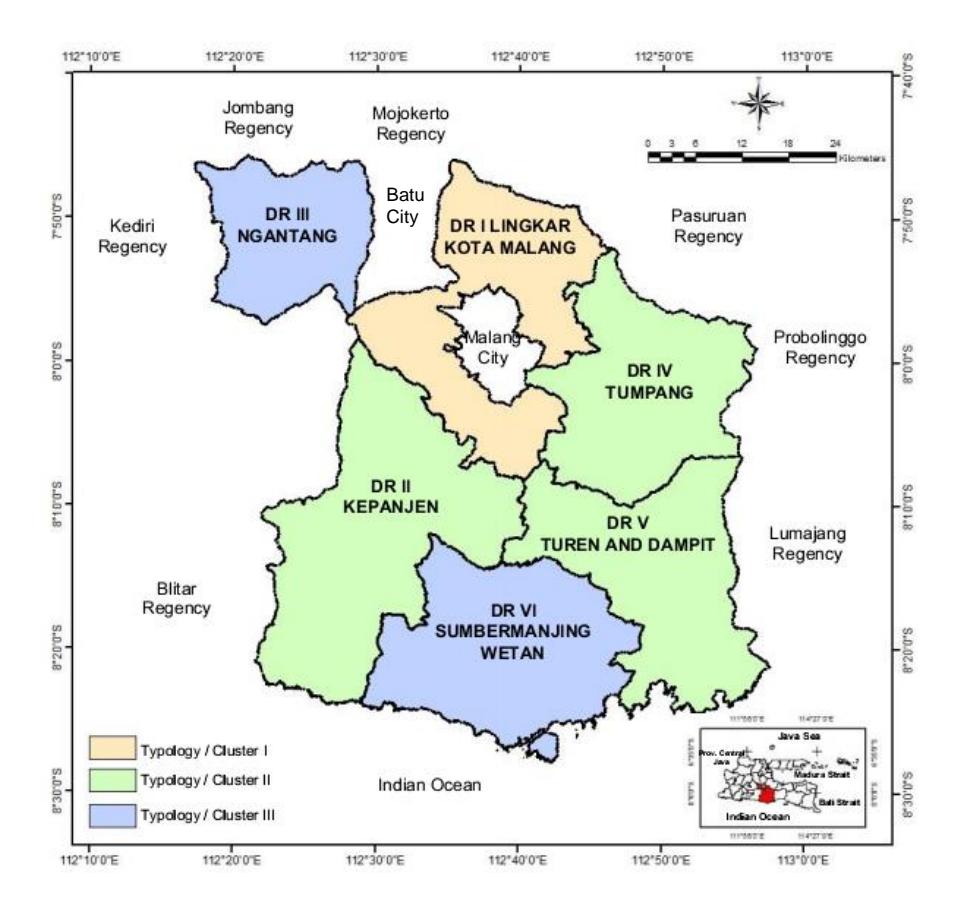
Figure 7. Typology of Development Regions in Malang Regency
Synthesis
The analysis of the Entropy Diversity Index (EDI) and cluster analysis classifies DR I Malang City Ring as typology I with a high development level. The scope of infrastructure services in DR I Malang City Ring is still relatively inadequate in relation to the population served (hierarchy II).
Based on the EDI analysis, DR II Kepanjen is classified as typology I with a high development level. The infrastructure service in this development region is very adequate (hierarchy I). However, the cluster analysis places DR II Kepanjen in typology II.
DR III Ngantang and DR VI Sumbermanjing Wetan, based on the EDI and cluster analysis, are classified as typology III with a low level of development. However, in terms of the range of infrastructure services both development regions perform differently, i.e., DR III Ngantang classifies as hierarchy II, while DR VI Sumbermanjing Wetan is included in hierarchy III.
The EDI and cluster analyses categorize DR V Turen and Dampit s typology II with a medium level of development and an inadequate range of infrastructure services (hierarchy III).
DR IV Tumpang, based on the EDI analysis, is classified as typology III with a low level of development and an inadequate range of infrastructure services (hierarchy III). However, the cluster analysis categorizes DR IV Tumpang as typology II.
In the analysis of the level of accessibility for the road density index (α index), all development regions in Malang Regency are relatively similar in general, i.e., low level. In addition, the connectivity index (β index) also produces relatively similar numbers, at the medium level.
From the various types of analysis that have been performed to illustrate the typology of development regions in Malang Regency, the cluster analysis was most able to describe the typology of the development regions and can be used as reference/material for evaluation by the local government. This is because the variables used in the cluster analysis are more comprehensive (combining various components) and proportional (adjusting for the area and population size in each development region).
The development regions in Malang Regency are divided into three typologies/clusters namely: DR I Malang City Ring in typology I (high development level), DR II Kepanjen, DR IV Tumpang and DR V Turen and Dampit in typology II (medium development level) and DR III Ngantang and DR VI Sumbermanjing Wetan in typology III (low development level). The synthesis of each typology of development regions in Malang Regency can be seen in Table 4.
Table 4. Synthesis of each typology of development regions in Malang Regency
| No. | Typology of Development Regions | |||||
|---|---|---|---|---|---|---|
| Characteristics | Typology I | Typology II | Typology III | |||
| I. General | ||||||
| 1. | Number of development regions | 1 | 3 | 2 | ||
| 2. | Number of sub-districts | 9 | 18 | 6 | ||
| 3. | Total population in 2012 | 757,834 | 1,301,647 | 379,206 | ||
| II. Outcome of typology analysis | ||||||
| 1. | Level of economic diversification | High | Low-High | Low | ||
| 2. | Availability of infrastructure and facilities | Medium | Low- High | Low- Medium | ||
| 3. | Connectivity index | Medium | Medium | Medium | ||
| 4. | Road density index | Low | Low | Low | ||
| 5. | Ratio of road length/area size | High | Medium | Low | ||
| 6. | Population density | High | Medium | Low | ||
| 7. | Household density | High | Medium | Low | ||
| 8. | Ratio of working population/population | Low | Medium | Medium | ||
| Ratio of the number of poor | Medium | High | ||||
| 9. | families/population | Low | ||||
| 10. | Average education index | High | Medium | Low | ||
| 11. | Average purchasing power index | High | Medium | Low | ||
| 12. | Average life expectancy index | High | Low | Medium | ||
| 13. | Average HDI | High | Medium | Low | ||
Source: Analysis
Conclusions
From the analysis above, it can be concluded that the development regions in Malang Regency are divided into three typologies, i.e., DR I Malang City Ring in typology I (high development level). DR II Kepanjen; DR IV Tumpang; and DR V Turen and Dampit in typology II (medium development level). Finally, DR VI Ngantang and DR III Sumbermanjing Wetan in typology III (low development level).
Some characteristics of typology I are a high level of economic diversification, ratio of road length in the regency/area size, population density, household density, as well as the average index of good education, purchasing power, life expectancy and the HDI; the connectivity index and the availability of facilities and infrastructure are medium level; and the ratio of working population to population, the ratio of the number of poor families to population and the road density index are low level.
Typology II is characterized by a high level of economic diversification and a low to high level of availability of facilities and infrastructure. Meanwhile, typology II has an average level of population density, household density, the ratio of working people to population, the ratio of poor families to population, average education index, purchasing power and HDI. The ratio of road length in the regency to area size and the connectivity index are moderate. Finally, the average life expectancy index and road density index are low.
Typology III is characterized by a high ratio of poor families to population; a low-medium level of facilities and infrastructure is provided; a medium ratio of working population to population, average index of life expectancy and connectivity index. Finally, typology III is characterized by a low level of economic diversification, road density index, the ratio of road length in the regency to area size, population density, household density, and average index of education, purchasing power and HDI.