
Introduction
Liveable cities in the world are mostly walkable cities. Cities with a high liveability index such as Copenhagen, Melbourne, Vienna, and Toronto, clearly promote walking for all commuters. Promoting walkability in the urban environment is also an emerging issue in many US cities. Studies have argued that good pedestrian infrastructure encourages the community to do more walking and other physical activities, thereby improving the quality of urban life (e.g. Lovasi et al., 2011). Recent studies indicate the positive impact of walking to reduce health issues associated with cardiovascular risks, such as obesity and hypertension (Wang and Beydoun, 2007; Flegal et al., 2012; Glazier et al., 2014). Flegal et al., (2012) revealed that the prevalence of obesity in American adults from 2009 to 2010 was 36% among adult men, and 36% among adult women. They found no significant change compared with data from 2003-2008.
Another motivation for promoting walkability is to encourage urban citizens to perform sustainable mobility. Since the 1960s, US cities have experienced increasing urban sprawl, lowdensity development, and suburbanization. Such trends partly cause high dependency on automobile use and make people tend to walk less (Kelly-Schwartz et al., 2004). According to Hankey and Marshall (2010), auto dependency contributes to air pollution and transportation emissions within urban areas. The US Department of Energy (2009) revealed that the transportation sector contributes to one-third of total national greenhouse gas emissions (GHG).
A number of studies have clearly demonstrated a substantial correlation between the built environment and individual engagement in physical activities (e.g. Doyle et al., 2006). For example, it has been reported that people living in walkable and safe areas tend to have walking activities with greater frequency. Multiple aspects of the built environment influence the preference to walk. Those include population or residential density, proximity to retail, land use, and street connectivity. Residents living in a neighborhood with high density, connected streets, and accessibility to commercial and offices are more likely to walk (Saelens and Handy 2008). Such built environment settings may be commonly found in urban cores, but they are rare in urban fringes. However, in the US many suburbs have a higher population than city centers and city growth creates greater distances and separation between different land uses, such as residential and commercial land uses (Pucher and Buehler, 2010). Thus, some improvement in the suburban built environment should be done to enhance walkability. The provision of infrastructure is critical to promote a resilient community and avoid growing inequities, especially in the context of physical accessibility, among city residents (Woltjer, 2014; Rahmawati, 2015; Jones, 2017).
Amherst, New York is a suburban area situated around the northeast part of the administrative boundaries of Buffalo City. Its land cover is dominated by low-density residences, occupied by about 122 thousand people according to the 2010 census. Overall, Amherst represents a larger portion of Erie County's total population, having grown by 12% in 2000 and 13% in 2010, as reported by the Town of Amherst Planning Department (2012). It is well known as the home of the University at Buffalo (UB) North Campus and, according to the report, the number of the population is predicted to keep growing as the number of UB students shows an increasing growth rate annually. To date, there has been a limited number of studies examining walkability in Amherst's pedestrian environment. With its rich diversity in terms of demography and a large proportion of students who live in this area, it may be important to encourage people to utilize non-motorized transportation modes, such as walking.
This study was aimed at evaluating pedestrian environment walkability from a residential area to a commercial area in Amherst. An audit tool, namely the Pedestrian Environmental Data Scan (PEDS) instrument, was developed to record data on physical built environment elements. Data collection is integrated taking advantage of geo-spatial technology so that pedestrian environment characteristics can be presented spatially. This tool is relatively simple and straightforward to use in order to evaluate whether a pedestrian environment helps to promote walkability. The result was expected to be a consideration in the further development of the audit tool. Policy makers and scholars may adopt PEDS in support of pedestrian environment assessment as this approach is low-cost and easy to use, thus overcoming common constraints that often exist in developing countries.
Methodology
Clifton, Smith, and Rodriguez (2007) introduced a powerful yet simple tool for pedestrian environment audit, namely Pedestrian Environmental Data Scan (PEDS). The instrument features a set of observation questions that guide the auditors in capturing and assessing physical elements of non-motorized travel. It was designed as a response to the growing interest to identify the potential connection between physical activity, health outcomes, and built and natural environment (see Table 1). This pedestrian audit is taken at the level of road segments bounded by intersections. The advantage of this instrument is that it allows the auditors to take data on micro-scale environmental characteristics, including pedestrian facilities (i.e. path materials and types of pedestrian facilities), road attributes (i.e. the condition of roads and curb cut availability), walking/cycling (i.e. bicycle lane and lighting availability). Meanwhile, macroscale measurement is also included to capture land use, road attributes and pedestrian facilities around a road segment.
In this study, the PEDS instrument was adopted to evaluate walkability in a pedestrian environment. Thirteen variables were adopted from PEDS for this study, i.e.: (1) segment type; (2) land use in the given segment; (3) slope; (4) segment intersections; (5) types of pedestrian facilities; (6) path condition; (7) number of trees shading walking areas; (8) crosswalks; (9) roadway/path lighting; (10) segment attractiveness for walking; (11) segment attractiveness for cycling; (12) segment safety for walking; and (13) segment safety for cycling. Some variables that are not relevant for the context of this study were excluded. The data input represents the current characteristics of the built environment that were used to assess the thirteen factors shaping walkability in the pedestrian environment connecting a residential area and a commercial area. Subjective walkability evaluation was selected for street attractiveness and safety assessment (Clifton, Smith, and Rodriguez 2007).
Table 1. Variables to evaluate the pedestrian environment
| No | Variable | Characteristics | Explanation |
|---|---|---|---|
| 1 | Segment type |
| High-volume roads often make crossing the street difficult or unattractive for pedestrians (Clifton, Smith, and Rodriguez |
| \(v/c = volume/capacity\ ratio\) | 2007) | ||
| 2 | Uses in segment | (All that apply) 1. Housing – Single family detached 2. Housing – Multi family 3. Housing – Mobile homes 4. Office/institution 5. Restaurant/café/commercial 6. Industry 7. Vacant/underdeveloped | Compact, high-density and mixed land use can encourage walking and cycling because of the advantage of shorter trip distances (Pucher and Buehler 2010). Residents are in close proximity to places to work, shop, and |
| 8. Recreation | recreate, so the potential for walking is greater (Saelens and Handy 2008) | ||
| 3 | Slope | 1. Flat (< 12%) 2. Slight hill (12-25%) 3. Steep hill (> 25%) | The steepness of slopes determines the degree of accessibility of sidewalks or public spaces, especially for persons using a wheelchair. Slopes of up to 25% or 14° inclination are relatively accessible for general users, but |
| such condition would impose a barrier for elderly or disabled persons (Czogalla, 2010). | |||
| 4 | Segment intersection |
| Many suburban roads in the US have few intersections and feed directly into high-speed traffic arterials, increasing the danger of trips outside the neighborhood (Pucher and Buehler 2010). |
| 5 | Type of pedestrian facility |
| Pedestrian facilities can greatly encourage walking if they are well maintained and include attractive paving, a wide sidewalk and shading trees |
| 6 | Path condition | 1. Poor (> 80% bumps/cracks/holes) | (Pucher and Buehler 2010). To encourage more walking and |
| cycling, safe and convenient infrastructure should be provided, such as sidewalks, | ||
| 4. Under repair | crosswalks, bike paths and lanes, | ||
| 7 | Number of trees | 1. None or very few (< 25% of total | and intersection crossings; traffic |
| No | Variable | Characteristics | Explanation |
|---|---|---|---|
| shading walking areas | trees in the segment) 2. Some (25-50% of total trees in the segment) 3. Many/dense (>50% of total trees in the segment | calming of residential neighborhoods (Pucher and Buehler 2010). | |
| 8 | Crosswalks | 1. None 2. 1 to 2 3. 3 to 4 4. More than 4 | |
| 9 | Roadway/path lighting | 1. Road oriented lighting 2. Pedestrian-scale lighting 3. Other lighting 4. No lighting | |
| 10 | Segment is attractive | Perceived attractiveness and | |
| 11 | for walking Segment is attractive | safety for walking along a street segment are predictive factors to influence walking behavior | |
| 12 | for cycling Segment is safe for walking | 1. Strongly agree 2. Agree | (Adkins et al. 2012). |
| 13 | Segment is safe for cycling | 3. Disagree 4. Strongly disagree | Attractiveness or liveliness are key factors to improve the experience of pedestrians when walking in the proximity of a commercial area (Damanik and Pratiwi, 2017). |
Source: Adapted from Clifton et al. (2007)
To collect and examine the data, this study integrated the audit tool with ArcGIS Online developed by ESRI. This is a cloud web-based geographical information system (GIS) solution that provides a robust platform for creating and sharing geospatial data to designated users or the general public. Data are collected by using Collector for the ArcGIS software application installed on a smartphone device. The app offers attractive and paperless survey administration that allows auditors and other users to access and update real-time data. The app uses the global positioning system (GPS) and a digital camera embedded in a handheld device, allowing users to take geo-spatial references and pictures incorporated directly into the cloud data set in ArcGIS Online. This is one of the data collection techniques proposed by Clifton et al. (2007) in which they used personal digital assistant (PDA) devices.
The audit tool was used to collect data on road segments connecting a residential area and a commercial area in Amherst, New York on April 2nd, 2016. The initial point of this walking experience and pedestrian environment audit was 89 Springville Avenue and the final point was 4606 Bailey Avenue, with a total distance of about 1.5 miles, or 2.4 kilometers (Figure 1). Springville Avenue is a street located in the western boundary of the Town of Amherst, where suburban single family houses can be found. It is adjacent to UB South Campus in the southern part and a commercial area along Bailey Avenue. Around 4606 Bailey Avenue, several stores can be found, including a Wal-mart, an Asian grocery store, Indian grocery stores, several restaurants and other types of retail. There are ten segments along the walking route and the auditors rated both sides of the streets at once.
The following part explains the audit results based on the authors' observations and the collected data. The subjective observations made by the first author were then transformed as a qualitative assessment to audit the built environment. This approach may enable the evaluators to carefully describe the subjective conditions of each segment of the road. The main analysis of this research was focused on five road segments that show the most relevant and intriguing results. The findings are described per road segment to provide details of the characteristics of each road segment. The explanation is coupled with pictures describing how the audit tool can help the user to observe and assess road segments.
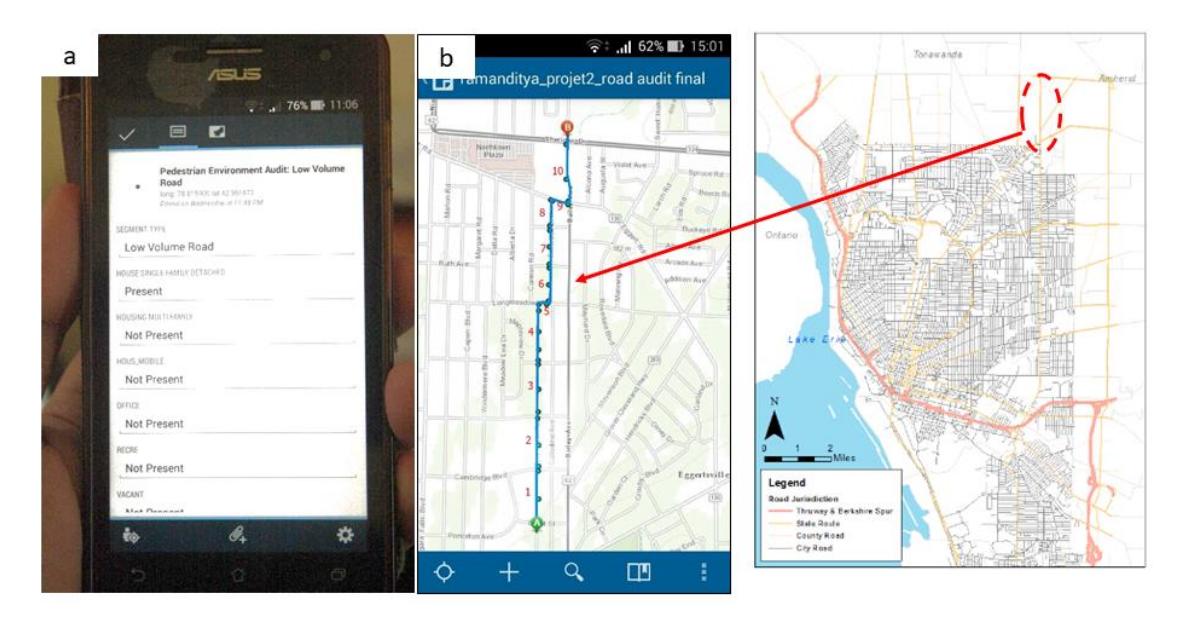
Figure 1. (a) The designated audit tool interface in the collector app, and (b) the road segments selected in this study for assessment using ArcGIS Online
Findings
According to the field observation, the first road segment is surrounded by single family houses. This segment also has low-volume traffic on the road. The sidewalk path condition was rated as fair, as the authors found some cracks along the sidewalk. Pedestrian-scale lighting units are present in this segment, but only two are installed. At the end of the segment, four crosswalks are available. We observed that the provision of those crosswalks is to accommodate those who walk to Windermere Boulevard Elementary School (Figure 2). Overall, the segment is flat and shaded by trees, so walking during daylight in summer will be very comfortable and attractive. The presence of crosswalks and pedestrian-scale lighting is important as safety infrastructure for pedestrian users.
The second road segment is safe and attractive for pedestrians, especially during daylight. The condition of the sidewalk path is fair with some bumps in the path. Single family detached housing is the prominent land use and the road traffic volume is low. The amount of pedestrianscale lighting is very limited, making this segment quite dark and less safe when walking at night. At the end of the segment, four crosswalks are available because the intersection has direct access to a school. However, no crosswalk is available until the ninth road segment. During the observation, the leaves of the trees had not grown back yet after winter, which made this road segment less attractive. However, a better assessment of the landscape can be done if the survey is conducted during spring or summer.
Figure 2. End point of the first segment
Along the eighth road segment, single family housing dominates the land use. This segment is part of Emerson Drive, where the houses have larger front yards. This makes walking more comfortable and attractive. This road segment has low traffic volume and a flat slope, which may encourage individuals to walk along the road. However, few shading trees are present, making it less attractive during daylight. The condition of the sidewalk is better than that of the previous segments, but it does not have any lighting. There is no crosswalk in this segment. Walking through the eighth segment is safe and attractive for pedestrians. This segment is also safe for cycling. The road is wider than that of the previous segment, although it is also used for off-street parking.
Figure 3. The ninth segment
The transition between the residential area and the commercial area can be found between the eighth segment and the ninth segment. In this part, the land use is more varied, where the auditors found some multi-story family houses and retail stores. The sidewalk path condition is good with only a few cracks. The traffic volume is higher when walking through the flat segment because it is the end of Bailey Avenue, which has high traffic volume (Figure 3). The auditors observed that four crosswalks are provided to cross Bailey Avenue and Eggert Road. There are only few trees along this segment, which make it less attractive for pedestrians. Some road-oriented lighting units are installed to give more clear vision for both pedestrians and drivers at night. Overall, this segment is not attractive for walking or cycling, because only few shading trees are present and there is no bike lane. Safety for walking is a prominent character of this segment, because the sidewalk is wider and it has crosswalks.
Figure 4. The tenth segment
The last segment is the least attractive and safe for walking (Figure 4). The sidewalk does not have shading trees on either side, which may discourage people to walk. It is also mixed with entrance paths to stores for the high-volume traffic, thus the path is quite unsafe for pedestrian users. Although this segment is fully equipped with road-oriented lighting units, it is unsafe if an individual walks alone during the night, partly due to security issues. The road is dominated by commercial use, where the retail stores have limited operation hours, making only few people stay in this area at night. It can be argued that security is an important issue in this segment as this environment could attract criminal activity.
Conclusion and Recommendations
Overall, the selected road segments between a residential area and a commercial area have the characteristics of a walkable environment. It further means that such characteristics indicate good walkability. The most convenient pedestrian environment was identified within the residential area. The sidewalks are attractive. They are built on a flat slope, sided with dense shading trees, and have low-volume traffic. Only some cracks and bumps in the pathway were found. At night, the sidewalks are safe because they have been equipped with pedestrian-scale lighting. Crosswalks are helpful for safety in the school zones. The selected routes have some segments that are attractive for cycling, but it is not safe to do so. The reason is that some road segments are narrow and, in the transition segment, a cyclist could be at risk because of the high-volume traffic and there is no bike lane. In the commercial area, the pedestrian
environment is less attractive due to the lack of trees and less safe due to the mixed use of the pedestrian path, which is also used as store entrance for cars.
The results also reflect the need of improvement of the audit tool in the future, for policy makers as well as for urban planners. This study confirms that the PEDS instrument is an effective auditing tool for evaluating a pedestrian environment at neighborhood scale. The study also found that variables related to time and weather should be included in future audits. The study indicates that a different timing of the audit would have offered different insights. For example, when walking and assessing the environment at night or during summer would lead to different experiences. Other potential variables that should be included are path material and its pattern because this could influence people's perception and behavior during walking. However, it is acknowledged that the audit tool still has limitations in determining the overall walkability score since the scoring approach is based on a qualitative and subjective measure.
This study offers three recommendations of design changes to improve walkability in the selected segments. Firstly, the sidewalk path should have various pavement patterns in each segment because the road has a grid system, which creates an unattractive view for pedestrians. Secondly, the road segment where the commercial area of Eggert Road and Bailey Avenue are located should be planted with more trees to improve its attractiveness. During the observation, we found that the lack of trees is an issue. Thirdly, a bike lane should be provided because the road segment is attractive for cycling but it has limitations due to safety issues. Overall, the study can confirm that the pedestrian environment in the given case seems to partly promote walkability. The results also indicate good walkability from the charateristics assessed in the study. However, several improvements such as improving the quality of pavement, light during evening period, and traffic sign improvements need to be carried out, in order to enhance the level of walkability in the given case.
Acknowledgements
The first author would like to thank Dr. Bumjoon Kang (University at Buffalo, State University of New York) who facilitated this research. This research was supported by a Fulbright Scholarship granted to the first author, who conducted it as part of his course work at University at Buffalo. Lastly, the authors are grateful to the reviewers and the editors for their comments, critiques, and advice that have improved the quality of the manuscript.