
Introduction
Education facilities can be defined as activities or materials that satisfying social, mental, and spiritual needs in a community through the provision of a learning atmosphere and learning processes that make students actively develop their self-potency and acquire the spiritual strength and skills needed for themselves, the community and the state (Sitorus, 2009). Some types of education facilities are regulated by SNI 03-1733-2004 on the Procedure of Housing Neighborhood Planning in Urban Areas, one of which are high schools. A high school is an education facility implementing a middle education program prioritizing the expansion of the students' knowledge and enhancement of their skills to enable them to continue to a higher level of education. The principle of locating high school education facilities can be done according to a system known as clustering. Clustering means the division of a region into several clusters, subregions or areas based on agreement (KBBI, 2008). Nowadays, state high school in Bandung tend to be centered in the city center and spread in the fringe areas of the city such as in South and East Bandung. Accesibility can be seen from the availability of a dense road network that makes it easier for those living in the city center to reach school locations compared to those living in fringe areas of the city.
Some cities in Indonesia have implemented clustering policies. In Bandung this was done through Mayoral Decree No. 610 Year 2016 on the Procedure of New Students Admissions (PPDB) for Kindergarten/Raudhatul Athfal and School/Madrasah. The enactment of this decree implements a regional-based system for school accessibility based on the proximity of residence and school. This decree tries to offer more equal education opportunities and improve access to education facilities. However, clustering of state high schools in regions tends to restrict students from obtaining better education, because school quality in each region is different (Ilyani, 2012).
The objective of this research was to identify the effectiveness of clustering in evenly distributing accessibility toward education facilities at high school level in Bandung. In order to reach this objective this research aimed to:
- 1. analyze the clustering policy related to new student admissions in Bandung City;
- 2. identify the distribution of high school level education facilities based on PPDB policy in Bandung City;
- 3. identifying the distribution of high school level education facilities based on high school quality and capacity.
Literature on the Principles of Locating High School Level Education Facilities
According to Golany (1976), a high school should be located in the middle of the neighborhood it serves. Similarly, Golany, De Chiara and Koppelman (1982) stated that the combination of a high school and a community park should be located in the middle of a housing neighborhood for easy access. In another publication, De Chiara (et al.) states that the accesibility standard for middle schools is a maximum walking distance of 1-1.5 miles (1.6-2.4 km), while based on using a motorized vehicle the maximum distance is 2.5 miles (4 kms).
Based on Study on the Standard of Urban Facilities (DTK DKI Jakarta, 1993) the range of high school facilities is the same as that of junior high school facilities, i.e. 2.5 kilometers, equal to a 30-minute walk, serving a population of 5,000-30,000. School facilities should be easy to access from the center of activities and artery roads of a housing neighborhood. A study conducted by Noreisch (2007) on school catchment area evasion in primary schools in Berlin showed that there is more than distance when defining the school catchment area. Noreisch highlights the need of making a distinction between the preferences of people living in urban and suburban areas, which can lead to unequal outcomes. Meanwhile, Parsons (2000) has shown that the concept of geographical catchment area does not apply in school selection because this mainly depends on parental preference, thus weakening the spatial dimension of the school catchement area concept.
Literature Review of Neighborhood Unit Concept
The neighborhood unit concept was introduced by Sir Ebenezer Howard (1850-1928) to propagate the rural traditional community as the ideal community. Clarence Stein (Gallion, 1927) further developed the neighborhood unit concept by determining the distance from residence to facility. Clarence Perry adapted this concept in 1929 in an effort to counter the decline in the quality of community life in industrial countries at that time (Prayogo, Malik and Sembel, 2015). According to De Chiara and Koppelman (1975), the standard for determining a school's location should include areal range, design characteristics, and locations designated for each level of education. The areal range for high schools is ¾-1 mile (1200-1600 meters) with a central location close to other general facilities for easy access.
Easy access to schools is also mentioned by Black (1981), i.e. in managing and planning school locations urban planners should take into account the transportation system that serves the area, the distance from settlement locations, and conformity with other land uses.
Methods
This research used a survey method. According to van Dalen, a survey is part of a descriptive study with the objective to find a phenomenon by comparing it based on a set standard. In using the method, a qualitative approach was used. This was based on the objectives of this study and also made it possible to respond to different research questions simultaneously.
Method of Data Collection
The method used in processing the collected data in this research was a secondary survey by obtaining secondary data through a literature review and a related institutional survey. The data in the literature review come from popular sources such as websites and official sources such as books, articles, journals, lectures, and research papers on clustering policy, clustering policy of education facilities, neighborhood unit theory, network analysis theory using ArcGIS, general characteristics of Bandung City, and grading of school quality.
The institutional survey was conducted through collection of data such as spatial data, road network data, administrative region dividions, land use, and distribution points of high school levels of education facilities in Bandung, the population of Bandung, the number of students and graduates that went on to university to see the quality and capacity of each high school education facility in Bandung. These data were collected through related institutions such as the Spatial Planning and Housing Agency, the Central Statistics Bureau, the Education Agency, the Transportation Agency and the Regional Development Planning Board of Bandung Municipality.
Data Analysis Method
In order to reach the stated objectives of this research, data analysis was implemented for each target.
a. Content analysis
Content analysis was used to answer the first objective, i.e. identification of clustering policy as part of the high school admission system in Bandung. Content analysis consists of analyzing materials documented from books, magazines, newspaper, and content from verbal sources, spoken or written (Kothari, 1985). This analysis was used to identify the clustering system as it is contained in Mayoral Decree No. 610 Year 2016 on the Procedure of New Student Admission at Kindergarten/Raudhatul Athfal and School/Madrasah and to explain the admission system, specifically in high schools, as the basis for high school clustering in Bandung. The result was used as input for the last objective, i.e. identification of high school distribution based on high school capacity and quality in Bandung, and to describe the clustering policy in implementing school grouping (in this case of high schools) based on the locations of residential areas in Bandung. The result of this identification was used as input for the last objective, especially in mapping the clustering area division using the ArcGIS application.
b. Spatial analysis
The second and third objectives of this research were achieved through GIS. The ArcGIS application in this research used a number of geo-processing tools, such as network analysis and spatial overlay analysis. The first stage of determining school capacity was to determine the area of service for each state high school education facility using a network analysis tool capable of producing area coverage (polygons) based on accessibility or road network availability to reach each facility. The second stage was to determine the number of the high school age population in the vicinity of each education facility intersecting with the coverage area that was produced before. The result of this stage was a description of demand, i.e. total number of high school age population within the coverage area of each education facility. This number was compared to the total number of students (capacity) accommodated by each facility. The result of the comparison was the basis for consideration of the education facility's ability to accommodate students according to the clustering policy of Bandung City.
The next step was to identify the distribution of high school level education facilities based on the quality of each facility. The quality of each high school level education facility was determined based on several criteria during the assessment of the accreditation of high school level education facilities, among others: passing grade, average score of national examination, and percentage of graduates that went on to university. The first stage in conducting this analysis used parameter weighting analysis through a GIS-based rank method. The weighting method fuses three existing variables into a new parameter for high school quality. The distribution of schools based on quality from the weighting of the three variables was then mapped for each clustering area to show the distribution of facility quality for each clustering area.
1. Network Analysis
Network analysis is a group of spatial operations conducted on network data (network data set) for the purpose of finding the fastest route, service area, closest facility, OD cost matrix, vehicle routing problems, and location-allocation. The objective of new service area is to determine the lines or nodes in a network to some locations that are the destination of a trip (de By et al. 2004). Generally, the location that is the objective of the analysis is a service center of the area. The service center can be a health service center, an educational facility, a water provision facility, etc. The function of the service area can be used to solve network allocation problems in implementing service coverage of social facilities in a certain region.
2. GIS-based Weighting Analysis
The objective of parameter weighting is to express how much influence one parameter has on another parameter. Plenty of methods are available for this weighting, some of which are commonly used in GIS. They are based on: (1) ranking; (2) rating; (3) pair comparison, and (4) trade-off analysis.
The ranking method is the simplest for providing weight points. The essence is that each parameter is arranged based on rank. Rank determination is subjective and highly influenced by the perception of the decision makers. Rank determination can be done directly, e.g. the most important parameter is given 1 point, the second most important parameter 2 points and the least important parameter 3 points, or it can be done in the opposite way, e.g. the least important paremeter is given 1 point, the sceond most important parameter 2 points, and the most important parameter 3 points. After the rank has been determined, there are 3 ways to deterimine the weight of each region, i.e. using rank number, rank dependency, or rank exponent.
c. Descriptive Analysis
Descriptive analysis was used to describe a comparison between the distribution of high schools in Bandung City based on capacity and based on quality. This comparison was done to obtain a description of the effectiveness of the clustering policy in responding to the objective of the policy, i.e. providing the school age population equal opportunities to obtain qualified education in Bandung City.
General Description of the Clustering System in Bandung City
The clustering system in Bandung City is regulated by Mayoral Decree No. 610 Year 2016 on the Admission of New Students (PPDB) in Kindergarten/Rudhatul Athfal and School/Madrasah. One of the objectives of the admission system regulated by the decree is to give a chance to the school age population to obtain qualified education in accordance with their own preferences (Figure 1).
Chapter II, Article 4.2 discusses the procedure and mechanism of PPDB in Bandung City and states that admission for the junior high (MT) and high school (MA) levels is determined by a regional, distance-based system. The resulting PPDB system is a clustering system. The distance-based regional system is regulated in the attachment of the PPDB regulation.
The PPDB mechanism at high school level is divided into 2 (two) tracks, i.e. an academic track and a non-academic track. A quota system is stipulated for candidate students, i.e. quota for candidate students on the academic track living within or outside of the region, and quota for candidate students on the non-academic track, categorized as volatile or non-volatile. Candidate students on the academic track are allowed to select 2 (two) high schools based on their score on the national examination at the previous level (junior high) or their score on the package B equivalency examination. Candidate students in Bandung who choose option 1 or option 2 within the area of their domicile or within a distance of 2 km get a regional incentive in the form of a chance to be accepted on the basis of the protection quota within the area through selection among candidates from the same region at the first stage of the selection process for school option 1 or 2.
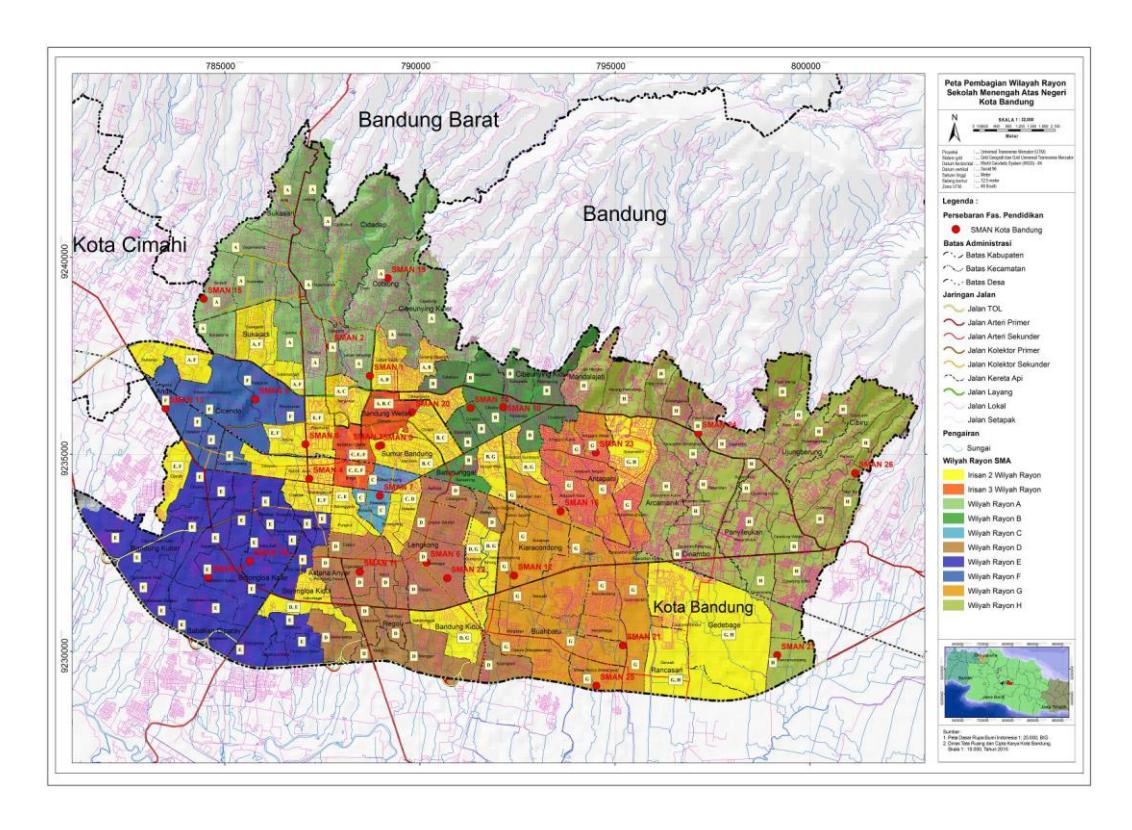
Figure 1. Map of Regional Clustering Distribution in Bandung. Source: Adaptation from Bandung Mayoral Decree No. 610 on PPDB
Table 1. Regional Clustering Division of State High Schools in Bandung
| Region | School | Region | School |
|---|---|---|---|
| Δ. | SMAN 1 | SMAN 4 | |
| SMAN 2 | E | SMAN 17 | |
| A | SMAN 15 | SMAN 18 | |
| SMAN 19 | SMAN 6 | ||
| SMAN 10 | F | SMAN 9 | |
| В | SMAN 14 | SMAN 13 | |
| SMAN 20 | SMAN 12 | ||
| SMAN 3 | G | SMAN 16 | |
| C | SMAN 5 | G | SMAN 21 |
| SMAN 7 | SMAN 25 | ||
| SMAN 8 | SMAN 23 | ||
| D | SMAN 11 | Н | SMAN 24 |
| D | SMAN 22 | п | SMAN 26 |
| SMAN 27 |
Source: Bandung Mayoral Decree No. 610 on PPDB
Distance measurement between school and residence of the candidate student, as mentioned in the General Provision included in the attachment of Mayoral Decree No. 610 Year 2016 on the procedure of PPDB, is implemented in weighting the score for each candidate student. The smaller the distance between school and residence, the higher the score that is given.
The state high school education facilities in Bandung are grouped into 8 (eight) regional groups that form the basis for the admission of new students, i.e. regions A, B, C, D, E, F, G, and H (Table 1).
Identification of High School Distribution Based on School Capacity in Bandung
The capacity of each state high school in Bandung was used as the benchmark for assessing accessibility by the community in obtaining a high school level education. State high school capacity is determined by comparing a number of variables, i.e. (1) total number of the high school age population (15-19 years of age) in each region; (2) proportion of the region within the service area; and (3) capacity of each school.
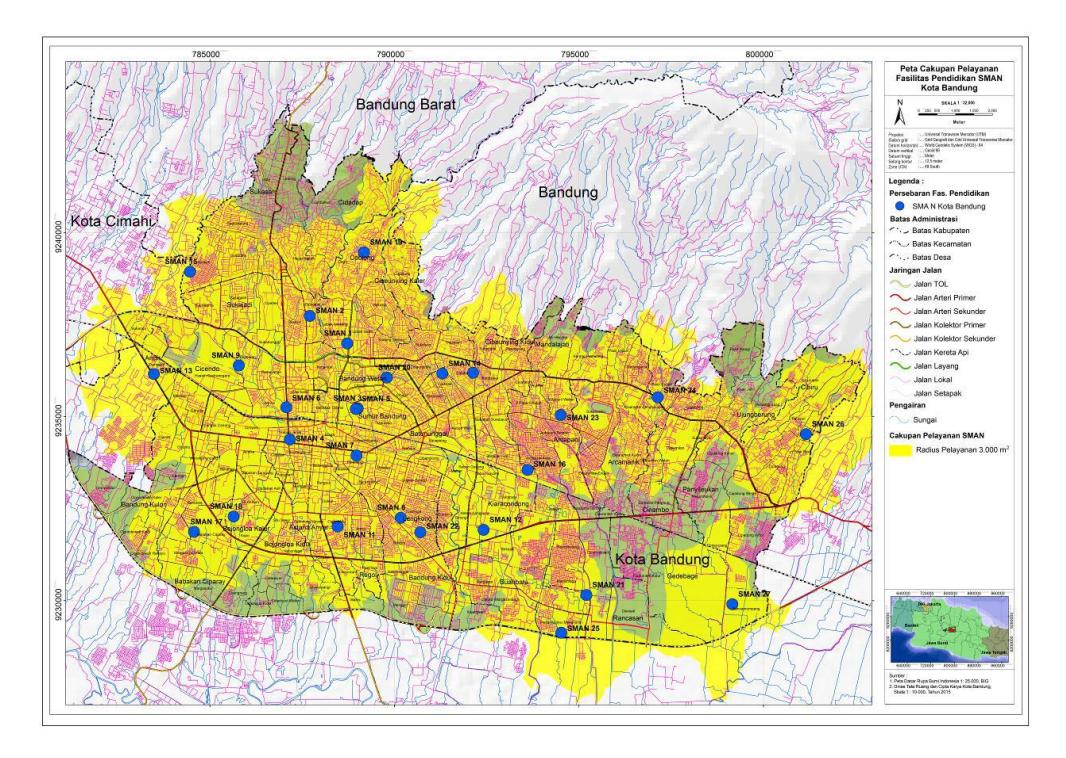
Figure 2. Map of State High School Service Coverage in Bandung. Source: Analysis, 2016
Based on these three variables, the distribution of state high school capacity in Bandung was obtained. This was done through spatial network analysis: a service coverage area was formed with a radius of 3000 m (SNI 03-1733-2004) for each state high school. The capacity of each state high school can be determined by taking into account the area and the population aged 15- 19 years within the coverage area. A coverage map with the 27 state high school facilities in Bandung is shown in Figure 2.
The total percentage of the Bandung area included in the coverage area that is served by state high school facilities is 79.25%, whereas the area outside the coverage area amounts to 20.75%. The total population aged 15-19 years that is served or not was obtained by multiplying the total population number at 15-19 years of age with the percentage of the coverage area. The result is that 169,538 people are within the coverage area of education facilities with a radius of 3000 m from school and 44,391 are outside the coverage area. However, the state high school capacity in Bandung is only sufficient to accommodate 30.751 students. Therefore, 138,787 sturents are not accommodated.
Identification of State High School Distribution Based on School Quality in Bandung City
The distribution of high school quality in Bandung was used as an input to see whether the PPDB policy with its clustering division can meet the need for qualified high school education facility equally in Bandung. The quality of each high school in Bandung was determined based on three variables: (1) the passing grade for each school; (2) the number and average grade of the final exam score (NEM); and (3) the accreditation score of all high schools in Bandung. The passing grade of each high school is the minimum grade required to enroll in the school based on the total grade of the national examination. The total and average NEM are equal to the total and average national examination grade of each high school in Bandung, whereas the accreditation score of all high schools in Bandung is based on data from the Ministry of Education and Culture as a benchmark of school quality from the side of education as a whole. The following is an elaboration of the quality of each state high school in Bandung viewed from the three variables for the academic year 2015/2016. The variables of high school quality were obtained from a calculation with parameter weighting by ranking, which produced the quality level of each state high school (Table 2).
Table 2. Quality Levels of State High Schools in Bandung
| Order/Level | Interval | State High School | |
|---|---|---|---|
| I | 4,00 – 3,66 | SMAN 2, SMAN 3, SMAN 4, SMAN 5, | |
| SMAN 8 | |||
| II | 3,65 – 3,26 | SMAN 14, SMAN 24 | |
| III | 3,25 – 2,86 | SMAN 1, SMAN 11 | |
| IV | 2,85 – 2,46 | SMAN 6, SMAN 7, SMAN 9, SMAN 10, | |
| SMAN 12, SMAN 15, SMAN 20, SMAN | |||
| 22, SMAN 25 | |||
| V | 2,45 – 2,06 | SMAN 13, SMAN 16, SMAN 17, SMAN | |
| 18, SMA 19, SMAN 23 | |||
| VI | 2,05 – 1,66 | SMAN 21, SMAN 26, SMAN 27 | |
Source: Analysis, 2016
The distribution of high school quality in Bandung can be represented in a distribution map based on quality level possessed by each high school (Figure 3).
Based on the quality distribution map above, the majority of high schools with a relatively high quality level are located in the center of Bandung. State High School 2 serves clustering area A, B, C, and F; State High School 3 and 5 serve clustering region A through F; and State High School 4 is in the clustering region C, E, and F, whereas State High School 8 is a bit farther, i.e. in clustering regions C and D.
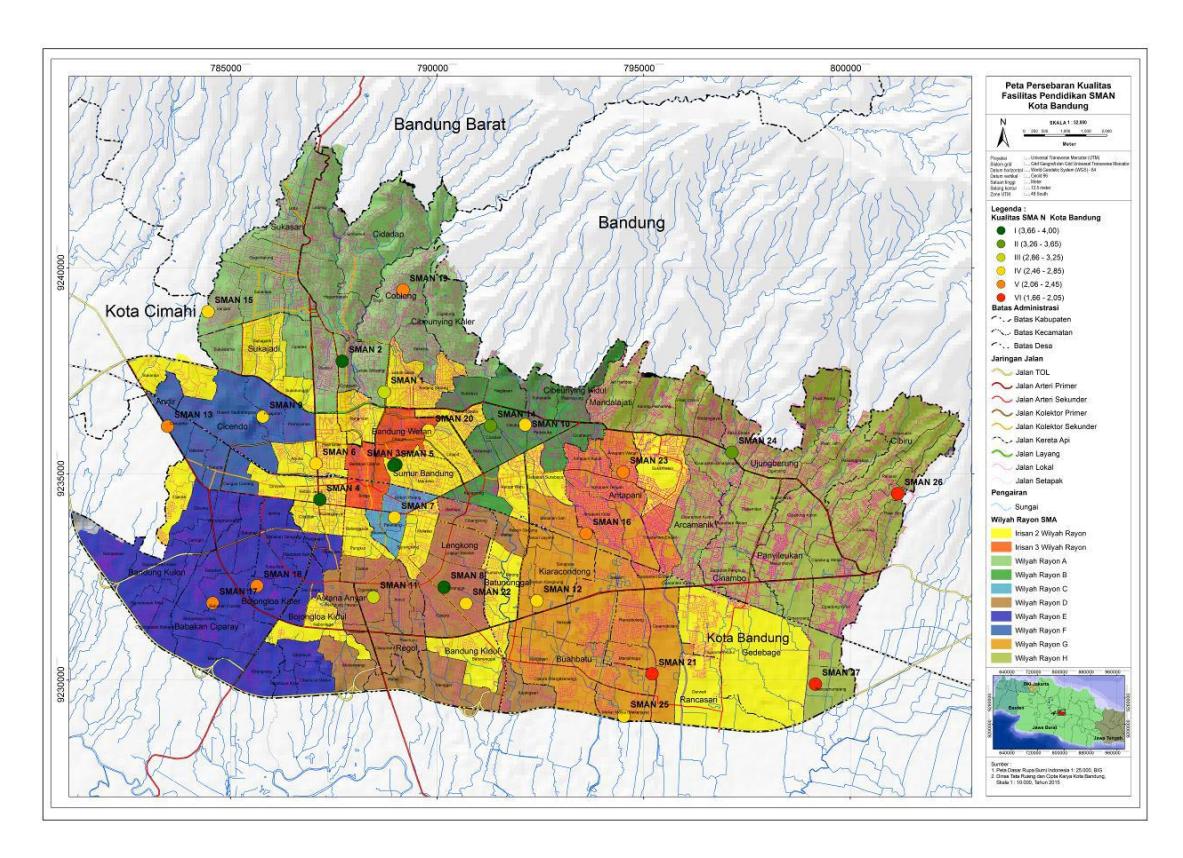
Figure 3. Quality Distribution Map of State High School in Bandung City. Source: Analysis, 2016
Meanwhile, high schools with a lower quality level, i.e. State High Schools 21, 26 and 27, are located in fringe areas of Bandung City. High schools with a quality level above the three previously mentioned high schools are located in the northwestern part of Bandung, i.e. State High Schools 17, 18 and 13. In addition, State High School 19, with the same quality level, is in the northern part of Bandung.
Identification of the Effectiveness of Clustering Policy in Bandung City
The effectiveness of Bandung's school clustering policy was determined based on its first objective, i.e. to provide equal opportunities to the school age population of Bandung to obtain a qualified education. Firstly, the effectiveness of the clustering policy was identified based on how it meets the goal of offering equal opportunities to obtain a qualified education, specifically at high school level, through the distribution of high school capacity in each cluster based on its coverage. Secondly, the effectiveness of the clustering policy was identified from how it meets the goal of offering equal opportunities to obtain a qualified education through the distribution of high school quality in Bandung.
a. Identification of Policy Effectiveness from the Capacity Side
The clustering of PPDB at high school level has some advantages, i.e. it is easy to monitor administratively, it provides regional incentives, the selection process occurs in 2 stages, and there is freedom in selecting a school. Not considered in this research is the assessment of accessibility through network analysis. The high school capacity to serve the school age population effectuated by the PPDB system is different from the one used in this research. The method offered by Bandung City's PPDB uses a minimum service radius to obtain regional incentive of 2.000 m, whereas the method offered in this research uses a service radius of 3.000 m through the network analysis method, taking into account the availability of a road network to access the facility.
The network analysis method has advantages and disadvantages. The advantages are in knowing the number of the population served and not served within the radius of the high school facility as stipulated by SNI. Potential locations can be found where to add high school facilities to cover areas not yet covered. However, a disadvantage of the network analysis method in assessing service coverage and equalization is by not implementing a method comparable to that used in PPDB, i.e. a quota system and the freedom to choose a school.
Therefore both methods can complement each other so that in the future the PPDB regulation can widen its scope of service or grant the regional incentive not only within a radius of 2.000 m but within 3.000 m according to SNI 03-1733-2004. In addition, the methods can regulate how to accommodate a shortage in student capacity from the results obtained in this research for each state high school education facility when extending the regional incentive radius to 3.000 m.
b. Identification of Policy Effectiveness from the Quality Side
Bandung City's PPDB policy tends to be incapable of overcoming inequality in high school quality although there are incentives for candidate students to select a school in their own district for the sake of equality. The attachment of the Mayoral Decree mentions information on the distribution of state high school quality in Bandung City as indicated by the accreditation score of each state high school in Bandung. It states that all state high schools in Bandung have grade A accreditation, or Very Good, which is different from data obtained from the Ministry of Education and Culture. The Mayoral Decree regulating PPDB is assumed to use a high school quality distribution that is equal for all facilities. However, the PPDB regulation only uses accreditation score data in determining the quality of state high schools in Bandung City.
This research used additional data compared to the PPDB regulation, i.e. average national examination grade, school passing grade, and accreditation grade, in an effort to obtain a deeper understanding of the current conditions. The accreditation data used in this research come from the Ministry of Education and Culture. The analysis revealed that the distribution of state high school quality in Bandung is different from the quality distribution according to Mayoral Decree No. 610 Year 2016. Highly qualified state high schools tend to be located in the center of Bandung while low quality high schools tend to be located in fringe areas.
From the point of view of each high school's quality, people tend to select the most qualified high school in Bandung as opposed to selecting a less qualified high school, even though it is located outside of their region. This is due to the flexibility of the PPDB's quota system of admission for students coming from outside of a region with qualifications that can enhance the quality of the school. In the end, students who can potentially increase the school's quality will be accepted in any qualified school while the less qualified schools do not receive much help in improving their quality.
Conclusion
The policy of high school clustering for Bandung City is stipulated in Mayoral Decree No. 610 Year 2016. Overall, this policy regulates the procedure of new student admission with a regional, distance-based system, specifically for new high school students. The regional system is implemented by a division of high school regions based on clustering as stated in the attachment of Mayoral Decree No. 610 Year 2016. Candidate students can choose 2 schools within or outside their own region but there is an incentive for candidates to choose a high school within their own region in the form of administrative conveniency at the registration stage. The distance between the residence of the candidate and the selected high schools is one of the evaluation components in the admission procedure of the candidate students.
In addition to providing an incentive for candidate students to select a high school in their own region, the policy also uses high school quota as a consideration. As for the quality aspect, it uses the accreditation score of each high school in Bandung as a consideration in order to equalize the accessibility toward qualified education facilities, particularly at the high school level.
From the comparison of high school capacity and quality in Bandung, the clustering policy does not consider both aspects comprehensively. As for the capacity aspect, it sufficiently considers distance in locating schools but does not consider accessibility. As for the quality aspect, the policy considers high school accreditation, which tends to be homogeneous, but does not considered other factors such as the passing grade or the average score on the national examination of each high school. As a consequence, achieving the objective of equalization of accessibility toward high school education facilities tends to be ineffective.