
Introduction
An increase in the population number and economic activities a region affects the level of its development marked by higher availability of public facilities. The availability of public facilities such as education, health, economic, social facilities and also their accessibility supports human activities, including the economic sector (Rustiadi et al., 2011). A region with a high index of public facility availability can become a node of regional development supported by surrounding regions with a lower index (Rustiadi et al., 2011) and grow more rapidly than the others which affect social welfare (Dawkins, 2003) and is also a driving force in converting agriculture land in the surrounding regions (Munibah et al., 2013). Regional accessibility also has a statistically significant effect on the spatial distribution of activity space, total distance traveled and housing prices (Cerda and El-Geneidy, 2009). Knowing the spatial distribution of public facility availability is very useful in regional planning.
Indonesia is known as one of the predominantly agrarian countries in the world. Cianjur Regency is a centre of rice production located in West Java. Cianjur Regency is divided into three development regions i.e. the northern part, the middle part and the southern part (Cianjur Regency, 2014). The northern part is dominated by plains that are traversed by main road connecting two big cities, namely Bogor and Bandung. This part is the center of business activities in Cianjur Regency. Most of the irrigated paddy fields are found in the northern part too which can easily be converted. The middle and southern part are dominated by hilly and coastal landforms with poor accessibity. This situation affects the availability of public facilities and economic activities in these two areas.
Based on this overall situation, this study analyzed public facility availability in Cianjur Regency using a spatial autocorrelation on public facility availability with neighborhood weight difference or variation of spatial weighted matrix (W). The objectives of this research were (1) to analyze the global spatial autocorrelation based on the Moran's index with variation of spatial weighted matrix (wij); and (2) to analyze the local spatial autocorrelation based on LISA index with variation of spatial weighted matix (wij). The analysis was firstly done by exploring data through thematic map and was then continued with spatial autocorrelation analysis using the Moran's index and the LISA index.
This paper is devided into six parts. The first part contains an introduction to the discourse on the correlation between public facility availability and regional development. The second part contains a theoritical review of Low of Geography I as the basic theory used. The third part explains the data set and the methodology used in this study. The fourth part presents the public facility availability index, the number of neighbors, the global (Moran's index) and local (LISA index) spatial autocorrelation using three matrics, namely nearest neighbor, neighbor boundary length and neighbor distance. The fifth part contains the synthesis of the global and local spatial autocorrelation results. The final part is the conclution of this study.
Theoritical Review
Public facilities are defined as basic services can not be supplied directly to the individual residential dwelling units and as a result are utilized away from individual residential dwelling units within a public environment (Minister of Housing, South African, 2005). Example of public facilities are education, health, economic and social facilities. Completeness of public facilities in a region indicates better performance in terms of public services and regional development. Public facilities serve different purposes, therefore the location of a public facility
depends on the specific function it performs (Ministry of Housing, South Africa, 2005). The best location for public facilities is affected by the physical, social, economic and road infrastructure conditions of a region (Ricky et al., 2017). In general, the development of a region will be a driver for its neighboring regions to undertake development in their own territory. Therefore proximity is an important factor.
According to Law of Geography I proposed by Tobler (1970) everything is related to everything else, but near things are more related than distant things. One of the available methods to apply Tobler's concept is spatial autocorrelation. Spatial autocorrelation is the correlation between observed areas in the form of spatial patterns (distance and time) (Prasetyo et al., 2012, Tsai and Peng, 2011). There are two types od spatial autocorrelation, namely global and local spatial autocorrelation. Global autocorrelation analysis such as Moran's I produces only one single value which is the sum of all spatially referenced inter relationship (Wulder and Boots, 2001) or only captures the most dominant dependency (Zhang and Lin, 2007). However, such analysis may hide local autocorrelation information, i.e. the spatial relationship between the center and its neighbors (Wulder and Boots, 2001; Kumar et al., 2012). The most often used and cited local autocorrelation methods are the local Moran index and the local indicator of spasial association (LISA) as proposed by Anselin (1995). Local autocorrelation analysis helps to recognize spatial outliers and local clusters (Kumar, 2012). Therefore, in this study, both global and local autocorrelation were used by applying the Moran's I approach and the LISA approach, respectively.
Global or local spatial autocorrelation is based on a statistical analysis that integrates a spatial weighted matrix (wij) into an autocorrelation equation. The spatial weighted matrix (wij) is a precondion for the exploration of spatial data (Kumar et al., 2012). The different values of the spatial weighted matrix (wij) used by the Moran index and Lisa index depend on different concepts of nearest and relationship degree between areal units (O'Sullivan and Unwin, 2002), such as nearest neighbor, neighbor boundary length and neighbor distance. Nearest neighbor is used most often, where wij = 1 if regions i and j area neighbors, otherwise wij= 0. A comparation of three spatial weighted matrix variation applied in global and local spatial autocorrelation analysis presented in this paper. Global and local autocorrelation analysis have been used for identification of patterns and levels od spatial clustering (Tsai and Peng, 2011) in many objects, such as unemployment (Wuryandari et al., 2014), dengue fever (Yasin and Saputro, 2013), data mining (Kumar et al., 2012), leading malignant neoplasma (Tsai and Peng, 2011) and immigrant minorities (Martori et al., 2005).
Spatial autocorrelation reffers to the obvious fact that data from locations that are close to each other are more likely to be similar than data from locations that are far removed from each other (O'Sullivan and Unwin, 2002). Measurement of all spatially referenced inter-relationships (global spatial autocorrelation) can be done using Moran's I approach, whereas measuring between the center location and its nearest neighbor location (local autocorrelation) can be done using the LISA approach. Local spatial autocorrelation can provide indications of local factors of its nearest neighbor location, such as topograhy, population, education and others.
The calculation of global or local autocorrelation involves spatial weights that can have many metrics, including nearest neighbor, neighbor boundary length and neighbor distance (O'Sullivan and Unwin, 2002). Therefore, it is necessary to look into the influence of these three spatial weight matrics in global and local autocorrelation.
Material and Method
Study Area
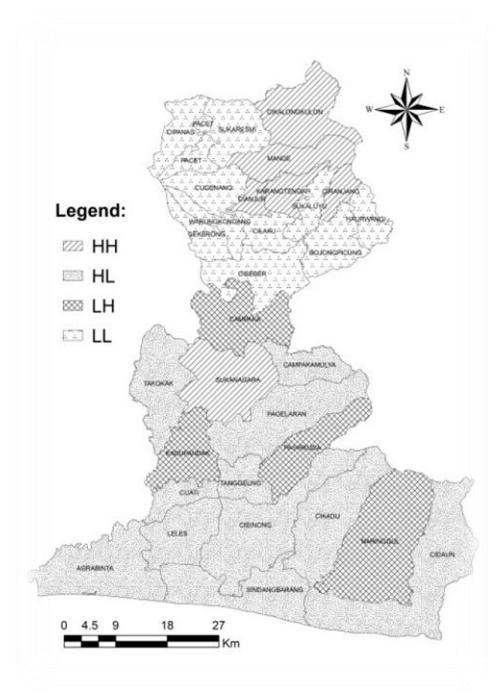
The study area (Figure 1) is Cianjur Regency, West Java, Indonesia and has coordinates 06° 21'- 07° 25' S and 106° 42'-107° 25' E. The total area cover 361 435 ha and comprises of 32 districts. The capital is located in Cianjur District.

Figure1. Location of study area
The topography found in Cianjur Regency ranges from lowlands to uplands. Lowlands can be found in the southern coastal area, hilly areas are in the central part and the northern. Meanwhile, uplands can be found around the Gede Volcano in north and structural mountains in the south. The elevations found in Cianjur Regency range from 0 m to around 300 m above sea level with slope ranging from flat to very steep (>40%). These physical conditions affect the availability of public facilities, the spread of the population number and economic activities. Most of the districts in the lowland like Cianjur District have complete public fasilities for supporting human activities. This phenomenon which affect to the regional development level.
Calculation of Index of Public Facility Availability
The data used in this research are administration map with scale 1:50.000 and variables for calculating the index of public facility availability sourced from the Central Bureau of Statistics (2014) as presented in Table 1 (Munibah et al., 2015). The index of public facility availability for district was calculated based on schallogram approach (Rustiadi et al., 2009) and then presented mathematic simbol (Equation 1).
Group No. Types of Public Facilities Education 1 Number of play groups (units) facilities 2 Number of elementary schools (units) 3 Number of junior high schools (units) 4 Number of high schools (units) 5 Health Number of health centers (units) facilities 6 Number of doctors (persons) 7 Number of nurses (persons) 8 Number of big industries (> 99 employees) Economic facilities 9 Number of moderate industries (20-99 employees) 10 Number of small industries (<20 employees) 11 Number of cooperations (units) Number of hotels (units) 12 Social 13 Numer of population (persons) Facilities Number of mosques (units) 14 Number of churches (units) 15 Accessibility 16 Area of sub-regency (ha) Total length of provincial roads (m) 17
Table 1. Variables for calculation of public facility availability index
\[IF_{i} = \sum_{j} \frac{(b_{ij} - min_{j})}{std_{j}}\] (1)
Toak lenght of regencial roads (m)
Total lenght of rural roads (m)
where
\[b_{ij} = \frac{c_{ij}}{r_j}; \ C_{ij} = \frac{f_{ij}}{p_i}; \ r_j = \frac{n_j}{N}\]
\(IF_i\) is index of public facility availability index for district i, \(b_{ij}\) is the ratio between \(C_{ij}\) and \(r_{ij}\), \(C_{ij}\) is the ratio between the total value of public facility availability j in district i (\(f_{ij}\)) and the total population in district i (\(p_i\)), \(r_j\) is the ratio between the number of districts where the value of public facility availability j > 0 and the number of observed districts (N = 32 districts), min<sub>j</sub> is the minimum value of public facility availability j, \(std_j\) is the standard deviation of the value of public facility availability j, i is the name of the district, j is the type of public facility (19 types).
If the public facility availability index in a district is high, it means that the district has a good publics service because of balance between the number of public facilities and population number.
Calculation of Global Spatial Autocorrelation
The global spatial autocorrelation was calculated to know the spatial distribution of the public facility availability index with the districts as mapping units. Calculation of the spatial
autocorrelation was done using Moran's I approach with the following equation as used by O'Sullivan and Unwin (2002) and Tsai et al. (2011).
\[I = \frac{n}{\sum_{i=1}^{n} (y_i - \overline{y})^2} \frac{\sum_{i=1}^{n} \sum_{j=1}^{n} w_{ij} (y_i - \overline{y})(y_j - \overline{y})}{\sum_{i=1}^{n} \sum_{j=1}^{n} w_{ij}}\](2)
where:
n is the total number of observed districts; wij is the spatial weighted matrix, yi is the value for observed district i, ȳ is the mean of all observed values, yj is the value for observed neighbors.
The spatial weighted matrix (wij) can be calculated based on different neighborhood weights. The values of the spatial weighted matrix (wij) were calculated based on three neighborhood (Figure 2), i.e.:
a. Nearest neighbor where wij = 1 if i and j are nearest to each other; otherwise wij = 0.
- b. Neighbor boundary length where \(w_{ij}\) = ratio between the length of boundary line i and j (\(l_{ij}\)) and the perimeter of i (\(l_i\)).
- c. Neighbor distance where \(w_{ij} = 1\) divided by the distance between i and j.
The Moran's index values is can range from -1 to +1 where a value of -1 represents uniform data spread; a value of 0 represents random data or independent data spread and a value of +1 represents data clustering or dependent data spread (Chen et al., 2015, Prasetyo et al., 2012, Tsai and Perng, 2011).
The Moran's index is supported by significance tests, where a significance level of 5%, indicates that the public facility availability index (IF<sub>i</sub>) of a region is similar to that of its neighbors. The formula for the significance test is as follow (Wuryandari et al. 2014):
i. Hypothesis \(H_0\): there is no spatial autocorrelation \(H_1\): there is spatial autocorrelation
ii. Significance level (\(\alpha\)) = 5%
iii. Statistical test \[Z(I) = \frac{I - E(I)}{\sqrt{var}(I)}\] (3)
Where:
\[E(I) = \frac{1}{n-1} \qquad Var(I) = \frac{n^2 S_1 - n S^2 + 3S_0^2}{(n^2 - 1) S_0} - [E(I)]^2\] \[S_0 = \sum_{i=1}^n \sum_{j=1}^n w_{ij}; \qquad S_1 = \frac{1}{2} \sum_{i=1}^n \sum_{j=1}^n (w_{ij} + w_{ji})^2; \quad S_2 = \sum_{i=1}^n \left[ \sum_{j=1}^n w_{ij} + \sum_{j=1}^n w_{ji} \right]^2\]
If value of \(Z(I) > Z_{I-\alpha}\) then \(H_0\) is rejected and \(H_1\) is accepted. It means that there is spatial autocorrelatian and vice versa.
Calculation of Local Spatial Autocorrelation
Local spatial autocorrelation for each location (district) was calculated based on the LISA approach. The local LISA value is computed with the following equation (Oliveau and Guilmoto 2004):
\[I_{i} = \frac{y_{i} - \overline{y}}{std} \sum_{j} w_{ij} \frac{y_{j} - \overline{y}}{std}\] \[\tag{4}\] where:
Ii is the LISA index, \(y_i\) is the value for observed district i, \(\bar{y}\) is the mean of all observed values, \(y_j\) is the values for observed neighbor j, \(w_{ij}\) is spatial weighted matrix, std is the standard deviation of observed values.
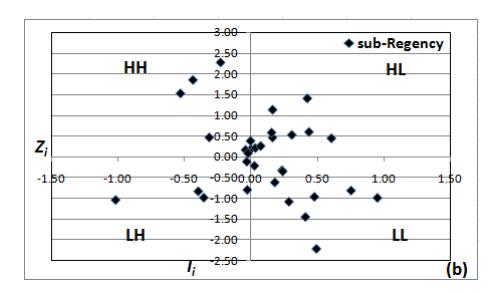
The LISA index is a value that shows the spatial relationship between each district and its neighbors. The Moran scatter plot can be divided into 4 quadrants with Ii (LISA index) as the x axis and \(Z_i\) as the y axis. The quadrants represent high value surrounded by low value (HL), low value surrounded by low value (LL), low value surrounded by high value (LH) and high value surrounded by high value (HH)
Results and Discussion
Public Facility Availability Index
The public facility availability index (Table 2) was calculated based on Equation (1) using 19 variables (Tabel 1). The higher district's public facility availability index, the better it is in supporting human activities. In this case, the districts of Sukanegara, Cijati and Cianjur are the top three with an public facility availability index > 30. Cianjur District is the center of economic activities and also regency capital but its index value is lower than that of Sukanegara and Cijati. This is because the ratio between public facility availability and popolation number in Cianjur District is lower that those of Sukanegara and Cijati District. The public facility availability and population number of the other districts varies, so that the varying index was obtained with the minimum, average and maximum at 10.47, 22.20 and 34.30 respectively.
Table 2. Index of public facility availability
| Code | District | Index of public facility availability | Code | District | Index of public facility availability |
|---|---|---|---|---|---|
| 250 | Bojongpicung (North) | 16.50 | 110 | Campaka (Center) | 17.02 |
| 200 | Cianjur | 30.34 | 260 | Campakamulya | 25.33 |
| 120 | Cibeber | 20.51 | 070 | Kadupandak | 16.72 |
| 240 | Cikalongkulon | 22.69 | 100 | Pagelaran | 23.62 |
| 140 | Cilaku | 21.09 | 430 | Pasirkuda | 17.83 |
| 410 | Cipanas | 20.37 | 080 | Takokak | 24.69 |
| 170 | Ciranjang | 24.71 | 060 | Tanggeung | 23.36 |
| 210 | Cugenang | 14.55 | 090 | Sukanagara | 34.30 |
| 400 | Gekbrong | 17.12 | 010 | Agrabinta (South) | 28.25 |
| 420 | Haurwangi | 18.97 | 050 | Cibinong | 29.70 |
| 190 | Karangtengah | 24.27 | 030 | Cidaun | 23.23 |
| 180 | Mande | 23.12 | 290 | Cijati | 32.07 |
| 150 | Sukaluyu | 18.02 | 170 | Cikadu | 25.04 |
| 220 | Pacet | 17.92 | 040 | Naringgul | 21.62 |
| 230 | Sukaresmi | 10.47 | 280 | Leles | 24.60 |
| 130 | Warungkondang | 16.99 | 020 | Sindangbarang | 25.42 |
| Minimum | 10.47 | Mean | 22.20 | ||
| Maximum | 34.30 | Std. Deviation | 5.30 |
The public facility availability index can be used as an indicator of regional development. The growing body of infrastructural development thoroughly changes the landscape of a city (Qureshi 2010).
Number of Neighbors and Value of Spatial Weighted Matrix
A map was used to determine the relationship between the central district and its neigborhood. Cianjur Regency has 32 districts so the size of the spatial weighted matrix was 32x32. In this case, Mande Destrict has 7 neighbors (highest) while Cibeber, Cilaku, Sukaluyu have 6 neighbors and the remaining districts have 2 to 5 neighbors.
The spatial weighted matrix (wij) was calculated based on three matrics of neighborhood weight, i.e.nearest neighbor, neighbor boundary length and neighbor distance. The value of wij for each district with different of neighborhood weights are presented in Table 3.
| Value of wij calculated based on | ||||
|---|---|---|---|---|
| Parameters | Nearest Neighbor neighbor boundary length | Neighbor distance | ||
| Minimum | 2 | 0.25 | 0.0001 | |
| Maximum | 7 | 1.08 | 0.0009 | |
| Average | 4 | 0.78 | 0.0004 | |
| Standard dev. | 1.4 | 0.22 | 0.0002 | |
| Correlation | 1.00 | 0.69 | 0.73 | |
| (number of | ||||
| neighbors & wij) | ||||
Table 3. Values of wij for different for neighborhood weights
The wij values calculated based on nearest neighbor affected by the number of neighbors only. This is showed by correlation value equal to 1. The wij values calculated based on neighbor boundary length are affected by the number of neighbors, the polygon shape and shared boundary length. The wij values calculated based on neighbor distance are affected by the number of neighbors and the polygon shape. The more factors affecting the value of wij, the smaller the correlation between the number of neighbors with values wij.
Besides that, the different neighborhood weights can also affect the statistical value of wij for each district. The highest and lowest wij values based on the nearest neighbor are those of Mande and Sukaresmi, respectively, based on neighbor boundary length, they are those of Cilaku and Agrabinta, respectively, while based on neighbor distance, they are Sukaluyu and Cidaun, respectively.
Global Spatial Autocorrelation
One of the advantages of global spatial autocorrelation using Moran's index can detect the spatial distribution pattern of public facility availability, i.e. whether it is clustered, dispersed, or random (Chen et al, 2015). This research used three of neighborhood weights, i.e. nearest neighbor, neighbor boundary length and neighbor distance, the result is presented in Table 4.
The Moran's index of public facility availability values by nearest neighbor, neighbor boundary length and neighbor distance did not differ significantly, they are 0.30, 0.22 and 0.33 respectively. These results supported by the statistical test, where all Z(I) values, i.e. 2.299, 2.258 and 2.293 were larger than Z1- α (1,645). This means that H0 is rejected and H1 is accepted, which shows the presence of spatial autocorrelation. This indicates that there is an autocorrelation between the public facility availability in a district and that of its neighboring districts, albeit weak. Research results that support the above result are Moran's index on Bush votes in USA = 0.41 which indicates a fairly strong positive correlation (O'Sullivan and Unwin, 2002). The Moran's index on unemployment in Semarang regency, Central Java is 0.0614 which indicates a positive spatial autocorrelation but a very small correlation (Wuryandari et al., 2014).
| Parameters | Nearest neighbor | Neighbor boundary length | Neighbor distance |
|---|---|---|---|
| Moran index | 0.30 | 0.22 | 0.33 |
| Z(I) calculation | 2.299 | 2.258 | 2.293 |
| Z(I) table | 1.645 | 1.645 | 1.645 |
| Spatial pattern | cluster | cluster | cluster |
Table 4. Moran's index and statistical test
Local Spatial Autocorrelation
Local spatial autocorrelation was calculated using the LISA index equation (Equation 4) applied to three matrics of neighborhood weight, namely nearest neighbor, neighbor boundary length and neighbor distance. The results are presented as a scatter plot, see Figure 3, 4 and 5. The scatter plot shows that only three districts had the different results, namely Karang Tengah, Sukaluyu and Cijati Districts (Table 5) and the others (39 distritcts) had the same result. This is caused by one of the neighbors having public facility availability are smaller than the average public facility availability of Cianjur Regency and it also depends on the value of wij.
| Four quadrants | Neighbor |
| of LISA index | adjacent |
| НН | 15.63 |
| HL | 37.50 |
| LH | 12.50 |
| LL | 34.38 |
| Total | 100.00 |
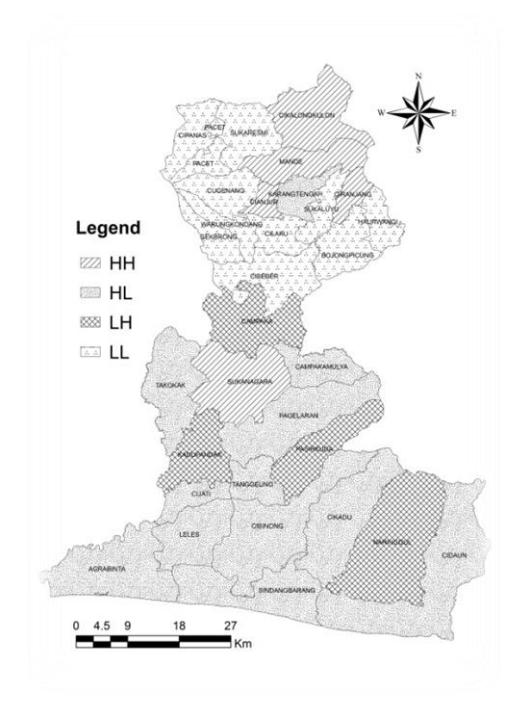
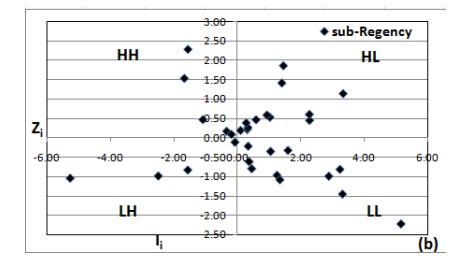
Figure 3. Scatter plot of LISA index on nearest neighbor shown in a map (a) and by quadrants (b).
| Neighbor | |
| ngth | |
| 18.75 | |
| 34.38 | |
| 15.63 | |
| 31.25 | |
| 00.00 | |
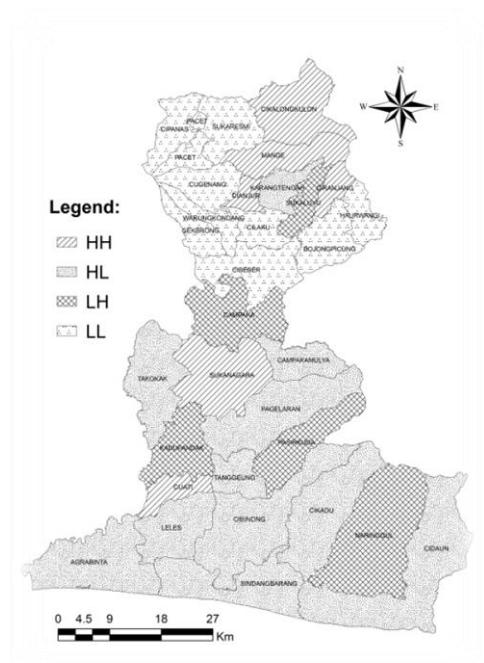
Figure 4. Scatter plot of LISA index on neighbor boundary length shown in a map (a) and by quadrants (b).
| Four quadrants | Neighbor | |
| of LISA index | distance | |
| HH | 18.75 | |
| HL | 34.38 | |
| LH | 12.50 | |
| LL | 34.38 | |
| Total | 100.00 | |
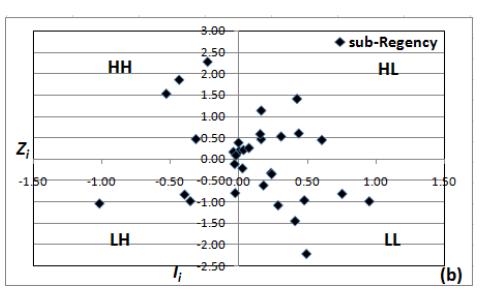
Figure 5. Scatter plot of LISA index on neighbor distance shown in a map (a) and by quadrants (b).
The result of the local spatial autocorrelation analysis on the three matrics of neighborhood weight shows that clustering occurred in northern Cianjur which is in the HH category and in central-southern Cianjur which is in the LL category. The HL category formed a small cluster in northern Cianjur, whereas LH in central-southern Cianjur did not form clustering but spread (Figure 3,4,5). The quadrants of the scatter plot are (Zhukov, 2010):
- 1. HH (high-high) which refers to a district with high availability of public facilities surrounded by districts with a high value.
- 2. HL (high-low) which refers to a district with high availability of public facilities surrounded by districts with a low value.
- 3. LL (low-low) which refers to a district with low availability of public facilities surrounded by districts with a low value.
- 4. LH (low-high) which refers to a district with low availability of public facilities surrounded by districts with a high value.
Table 5. Three districts with different results for different spatial weighted matrix
| Code | District | Nearest neighbor | Neighbor boundary length | Neighbor distance |
|---|---|---|---|---|
| 190 | Karangtengah | HL | HL | HH |
| 150 | Sukaluyu | LL | LH | LL |
| 290 | Cijati | HL | HH | HL |
Syntesis of Global and Local Spatial Autocorrelation Results
The spatial pattern of public facility availability in Cianjur Regency is cluster as indicated by the positive autocorrelation. However, the global spatial autocorrelation value (Moran index) is defferent, i.e. 0.30, 0.22 and 0.33 for nearest neighbor, neighbor boundary length and neighbor distance, respectively (Table 4). This result was supported by the local spatial autocorrelation analysis which indicates that clustering occurred in northern Cianjur which in the HH category, and in central-southern Cianjur which is in the LL category.The HL category forms a small cluster in northern Cianjur while LH in central-southern Cianjur forms a spread (Figure 3,4,5). This phenomenon occurs in the global as well as the local spatial autocorrelation using three matrics of neighborhood weight, namely nearest neighbor, neighbor boundary length and neighbor distance.
The HH cluster formed in northern Cianjur as it is a region with a high population number and economic activities centered in Cianjur District. Beside that, a new urban center is planned in the Cipanas District (RTRW Cianjur Regency). This area is dominated by flat to sloping land and is traversed by the provincial road connecting Bandung Regency and Bogor Regency, so the area has potential for development. Therefore, the availability of public facilities is high but not sufficient to serve the high population number and economic activities, so the average value of public facilities availability index (19.85) is lower than that of the other districts in central Cianjur (22.86) and southern Cianjur (26.24).
The LL clusters formed in central and southern of Cianjur because the area is hilly to mountainous so it has low accessibility. Central Cianjur is planned as a rural development area based on agricultural land centered in Sukanegara District (RTRW Cianjur Regency). Rural areas are identical to agriculture areas (Widodo 2017). The availability of public facilities are still low but sufficient to serve the low population number. Southern Cianjur is planned to be a new urban development area centered in the Sindangbarang District. Road infrastructure will be built to connect southern Cianjur with Bandung Regency and Sukabumi Regency (RTRW Cianjur Regency). In current condition, the availability of public facilities is still low but more than enough to serve the low population number. This condition causes the average public facility availability index to be higher than that of northern Cianjur.
Conclusions
Based on global spatial autocorrelation (Moran's I) analysis that using three matrics of spatial weighted matrix, namely nearest neighbors, neighbors boundary length and neighbors distance give slightly different results 0.3, 0.22 and 0.33 respectively, but yielded the same spatial pattern (clusters). Based on the local autocorrelation (LISA) analysis using the three matrics of spatial weighted matrix were obtained that 97% of districts have the same scatter plot and only 3% have a different scatter plot namely Karangtengah, Sukaluyu and Cijati Districts. The spatial pattern of public facility availability in Cianjur Regency is cluster as indicated by the positive autocorrelation with the HH cluster found in northern Cianjur and the LL cluster in central Cianjur and southern Cianjur.
The northern part of Cianjur Regency which is surrounded by Bogor and Bandung has a high public facility availability index, which can be an indication that surrounding regions contribute to a higher public facility availability index in Cianjur Regency rather than in its own region. Moreover, southern part of Cianjur Regency which is characterized by hilly and mountainous land has a low public facility availability index. These results supported by the Low of Geography I proposed by Tobler (1970) consideration future development planning of Cianjur Regency to support human activities as well as the economic sector.
Acknowledgements
We are grateful for the research funding provided by the Ministry of Higher Education, Research and Technology in coorperation with Bogor Agricultural University.