
Introduction
The primary purpose of regional development planning is deciding on the general distribution of new activities and developments (Glasson & Marshall, 2007). Regions should be connected to each other in order to be able to interact with each other and share the flows of goods and services. Connectivity can be simply defined as the ease with which people, materials, and information can be moved from one location to another (Sokol, 2009). Connectivity is one of the most important aspects of facilitating inter-regional interaction. Through connectivity, connections between people, goods, and regions are encouraged and more and more connections are produced (Staeheli, 2012). Regarding the measurement of connectivity, connectivity has a close relationship with the network concept. According to Sokol (2009), there are two basic ways to measure connectivity in a network: (1) the higher the number of links to nodes, the higher the degree of connectivity in a given network; and (2) the more direct links a particular node has, the higher its centrality inside the network. Sokol also remarks that improvement of connectivity therefore can often be seen as an indicator of development; a better interaction and connectivity between areas can improve the development within those areas.
The application of network analysis to a city or region is based on the adaptation of social network analysis, which was first developed in 1950s. It was further developed in other disciplines, including urban studies, where urban professionals began to conceive the city analytically rather than holistically by disaggregating it into a series of systems. In the contemporary version of this 'perspective', the city has been turned into a network: the urban network. Drewe (in Albrechts & Mandelbaum, 2005) argues that today's architects and urban designers neglect the vast flows of the networked world and the paradigmatic challenge of the concept of networks developed by other innovators concerning spatial planning. They still are influenced by zonal thinking and do not see the infrastructure of cities within their domain. A city area can consist of several infrastructure networks. Therefore, the city can be formed asa series of networks that influence each other, not limited by administration boundaries or zonings. Urban studies continue to evolve this concept towards an interconnected city system.
Seen from the normative framework of spatial plan policies in Indonesia, according to Spatial Plan Law 2007, there are at least two types of plans that must be prepared in a regional development plan, namely a general plan and a detailed plan. The general plan is divided into a spatial pattern plan and a spatial structure plan, while the detailed plan comprises the determination of strategic areas. As the translation of Spatial Plan Law (2007), the National Spatial Plan of Indonesia (2008) provides some understanding of spatial patterns and structures. A spatial pattern plan is based more on information about the distribution of functions and allocation of spaces for specific purposes, such as settlements, trade, tourism, etc., while aspatial structure plan is based more on the composition or hierarchical structure of systems and networks that support the socio-economic activities of a community, such as electricity grid, roads, fresh water, etc. Seen from the normative framework of spatial planning products in Indonesia, there are mostly directives on the network 'structure' of areas, especially for infrastructure networks that support community activities.
Pontianak is a city in Kalimantan that has the mission to become a leading center for trade, services and tourism. Pontianak is the capital of West Kalimantan Province, Indonesia. It has an area of 108.82 square kilometers and a population of 598,097 people (2014). In contributing to its mission to become a city that supports the development of trade, services and tourism, Pontianak continues to make improvements through physical development. In sodoing, the physical arrangement and development of Pontianak are guided by the Local Regulation of
Pontianak City No. 2 of 2013 on Pontianak City Spatial Planning 2013-2033. Through the spatial planning policies of Pontianak, the urbanspace of Pontianak is managed to promote the city as a leading trading and servicescenter in Kalimantan as well as its tourism industry. For this purpose, the government of Pontianak has formulated policies for equally developing and distributing trade and service centers around the city.
The trade and services areas and tourist attractions are divided into several types. Trade and services areas are: (1) traditional markets, (2) shopping centers, and (3) modern stores. Touristic areas are: cultural, natural, and special interest tourist attractions. The trade, services, and shopping areas or functions are distributed over several locations (Figure 1). Likewise, the tourist attractions in Pontianak are also distributed over several locations, as can be seen in the figure below.
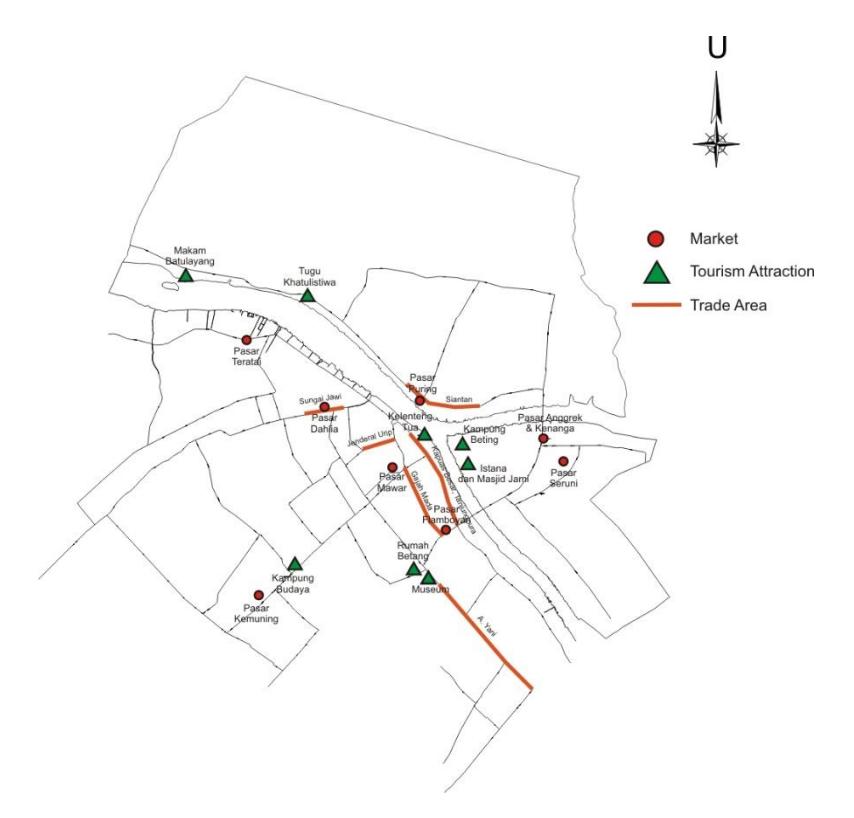
Figure 1. Market/Trade Areas and Tourist attractions Distribution in Pontianak City Source: Adopted from Pontianak City Local Regulation, 2013
Related to the above issues, the purpose of this study was to analyze the existing urban networks in Pontianak in support of the city development goal of becoming a leading trade, services, and tourism center based on its urban network. Here, this network may consist of various infrastructures, e.g. water supply, sewage disposal, housing, transportation, or telecommunication. Under the initial concept of a network, it should consist of two components, i.e. links and nodes. The connectivity between links and nodes may result in centrality or a lack of centrality inside the network. This study tried to analyze the different infrastructure networks as part of the urban network within the direction of the spatial plan of Pontianak City. The infrastructure networks were analyzed through an analysis of the main network components. The expected result of this study was the tendency (e.g. centrality) of the infrastructure networks in supporting trade and touristic area/sfunctions, as well as provide insight into the planning approach through urban network analysis.
Snapshot of Literature Review
The Trade and Tourism City
According to Berube and Parilla (2012), cities were already indispensable actors of global trade before the rise of the nation-state. Trade has become increasingly important to global and national economies; urbanization and the advancement of technology have enhanced the productivity, export potential, and local consuming within cities. According to Ades and Glaeser (1995), the rise of trade can make cities grow. In the case of London, the rise of trade was supported by lower transport costs, technology advancement, and government support. The development of trade incities is supported by the availability of enterprises and their innovation efforts (Simmie 2001). Continued by Simmie, trade cities (sometimes capital cities) benefit from their position in urban hierarchies. They are usually located at the center of a region and are capable of serving the surrounding areas and have high-frequency business networks.
Regarding tourism in cities, summarized by Maxim (2017), urban tourism is one of the earliest forms of tourism, where people are interested to visit cultural heritage sites. Cities then became the main gateways for tourists to explore destinations within a region, supported by urbanization, higher incomes and the development of airline technology and management. Continued by Maxim, a city offers a large of variety attractions, such as historic buildings, cityscapes, parks, events, food, and hotels. According to Sheng (2010), cities may capitalize on their inherent quality and specificattractions, such as historical heritage sites and special landscapes, and convenient location for shopping and entertainment. The advantages of cities to become a touristic destination are also supported by the competitive advantage of the availability of infrastructure and facilities (Valls et al., 2014). That way, the development of tourism within a city can also support the expansion of the city in terms of the physical environment (Ismail and Baum, 2006).
From the lens of the tourist experience, according to Edwards and Griffin (in Wearing and Foley, 2017), tourists enjoy walking around a city. A city also provides satisfying and fulfilling experiences, including feeling comfortable and relaxed, interactions, exploration, ultimately enabling the tourist to make a connection with the city. Summarized from Horita (2017), tourism in cities (in the case of Japan) can be categorized into four types based ontheir features, i.e.historical capital cities, regional major cities, prefectural center cities, and cities depending on tourist facilities. Summarized from Liszewski (in Kotus et al., 2015), there are several characteristics of urban tourism in modern cities thatone can distinguish, such as penetration space, assimilation space, exploration space, and urbanization space.
Regarding urban networks, according to Beaverstock et al. (2000), cities have always existed in environments with linkages supporting both material and information transfer. Cities have always acted as centers from where their hinterlands are serviced and connected to wider realms. Continued by Beaverstock et al., contemporary cities are the outcome of economic changes, supported by theirstrategic position and inter-city relationships, which has created location economies and synergy elements operating through horizontal and vertical linkages (Camagni in Lakshmanan and Nijkamp, 1993). From this idea, the possibility emerges of developing the analogy of a 'city network', where the city has a role as an interchange node
among a set of networks of physical and information interaction based on their complementary, synergetic, or innovative functions.
Urban Network Approach
An urban space may consist of several series of network systems, e.g. water supply, sewage disposal, housing, transportation, or telecommunications. As noted by Beauregard (in Albrechts & Mandelbaum, 2005), as such the city disaggregates. In the contemporary version of this 'perspective', the city has been turned into a network of systems that is linked externally to other cities/systems. Heydebrand (1999) mentions that there would be many distinct perceptions and stories about particular ties and interconnections between ties. In addition, as he adopted from White (1992), Heydebrand notes that the network metaphor results from efforts to gain control and 'getting fresh action'regarding relations. Furthermore, Heydebrand also describes three different types of networks in getting more understanding on the network metaphor: technical networks (telephone, internet), transactional networks (transportation, trade), and social or socio-technical networks. The urban network also refers to the patterns of relationships within and between urban settings. Providing a structure for social, economic, political and other activities can happen at the micro, messo and macro scales. The urban network can also be defined as emerging, functional, connected sets of urban centers at the regional level (Bertolini & Dijst, 2003). Urban networks interlink transport (linkages) and land use by creating a network of places connected by corridors that allow for the movement of goods and people or activity centers (Australian Planner Commission, 2005). For this purpose, a network (e.g. a transportation network) may support or can be combined with other components of planning such as land use to create better interaction (Tamin and Frazila, 1997). In urban network studies, according to Vlauten & Kaijser (2005), road and water links still constitute the main arteries for the exchange of people, goods, energy, and information. In addition, infrastructures or utilities play a key role in promoting increasingly polarized, fragmentary, and undemocratic cities, that aremanaged to serve the needs of the population (Marvin & Graham, 1993). Besides that, the integration of networks can lead to more effectiveness (Ferdiansyah, 2009).
As for infrastructure, as one of the key subjects in network studies, it is close in definition to a network type that is used in network studies as a metaphor, which is that it is a technical network. Summarized by Torrisi (2009), there is no standard definition of infrastructure, it can be defined as the sum of materials, assets, equipment, capital goods, or public goods that serve energy provision, transport, telecommunication, and so on. Infrastructure according to Neuman (2006) can be divided into sections such as utilities (gas and electricity), public works (roads, bridges), social facilities (schools, parks), telecommunications (telephone, internet), transportation, and science network (study center). From another perspective, in the spatial plan of Indonesia infrastructure is divided into several components, i.e.roads, public transportation (land, water, air), energy (electricity), telecommunications, water sources, and environmental management (waste management).
Regarding the interaction between entities (actors or points), a network analysis can provide a means of visualizing sets of relationships and simplify them. In so doing, the relationships and interactions can be useful in promoting effective collaboration between actors/entities (Scott & Cooper, 2007). A central idea in (social) network analysis is the application of a branch of mathematics, called graph theory (Scott and Carrington, 2012). Graph theory analyzes the formal properties of graphs, which are systems of points and lines (Figure 2).
Figure 2. Network Graph. Source: Scott et al., 2008
According to Borgatti, Everett, & Johson (2013), at least three types of 'basic' network analyses can be used in performed network measurement, i.e.based on(1) centrality, (2) subgraph, (3) and equivalence. Centrality is about identifying the 'most important' actors (Wasserman & Faust, 1994). There are four basic centrality measures:(1) degree, (2) closeness, (3) betweenness, and (4) eigenvector.The second approach is based on subgroup, whichisagroup of actors who interact with each other to such an extent that they can be considered a separate entity or cohesive subgroup (Borgatti et al., 2013), and can be explored through 'cliques'. The last approach in network analysis is based onstructural equivalence. According to Borgatti et al. (2013), structural equivalence is a form of direct connection between an actor and other actors in the network. It is based on identifying similar positions and seeking clusters of nodes that are connected to each other.
Regarding network data, to classify data types and develop a research guide (e.g. interview guide, questionnaire questions, etc.) it is suggested to identify what the network is about. From three basic kinds of publications (Knoke & Yang, 2008; Scott, 2013; Borgatti et al., 2013), data collection in network analysis always comprises the following two subjects: (1) connections/connectivity, and (2) relations/relationships. Meanwhile, as stated by Borgatti et al. (2013), network theorizing is based on a view of ties as conduits through which things flow. Network data can be explored through the formal properties of graphs, which are systems of points and lines or links and nodes (Carrington & Scott, 2012). Graphs can be interpreted in several different ways, depending on the set of relationships you want to visualize, such as a road network, a social network, etc. Summarized from several authors, basic network analysis can be extended by several methods, as shown in the following Table 1.
Table 1. Analysis Tools and Definition
| No | Analysis Tools | Definition | Source | Illustration |
|---|---|---|---|---|
| 1 | Degree (in/out) | Number of lines that are incident with nodes or number of nodes adjacent to other nodes | Wasserman & Faust, 1994 | |
| 2 | Closeness | Reflects how close the actors are to each other, which means that an actor is central if it can quickly interact with | Wasserman & Faust, 1994 |
| No | Analysis Tools | Definition | Source | Illustration |
|---|---|---|---|---|
| all others | ||||
| 3 | Betweenness | Thepoint in the middle functions as a 'bridge' between the other points; the controller of the flow. | Wasserman & Faust, 1994; Borgatti, Everett, & Johnson, 2013 | |
| 4 | Eigenvector | An effort to find the most central actors in terms of the overall network structure; a measure of 'popularity'is when a node is connected to nodes that are themselves well connected. | Hanneman & Riddle, 2005; Borgatti, Everett, & Johnson, 2013; Borgatti, 1995 | |
| 5 | Clique | Groups or actors who interact with each other to such an extent that they area group withclose relationships, with a minimum of 3 as the number of the smallest group. | Borgatti, Everett, & Johnson, 2013; Wasserman & Faust, 1994 | |
| 6 | Structural equivalence: blockmodels/ block | Partitioning the vertices of a graph into similarity classes (blocks). | Wasserman & Faust, 1994; |
Source: Complied form Several Authors
Methodology
From the discussion in the previous part of this paper, there are at least three approaches of analyzing networks, i.e. based oncentrality, sub-graph (group), and equivalence. Each approach also has some metrics that can be used, such as in/out degree, closeness, betweenness, eigenvector, clique, and block models. With the mentioned approaches, an analysis was conducted of one of the urban network types, i.e. infrastructure. Briefly, the series of activities in this study included:
- 1. Collecting the main data used in this study from spatial plan documents and other relevant information from government agencies. From these plans and documents, several plans for networks were found, such as roads, electricity, telecommunication, fresh water, public transportation, waste management, drainage, pedestrian, and evacuation routes.
- 2. Diagnosing the existing infrastructure networks related to parts of the infrastructure network within the network system such as points/nodes or point/lines as the translation of locations and their connection with others. Plans were identified that have network components such as links/nodes or point/ lines and were analyzed. Subsequently, a code was assigned for every link/node or point/line within the infrastructure network.
- 3. Exploring the 'structural position' of the infrastructures through the three analysis approaches (measurements) centrality, subgroup, and equivalence (blocks) to see the tendency of its configuration in connecting trade/market areas or tourist attractions. In this stage, the exploration and calculation were supported and processed with UCINET software.
4. Describing the infrastructure network or configuration based on the measurement results, i.e. (1) areas/functions that are the most important or central; (2) areas that interact as a group or 'clique', with a minimum of 3; and (3) areas that interacting the same structural position or block. The areas with the highest scores were highlighted to be presented.
Findings
Brief Description of Pontianak City Infrastructure
For the fulfillment of electricity needs, most areas in Pontianak are connected to the electricity grid. Pontianak is included in the Khatulistiwa electricity grid,which serves several cities and regencies, i.e. Pontianak, Kubu Raya, Mempawah, Bengkayang, Singkawang, and Sambas. Within this system, two power plants are located in Pontianak, namely Sungai Raya and Siantan. In addition, to increase the capacity of the system, it is also connected to the Sarawak (Malaysian) power company. For clean water service, 90% of the fulfillment of clean water needs in Pontianak city have been met. From the existing network plan, tertiary pipes are distributed in almost all areas of the city. In the transportation sector, the total length of roads in Pontianak is 259.64 km. Compared with several years ago, the road conditions in Pontianak have improved, while the number of roads has increased. In 2015, 88% of roads in Pontianak had good quality with an asphalt surface, while 10% was severely damaged. As for public transportation, since 2017, Pontianak has a bus rapid transit (BRT) system, which has four routes but is currently still limited to the southern part of Pontianak. Pontianak has six public transportation terminals serving the community. As for telecommunication, most of the residents use cell phones that are served by means of a base transmission station (BTS) with a radius of 5 km, so it covers the entire land area of Pontianak.
As for waste management, Pontianak operates temporary waste dumping grounds (TPS) located in certain places to serve the community level. The waste is then transported and dumped in a landfill or a final waste processing area (TPA). As for drainage, the drainage network in Pontianak generally uses rivers and small canals. The primary drainage network includes the main rivers, Kapuas and Landak; secondary networks include other rivers, such as Jawi, Raya and so on, while the tertiary network consists of existing canals (small rivers) along local roads. As for the pedestrian network, the development plan focuses on several areas where offices, commercial areas, and riversides are located. The pedestrian network is planned to be extended to main streets such as A. Yani Street and MT. Haryono Street, several major rivers, and tourist attractions, as well as in commercial areas such as Tanjungpura Street. The evacuation routes are divided into two systems: (1) primary arteries, and (2) collector roads that are connected to other cities/regencies such as Kubu Raya and Mempawah. For the primary arterial road, the evacuation route runs from A. Yani, Tanjungpura, Kom Yos Sudarso, Toll bridge, to Situt Mahmud Street.
Infrastructure Network in Pontianak City
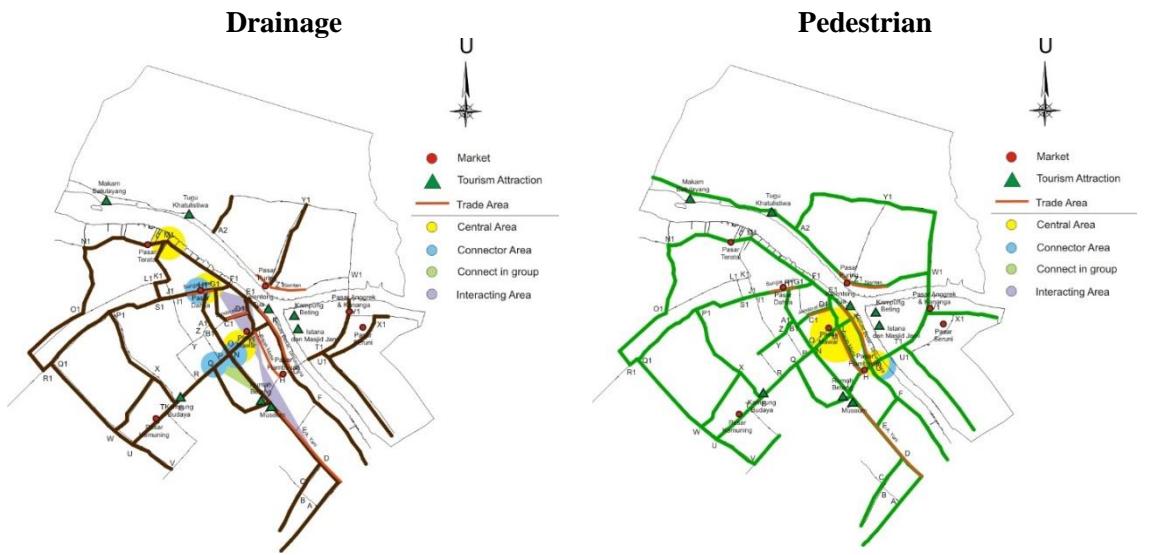
The spatial plan of Pontianak City (2013-2033) is divided into separate plans for spatial pattern and structure, road network, grid (electricity) network, telecommunication network, fresh water network, waste management, drainage network, pedestrian network, and evacuation access. However, the types of infrastructure to be used include: (1) roads, (2) public transportation, (3) electricity, (4) fresh water, (5) drainage, and (6) pedestrian (Figure 3). The infrastructure types to be analyzed were determined in accordance with the availability of the network components
Road Network Public Transportation (BRT)
Centrality: Market/trade areas included as the most important (central) areas
Subgroup: Market/trade areas included in two subgroups
Block: Market/trade areas and tourist attractions interact with each other
Centrality: Market/trade areas included as the most important (central) areas Subgroup: No subgroups
Block: No blocks
Electricity Fresh Water
Centrality: Market/trade areas included as the most important (central) areas
Subgroup: Market/trade areas included in one subgroup
Block: Market/trade areas and tourist attractions interact with each other
Centrality: Market/trade areas and tourist attractions included as the most important (central) areas
Subgroup: Market/trade areas included in one
subgroup
Block: No blocks
Centrality: Market/trade areas included as the most important (central) areas
Subgroup: Tourist attractions included in one subgroup
Block: Market/trade areas and tourist
attractions interact with each other
Centrality: Market/trade areas included as the most important (central) areas
Subgroup: No subgroups
Block: No blocks
Figure 3. Spatial plan of Pontianak City (2013-2033)
that can be analyzed in each infrastructure plan. Subsequently, the areas with the highest score were highlighted to be presented. A description of the infrastructure network in this part will focus on the measurement of the following network elements:
- 1. Centrality: provide information on the 'most important' or central area within the infrastructure network;
- 2. Subgroups: provide information on groups of areas that interact within the infrastructure network, with a minimum of 3;
- 3. Blocks: provide information on areas that have a similar position and direct connections and are connected and interact with each other within the infrastructure network.
Conclusion
This study attempted to analyze the existing urban networks in Pontianak in support of the city's development goal to become a leading trade, services, and tourism city based on its urban network. The findings showed that, based on the highest scores, the central areas that are the 'most important' areas and link other areas within the city infrastructure network are dominated by market or trading areas/functions. Tourist attractions are still limited in number around the main street (A. Yani Street) and mostly distributed around Betang House and the municipal museum. This illustrates that the infrastructure accessibility and support for tourist attractions are still limited compared to that of market/trading areas seen from the perspective of the network configuration.
Some markets/trade areas have been included as central or major areas inside the spatial plan configuration of Pontianak, specifically within the infrastructure networks. Looking at this situation, in accordance with the theoretical framework discussed above, trade activities are often important in supporting the economic development of the city, and are prioritized. Furthermore, because of the availability of infrastructures and facilities within the city, the development of tourism is wide open based on the city network analogy, where the city is an interchange node among a set of networks that can synergize.
The outcomes of this paper suggest important policy implications. Trade and tourism in Pontianak can benefit further from an improvement of the network of infrastructures and facilities. In order to increase the centering or grouping for specific functions/areas the government can add or reduce the degree of connectedness by arranging the flow or connections (links) from one area (point) to another, directly or indirectly, with the infrastructure network as the intermediary.