
Introduction
Connectivity between cities within regions is an important issue for Indonesia, China, and other Asian countries with large and growing city regions. In 2010, the Population Division of the United Nations identified 25 urban agglomerations with populations over 5 millions and 8 urban agglomerations with populations over 10 million in Asia and the Pacific region (UN, 2010). They estimated that these numbers will have increased to 35 urban agglomerations with populations over 5 million and 13 with populations over 10 million by 2025. China's National government has identified 26 Large City Clusters (LCCs) (PRC, 2016). The Chinese National Bureau of Statistics considers a city with 5 million or more residents in its core to be a megacity. By this definition there are currently 14 megacities in China (PRC, 2016; Chen & LeGates, 2016). The actual population of these 14 megacities is much larger than 5 million, as they are large and complex administrative divisions. Shanghai and Beijing have more than 23 million residents each. The extended Jakarta Metropolitan Area (JMA) now has a population of 32 million in the Jakarta-Bandung Region (Firman, 2009).
One of the earliest megacity regions to emerge in China was in the Pearl River Delta (PRD), which began to develop rapidly after the beginning of reform and opening in 1977. PRD is now one of the largest and most dynamic of the world's megacity regions. Other cities can learn from the recent development and increasing connectivity of the region. The historic core of the PRD is Guangzhou – formerly known as Canton – which has been the most dominant city in the region by far since before the Treaty of Nanking opened the city to European trade in 1842. The second most important city in PRD is currently Shenzhen, on the border with Hong Kong, which has grown from a tiny and economically insignificant settlement in 1977 to a metropolis of 11.38 million people today (GPSB, 2018). This article analyzes the recent development of PRD and connectivity between the core cities of Guangzhou and Shenzhen, 9 other core cities, and 6 cities that lie within 3 new economic development zones planned for integration into the core.
In August 2017, the Guangdong Provincial Housing and Construction office and the Guangdong Provincial Development and Reform Commission jointly issued an important planning document entitled Guangdong Province New Town Planning (2016-2020), or the GDP 2020 Plan. This document incorporates concepts from China's National New Style Urbanization Plan (2014-2020), which encourages governments at every level to adapt a 'new style' of economic, spatial and social planning that, among many other objectives, encourages large-scale regional planning to reduce competition between cities within Large City Clusters (LCCs) and increase LCCs' global competitiveness (PRC, 2014). Guandong Province's GDP 2020 Plan proposes three economic zones containing 6 new cities – Shaoguan, Heyuan, Shanwei, Yangjiang, Qingyuan, and Yunfu – and details plans to incorporate the new zones and 6 cities into the PRD megacity region. This is a change from Guandong Province's most important pre-2016 plan – the PRD Economic Zone city plan (1994), which defined 9 cities as the core area of PRD. The formation of the expanded PRD economic zones is intended to promote the economic development of the entire PRD region (GPSB, 2016). Figure 1 shows the Pearl River Delta megacity region, Guangzhou Province, and the 9 core cities and the 6 proposed new cities.
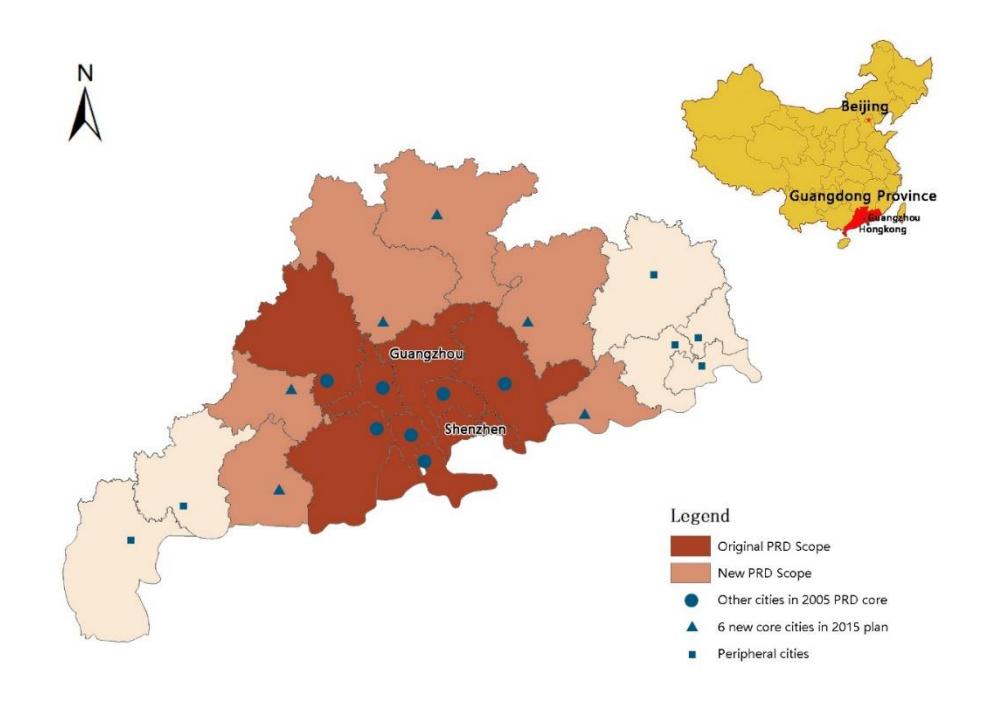
Figure 1. Pearl River Delta, Guangzhou, Shenzhen, 9 core and 6 planned new cities. Source: Drawn by Author.
The economic spatial relation between cities within a megacity region directly affects the development of the megacity region (Yan & Cao, 2004). Improvements in transportation technology, such as the Guang-Fo-Zhao economic expressway, illustrated in Figure 2, are particularly important.
Figure 2. Guang-Fo-Zhao economic zone expressway. Source: http://news.cnr.cn/native/city/20161224/t20161224_523388419.shtml.
As a result of globalization, megacity regions are emerging worldwide, but particularly in China. Thanks to fast developments in communication technology, central metropolises are increasingly positioned to diffuse growth in their region's core to nearby smaller cities and serve as hubs for regional city networks. Research on megacity regions is an important topic in the Chinese urban planning community (Cheng & Zhang, 2016; Tang & Zhao, 2010; Xiong et al., 2013).
Research Method and Data Sources
Research Method and Model Correction
Gravity models are a helpful way of analyzing city systems. Economic gravity models view the economies of the cities within a region as parts of an interconnected system. Accordingly, changes in transportation and communications technology, such as China's HSR lines and expressways and better internet connectivity, will impact city quality and improve connectivity and development. Spatial interaction between cities within a regional network is an important area of inquiry in economic geography and urban planning.
The gravity model in geography is derived from Newton's gravitational formula – perhaps the most important law in physics. The American geographer Riley (1929) first applied the law of gravity to urban economic research and then proposed his famous retail gravity law. In China, Riley's retail gravity model has been used to analyze the spatial role of cities (Chen & Liu, 2002), which was then extended to understand the location of foreign investment (Ran & Zhao, 2004; Shi et al., 2005), the interaction structure between cities (Wang and Zhu, 2010; Guang & Liu, 2014; Liu et al. 2016), and the nature of divisions within regions (Qian et al. 2015; Jiao et al., 2014; Gao & Yin, 2015; Guo et al., 2012).
British geographer Peter Haggett proposed a theory of spatial interaction in 1972 (Haggett, 1972). Haggett emphasized the importance of integrating spatially separated cities into an organic whole with a specific structure and functions. In traditional geographical theory, interaction is the most important aspect of urban spatial networks (Zheng et al., 2011). The interactions between a city and other cities is considered an important attribute of cities, similar in importance to attributes such as urban population size and per capita income. The urban gravity model has become one of the most important methods for describing urban spatial networks.
In gravity models, the attraction between cities represents the amount of regional economic gravitation or spatial interaction. It is the comprehensive reflection of urban external economic radiation capacity, which is the basic method of urban network analysis and can be used to describe economic flows within megacity regions. We developed our own spatial gravity model using the following formula:
\[I_{ij} = \frac{P_i \times P_j}{D_{ij}^2}\]
where Pi and Pj represent the quality of cities i and j respectively, and Dij represents the time distance between the two cities. For each city, we use the sum of its gravitation with all the other cities as its potential value. The potential value reflects the possible strength of interaction between cities. This can be used as an index to reflect the spatial interaction of the region (Ning et al., 2003).
Our analysis of spatial economic relations in PRD contributes to an understanding of the rationality of PRD's new expanded form. In addition to shedding light on recent developments in PRD itself, this paper provides a helpful methodology that can be applied to other megacity regions. Our research questions are relevant to Indonesia and other countries. Our findings help illuminate how megacity regions are changing as a result technology and globalization.
For planning purposes and to assess the rationality of a plan like Guangdong's GDP 2020 Plan it is necessary to evaluate a city's development potential and gravity models are helpful for this kind of forecasting. Longitudinal analysis allows us to predict the probable future development potential of cities in PRD. This methodology can also be applied to cities in Indonesia and other countries.
Currently, uneven development of urban and rural areas is an important research topic in scholarly research in China and other developing countries, including Indonesia (Miao & Zhou, 2017; Li & Li, 2011; Mei et al., 2012; Zhang & Mao, 2012; Wicaksono et al., 2017).
Development in PRD is very uneven and understanding differences between cities in the PRD city system is important. To date, however, research has mainly focused on the original 9 PRD core cities. This paper, uses a combination of a gravity model and spatial analysis using GIS to investigate the new proposed extended 15-city PRD region consisting of the original 9 citiesas well as the 6 cities the PRD 2020 plan proposes to incorporate, and peripheral cities.
This study used a gravity model to analyze spatial economic relationships between cities in PRD, particularly within Guandong Province – the economic core of the PRD megacity region. It discusses prospects for integration of the newly added cities to the older core cities in PRD. Finally, it provides information on peripheral cities in the region. Our paper draws on recent Chinese literature previously inaccessible to English and Indonesian language readers.
Research Data
Multi-dimensional variables, such as urban 'quality' are often measured by identifying key attributes of the variable, getting the most recent, reliable and relevant data and then combining the measures into one or more indices. Our urban competitiveness index sets up an evaluation system, using 20 different indices to reflect cities' development levels. As shown in Table 1, our Urban Quality Evaluation Index system is divided into 2 dimensions based on 20 indices, such as the urban economic level and the social development level that help make a city competitive, using indicators such as available land, the quality of the labour force, infrastructure, availability of capital and particularly the quality of the city's transportation and communications infrastructure. The sum of each city's gravitation is a proxy for the potential value of the city. The potential value is used to characterize the city's integration into the network now or in the future (Beijing International Urban Development Institute, 2002).
Data on the 15 cities come from China Urban Statistical Yearbook 2006 (PRC, 2006), China Urban Statistical Yearbook 2016 (PRC, 2016), Guangdong Statistical Yearbook 2006 (Guangdong, 2006), and Guangdong Statistical Yearbook 2016 (Guangdong, 2016). The Kaiser-Meyer-Olkin (KMO) test measures the correlation between ratio level variables. It is expressed as a coefficient ranging between 0 and 1. The closer a KMO value is to 1, the stronger the correlation between the two variables. KMO values over 0.7 are considered strong enough to warrant principal component analysis.
| Level-one indicators | Level-two indicators |
|---|---|
| Area of urban built-up area (x 2), Gross domestic product (x 3), | |
| Gross domestic product per capita (x 4), Local financial | |
| revenue (x 5), Total export (x 9), Number of practitioners in | |
| Urban economy | integrated science and technology services (x 11), Average |
| development level | wage of employed persons (x 15), Million people post and |
| telecommunications business volume (x 16), Second industry | |
| added value (x 17), Foreign direct use of investment (x 18) | |
| Size of the urban resident population (x 1), Investment in fixed | |
| assets in society (x 6), Total retail sales of consumer goods | |
| (x 7), Proportion of third industry added value to GDP (x 8), | |
| Social development level | Number of beds in medical and health establishments (x 10), |
| Total urban passenger transport (x 12), Total volume of urban | |
| freight (x 13), Third industry added value (x 19), Number of | |
| overnight tourists (x 20) |
Table 1. Indicators for measuring urban quality.
Analysis of our Urban Quality Evaluation Index found that two-year KMO values were all greater than 0.7, which makes principal component analysis an appropriate method to calculate the quality score of each city. Accordingly, we used principal component analysis to rank the quality of the 15 PRD cities. The results are shown in Table 2.
Table 2. Urban quality of PRD cities.
| Urban quality | |||||
|---|---|---|---|---|---|
| City | 2005 | Rank | 2015 | Rank | |
| Shenzhen | 22,529 | 1 | 61,399 | 1 | |
| Guangzhou | 20,088 | 2 | 51,309 | 2 | |
| Dong guan | 11,868 | 3 | 40,352 | 3 | |
| Foshan | 9,486 | 4 | 27,281 | 4 | |
| Huizhou | 7,559 | 5 | 14,724 | 6 | |
| Zhuhai | 6,974 | 6 | 22,938 | 5 | |
| Zhongshan | 6,882 | 7 | 13,227 | 8 | |
| Jiangmen | 5,303 | 8 | 11,706 | 9 | |
| Zhaoqing | 4,393 | 9 | 13,689 | 7 | |
| Shaoguan | 2,273 | 10 | 5,779 | 12 | |
| Qingyuan | 2,250 | 11 | 6,032 | 10 | |
| Heyuan | 1,988 | 12 | 4,892 | 13 | |
| Shanwei | 1,660 | 13 | 4,394 | 15 | |
| Yangjiang | 1,573 | 14 | 5,843 | 11 | |
| Yunfu | 1,402 | 15 | 4,469 | 14 | |
We used the urban quality rankings in Table 2 as variable P and the time it takes to travel between pairs of cities in Appendix A as variable D. Using Formula 1, we obtained the intercity gravitation for two years: 2005 and 2015.
The most important transportation linkages between cities in PRD for moving large volumes of people and goods are HSR lines and expressways.
Guangdong Province had 6,880 kilometers of expressways in 2005 – more than any other province in China. Expressway density is in Guangdong Province is greater than any other area in Asia, second only to the New York metropolitan area (GRCIG, 2018). There were 2,164 kilometres of rail line in Guangdong Province in 2005, none of which were HSR lines. Construction of China's HSR system has dramatically shortened travel times throughout China, including the PRD. Guangdong Province currently has 4,510 kilometres of rail lines, 1,542 kilometres of which are HSR lines (Li, 2018).
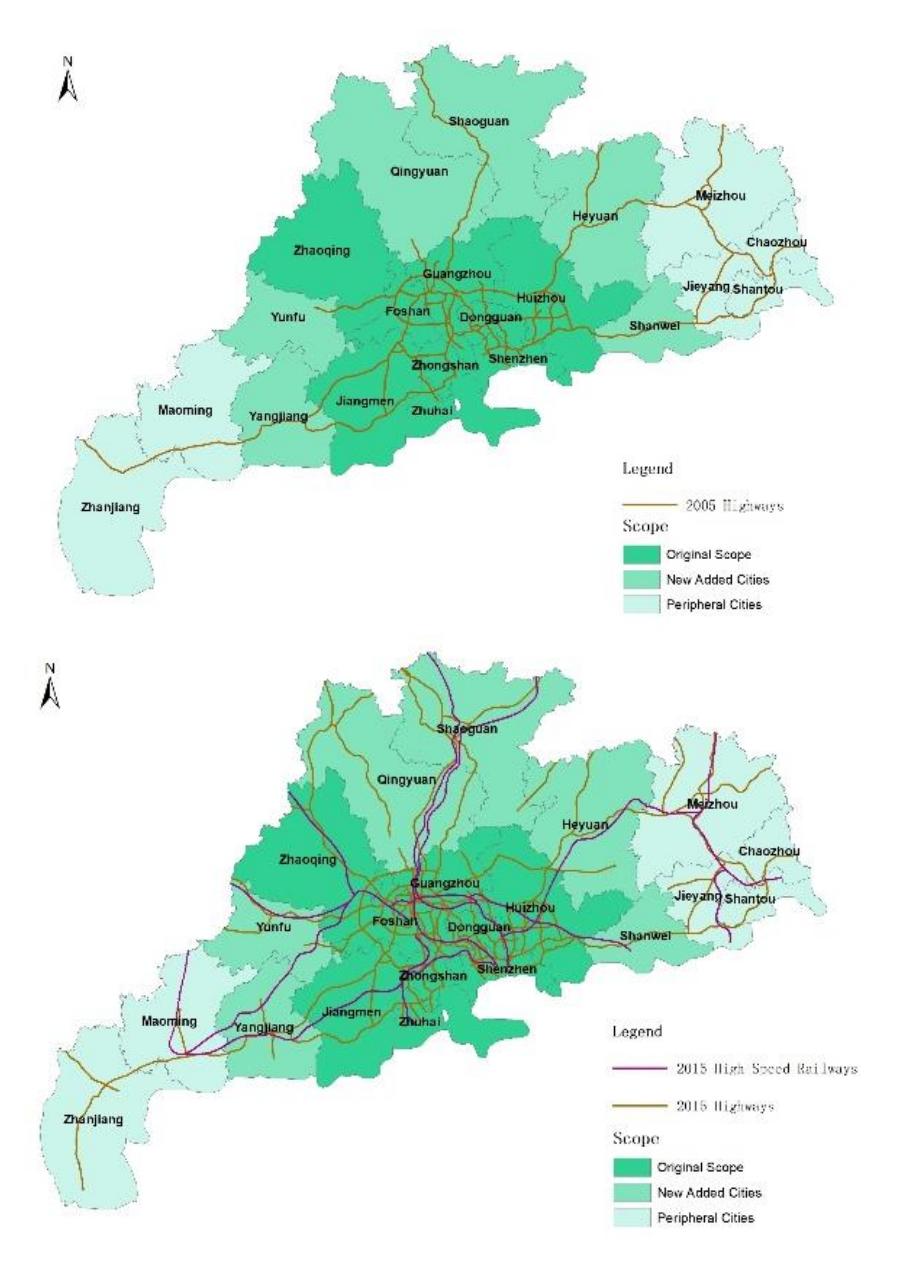
Figure 3. Comprehensive traffic map of Guangdong province: (a) 2005 (b) 2015. Source: Source: Based on Guangdong Province Traffic Tourism Map (2006, 2016) and then Drawn by Author.
This article used the time it takes to transport people and goods by HSR or expressway as a proxy for distance. The time-space compression effect of HSR has changed PRD's traditional hierarchical regional central system into a more flowing, homogeneous regional equilibrium system (Kivisto, 2012; Wu et al., 2013). Residents' daily commutes can extend throughout the metropolitan area (Wang & Lin, 2011) using space resources more efficiently and distributing population and employment within the metropolitan area more rationally. The Wuguang HSR line, which links important parts of the PRD region, is an example. It was opened in 2009 and greatly shortened the time between cities and strengthened the interrelation between them. For example, the Wuguang HSR line reduced the time it takes to travel between the region's two most important cities – Shenzhen and Guangzhou – by half, from 52 minutes to 29 minutes.
Using data from the Guangdong Province Traffic Tourism map (Guangdong Map Press, 2006, 2016), we digitized Guangdong's HSR and expressway data, extracted the topological structure, and set up network data sets. We abstracted the 15 cities in the PRD megacity region as nodes in the network and used ArcGIS's network analysis function to ascertain the shortest path between each of the cities (Figure 3). The shortest path is a measure of travel time, not physical distance. For tables showing the travel time between cities in PRD, see Appendix A.
Findings
Urban and economic geographers, regional scientists, and national and regional planners are interested in the economic structures of region. This is of more than academic interest for developing countries like China and Indonesia, where national and subnational policy makers must make important decisions about where to build infrastructure, locate economic zones, and channel investment. Following is our analysis of the spatial structure of PRD and how it has evolved over the last ten years.
Structural Analysis of the Temporal and Spatial Evolution of the PRD Megacity Region 2005-2015
In two separate years, we set the maximum value of gravitation as 100 and used the ratio between the other values and the maximum value to represent other gravitations. For example, in 2005, the maximum value was the gravitation between Guangzhou and Foshan 1,190,885,919, so we set 1,190,885,919 as 100. The second highest gravitation was between Guangzhou and Dongguan, 640,671,618, so we set it as 53.8. We then built PRD megacity region network gravitation maps (Figure 4 and 5). The thickness of the lines in Figures 4 and 5 represents the strength of connectivity between pairs of cities.
When we combined all the gravitation ranks from both years into a single table, we found that the top 10 relationships were all from 2015. Among the top 20 relationships, only two were from 2005 (Guangzhou-Foshan and Guangzhou-Dongguan). Among the top-30 relationships, only two additional ones were from 2005 (Shenzhen-Huizhou and Shenzhen-Dongguan). This demonstrates quantitatively for the first time that the whole PRD area has developed very fast since 2005. The gravitation between the 15 cities has increased dramatically, but to different degrees.

Figure 4. 2005 relative gravitation between key PRD cities. Source: Based on Guangdong Statistical Yearbook (2006) and then Drawn by Author.
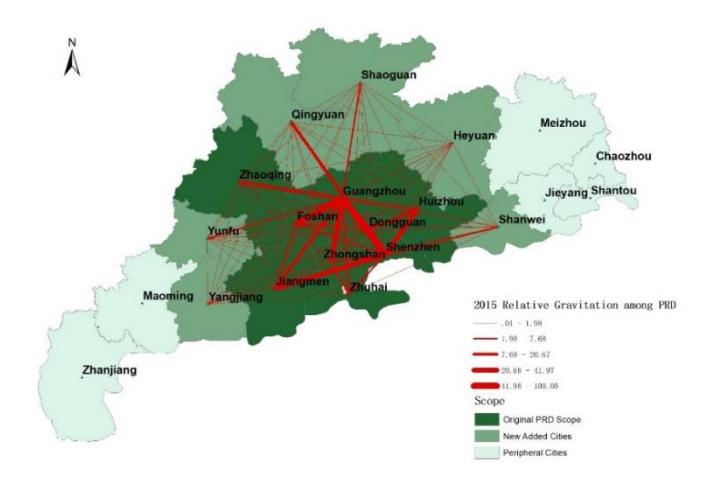
Figure 5. 2005 relative gravitation between key PRD cities. Source: Based on Guangdong Statistical Yearbook (2016) and then Drawn by Author.
Looking closely at the change between 2005 and 2015 allowed us to understand the most important gravitation changes between PRD cities. In 2005, the strongest gravitation was between Guangzhou and Foshan, followed by Guangzhou and Dongguan, Shenzhen and Dongguan, and Shenzhen and Huizhou, in that order. Development of two major new economic development zones – the Guang-fo-Zhao, and Shen-Wan-Hui development zones – which was started in 2005, did in fact greatly increase integration of 4 of the 6 cities Guangdong proposed to integrate with the core 9 cities as planned. The rapid development of Guangdong's HSR system occurred with unexpected speed due to counter-cyclical investment in HSR to counter the 2008 global financial crisis. It and other transport infrastructure within and between economic zones have been very effective. The time/distance between cities in PRD has been greatly shortened. In the past five years, railway construction in Guangdong Province has achieved remarkable results. It has reached 4,510 kilometres in total and HSR lines now pass through 16 prefecture-level cities. By 2020, all of the PRD Intercity Railway will be fully operational and the HSR system will cover all 21 cities in Guangdong Province, with a total
mileage of 1,430 kilometres (see Figure 6). The HSR network will shorten intercity travel between even the most distant cities in Guandong Province to between 2 and 3 hours. In February 2015, a unified traffic smart card system in Guangdong Province covering the whole province as well as Hong Kong and Macao, named 'Lingnan Tong', became operational, providing the foundation for even further infrastructure integration in the extended PRD megacity region.
Figure 6. PRD Intercity Railway. Source: Based on Planning and Implementation Plan of Intercity Railway in Pearl River Delta and then Drawn by Author.
Analysis of the Expanded Scope of PRD
The 6 cities Guangdong Province has proposed to integrate with the original 9 cities they considered to form the core cities of the region are of particular interest. Of the 6, only Heyuan-Shenzhen was well connected to other cities in the region in 2005. But 10 years later, in 2015, Qingyuan, Shaoguan, Yunfu and Shanwei had been successfully integrated into economic zones. Qingyuan, Shaoguan and Yunfu were integrated into the Guang-fo-Zhao economic zone and Shanwei was integrated into the Shen-Wan-Hui economic zone. All of these four cities now have strong economic and spatial links to the PRD megacity region network system. Gravitation between the economically strongest city in the region – Guangzhou – and these four cities has developed in line with Guangzhou's plan and now provides a good opportunity to develop further. In contrast, the situation is not so good for Heyuan and Yangjiang. They not only have low gravitation with Guangzhou (ranked 48 and 54 respectively in the 105 gravitation pairs in 2015), but also have not become integrated into any multi-city economic zone. They have very little gravitation with other peripheral cities. Whether they can be integrated into PRD and, if so, which strategies are appropriate to integrate them requires further study.
Gravitation between Guangzhou and Shenzhen and Other PRD Cities
As the capital of Guangdong province, Guangzhou has always been PRD's central city and in 2015 it was still the core city of PRD. However, currently it is no longer the only core city. Meanwhile, Shenzhen has become much more closely linked with several other cities. These two cities merit a separate analysis.
| 1999 | 2000 | 2004 | 2008 | 2010 | 2012 | 2016 | |
|---|---|---|---|---|---|---|---|
| Guangzhou | Sufficiency (107) | Gamma- (109) | Gamma+ (98) | Beta- (73) | Beta (67) | Beta+ (50) | Alpha- (40) |
| Shenzhen | _ | Sufficiency (200) | Sufficiency (179) | Gamma- (102) | Beta- (106) | Beta- (130) | Beta (85) |
Figure 7. 1999-2016 GaWC Ranking of Guangzhou and Shenzhen. Source: Based on http://www.lboro.ac.uk/gawc/ and then Drawn by Author.
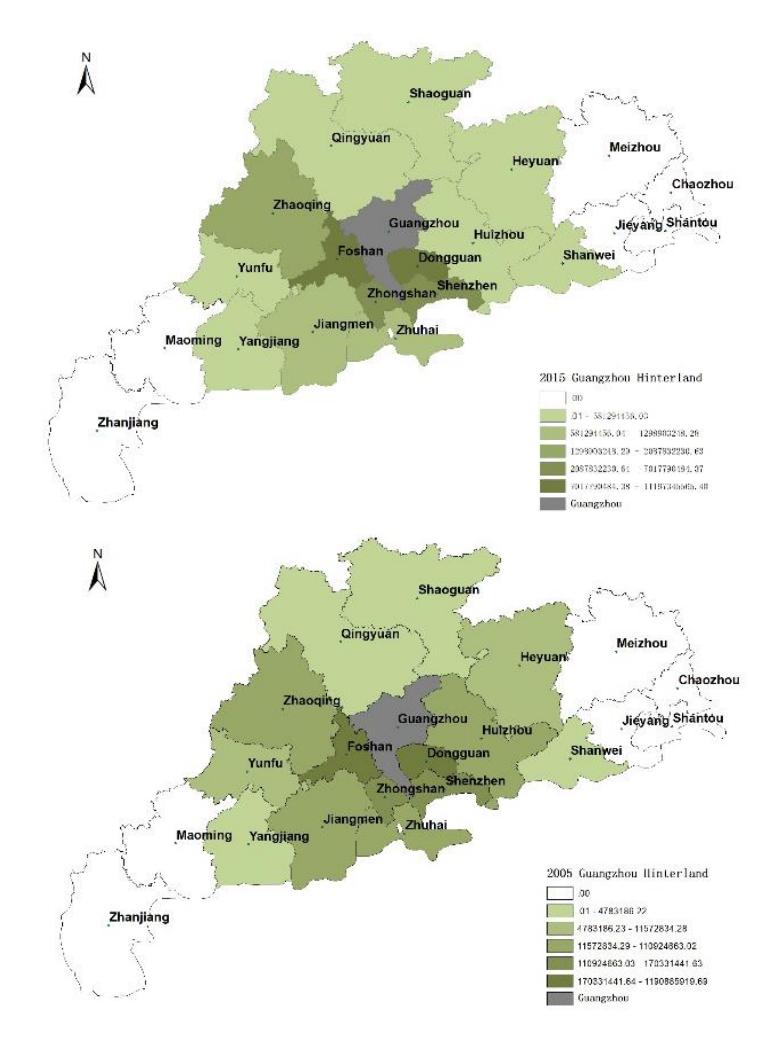
Figure 8. Guangzhou's hinterworld: (a) 2005, (b) 2015. Source: Guangdong Statistical Yearbook (2006, 2016).
Since the 19th century, geographers have described the region linked to a core city as its 'hinterland', from the German words hinter (behind) and land (land). Recently, economic geographers associated with the Global and World Cities Network (GaWC) have applied the term hinterworld to the extended region of megacities (see Figure 7), such as Guangzhou and Shenzhen (Derudder, Witlox & Taylor, 2007). Hinterworlds are different from hinterlands around smaller and less globally connected cities. The term implies that there is a link between the core city and surrounding cities in the megacity region to cities throughout the rest of the world. A recent study has shown that the hinterworld of Shanghai contributes greatly to
Shanghai's global city status (Yao & LeGates, 2018). The hinterworlds of Guangzhou and Shenzhen can be specified according to the gravitation between these two cities and other cities with which they are strongly linked, and global cities worldwide. This is illustrated in Figures 8 and 9.
In 2005 Guangzhou-Foshan was the closest city pair, with a maximum absolute gravitation value of 1,190,885,919, but by 2015 that had changed to Guangzhou-Dongguan with a maximum absolute gravitation value of 11,197,345,565. From the perspective of gravitation, the connection between Guangzhou and Dongguan in 2015 was nine times as strong as it was in 2005, which means that Guangzhou's connectivity to Dongguan became nine times stronger over a decade.
Shenzhen's influence also increased between 2005 and 2015. Compared with 2005, when Guangzhou was the single core and had the strongest gravitation, in 2015, Shenzhen's gravitation with other cities and city clusters increased greatly. Based on its increased connectivity, Shenzhen has become the second core of PRD.
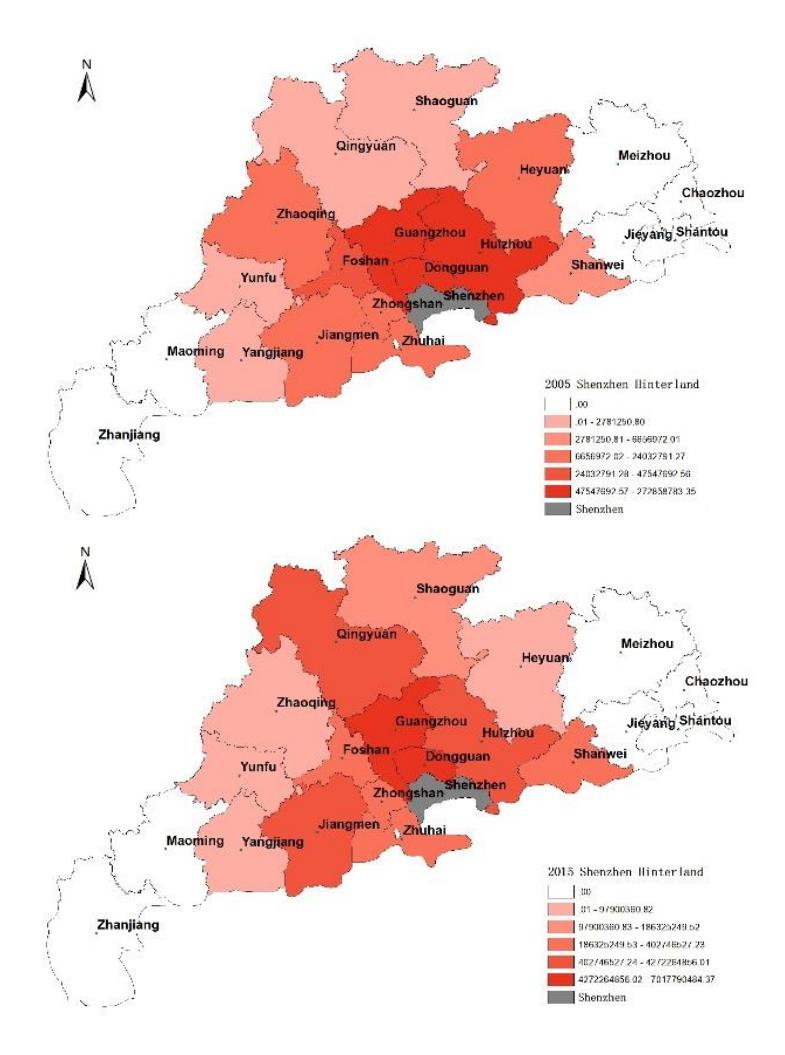
Figure 9. Shenzhen's hinterworld: (a) 2005, (b) 2015. Source: Guangdong Statistical Yearbook (2006, 2016).
Guangzhou and Shenzhen became even more important nodes between 2005 and 2015 due largely to technological change in transportation and particularly to the HSR line, which did not exist in 2005 but in 2015 had a total length of 104.6 kilometers. The time to travel between Guangzhou and Shenzhen was shortened from 52 minutes to 29 minutes after the HSR line began running in 2009. Compared to just 54 pairs (54 trains go from Guangzhou to Shenzhen a day and 54 trains from Shenzhen to Guangzhou) in 2001, now 209 pairs of trains run between the two cities each day, 113 of which are HSR trains. Their gravitation jumped from 14.3% of the PRD total in 2005 to 62.7% of the total in 2015. Shenzhen and Guangzhou together make PRD bi-polar. Considering Dongguan, Foshan, Zhuhai, and other important centers, the PRD megacity region can be characterized as having a polycentric network of cities with characteristics somewhat similar to North-Western Europe as described in the important study by Peter Hall and Kathy Pain, which first used the term 'megacity region' (Hall, P. and Pain, K., 2006).
Based on the above findings future development policy for PRD should:
- (1) Continue to strengthen the radiation effect of Guangzhou, Shenzhen and other central PRD cities to achieve further diffusion of the most successful high-tech manufacturing, research and development activities, advanced producer services, and other sectors.
- (2) Improve the development of secondary cities as well as the core cities consistent with the policies of 'innovating reform and opening-up' and 'realizing a balanced and full development' as articulated at the 19th National Congress of the Chinese Communist Party (CPC) in 2017.
- (3) Address balanced development of peripheral cities. Policy makers should make use of the large working-age population in peripheral cities beyond what is needed in agriculture. The original front shop–back factory cooperation model for Hong Kong and Guangdong when China's reform and opening policy began in the late 1970s – in which more advanced regions do strategic planning, marketing, and management while less developed regions do actual manufacturing – may be spread from Guangzhou, Shenzhen and the 13 other advanced PRD cities to peripheral cities to help form a more efficient specialized division of labor in the entire PRD.
Analysis of PDR Cities' Connectivity and Development Potential
The sum of each separate city's gravitation is a proxy for both cities' connectivity at the time the measurement was made and their development potential. It helps explain how well a city is already integrated into the PRD megacity network. Longitudinal analysis of change in connectivity helps to forecast how rapidly a city is likely to become more integrated in the future. Connectivity and development potential are strongly correlated, so this kind of analysis helps planners and policy makers understand the likely development potential of cities. It also helps with normative policy about equity by showing peripheral cities and 'connectivity deserts', where cities have been left out of the network and may need help.
As shown in Figure 10 and Figure 11, Guangzhou was the most strongly connected city in PRD in both 2005 and 2015, and its gravitation increase between 2005 and 2010 far outstripped that of other cities. Guangzho's integration into the PRD megacity region network is by far the strongest of any of the cities we studied. Shenzhen, Foshan and Dongguan ranked from second to fourth in both years; their connectivity was much stronger than that of other PRD cities in both 2005 and 2015. They have strong attraction for the surrounding cities and they maintained
high growth rates in the years between 2005 and 2010. Planners and policy makers need to decide whether to do nothing to help these cities, since they are prospering as it is on their own, or make plans and investments to further enhance their growth. Given their importance and the pattern of diffusion, our research shows we should favor the latter approach.
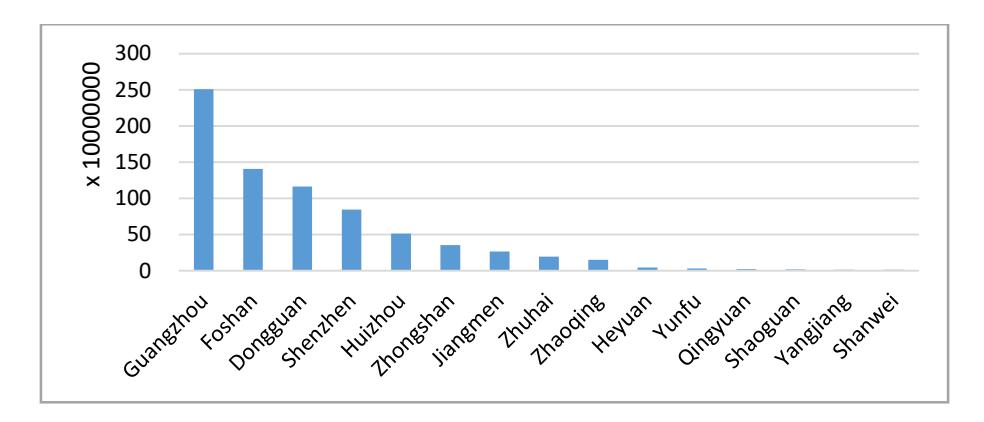
Figure 10. The potential value and ranking of each city in PRD in 2005.
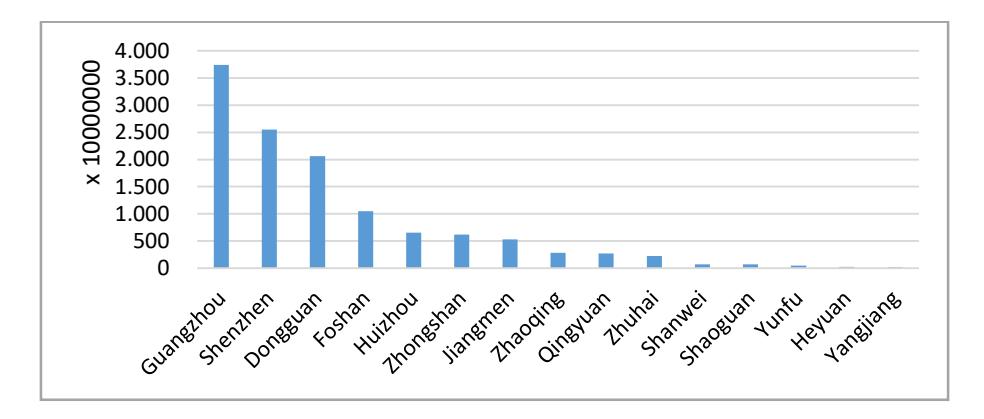
Figure 11. The potential value and ranking of each city in PRD in 2015.
In 2005 the connectivity and development potential of the nine cities in the original PRD core was far greater than that of the six new cities Guangzhou planned to integrate into the core. But after 10 years, the situation has changed. Shanwei developed rapidly over the 10-year period. Its connectivity rank climbed from 15th in 2005 to 11th in 2015, though its contribution to the overall regional economy is small because of its small size. Qingyuan's connectivity rank moved into 9th place ahead of Zhuhai. The connectivity of some smaller cities also changed dramatically, mainly due to the HSR system. For example, the rapid development of Qingyuan was largely based on the establishment of the Wuguang HSR station. The time distance between Qingyuan and other cities was shortened by 42%, greatly improving Qingyuan's integration into the PRD megacity region network.
Conclusion
Spatial interaction involves flows of people, commodities, capital, and information between city nodes within a region. Based on statistical and spatial analysis of a spatial economic gravity model and spatial interaction theory, this paper revealed the spatial economic relations between cities in the Pearl River Delta. It analysed empirically how realistic the expanded network
envisioned in Guangdong Province's GDP 2020 Plan is and it provided suggestions for the further development of the PRD megacity region.
The main characteristics of PRD's development can be summarized as follows:
- (1) Guangzhou is located in the center of PRD and it has always had an absolute advantage. It has been the most powerful central node in the region for hundreds of years. But the new city of Shenzhen, which was an uninfluential city of 332,900 at the beginning of reform and development (GPSB, 2016), had already grown into a megacity by 2005 and achieved much more development in the decade 2005-2010, as nearby cities were increasingly integrated with it. Together, the cities Guangzhou and Shenzhen make PRD a bi-polar megacity region today.
- (2) Four out of the 6 new cities designated in the Guangdong Province GDP 2020 Plan to become part of the core PRD network after 2005 have in fact become well integrated into the core. Qingyuan, Shanwei, Yunfu, and Shaoguan had relatively high gravitation within their own economic zones by 2015 and, as Table 2 indicates, are now well integrated into the core. But two of the 6 cities – Heyuan and Yangjiang – have not yet been well integrated into the network and it is not clear when they will be. Our analysis suggests that the development potential of these two cities is low. Whether Heyuan and Yangjiang should be added to the core area and, if so, how to do that still needs further consideration.
- (3) Travel time significantly affects the development potential of a city and its ability to become integrated into a megacity region network. Our findings show a strong correlation between connectivity and development during the last 10 years, which suggests that PRD should speed up the construction of HSR lines, highways, ports, airports and other transportation infrastructure. PRD should better integrate existing and future transportation infrastructure.
For the further development and policy development of PRD, planners and policy makers should recognize the bi-polar nature of the region. They should continue to promote integration by expanding the influence of the region's two strongest growth poles: Guangzhou and Shenzhen. Our findings suggest that they should also further enhance connectivity between the four cities that Guangzhou's PRD 2020 Plan considers part of the core – Qingyuan, Shanwei, Yunfu, and Shaoguan, which have become well integrated – to help PRD further evolve into a polycentric megacity region. Policy development for the two cities that our research found to have weak development potential – Heyuan and Yangjiang – requires further study. Speeding up the integration of all parts of the region's transportation infrastructure to improve the free flow of production factors should benefit all types of cities in the region. The development of peripheral cities should not be ignored.
Our methodology and way of conceptualizing PRD has implications for other cities and megacity regions elsewhere in the developing world, for example in Indonesia. Many regional plans treat each city as a point, whereas in fact Chinese cities and cities in Indonesia and other developing countries are large and administratively complex. Analysis at the scale we used is an important starting point.
From the point of view of megacity regions, each urban area can be considered part of a functionally connected region as well as an independent entity. The European Union requires uniform data collection at the Functional Urban Region (FUR) scale. The United States require uniform data at the level of Standard Metropolitan Statistical Areas (SMSAs). Provinces or the Chinese National Government and the national or subnational governments of Indonesia or other developing countries may look at Europe and the United States for models of how to improve regional data collection and aggregation.
A more precise understanding of the PRD network – or any network in Indonesia or other developing countries that is large and administratively complex – could use smaller units of analysis to good advantage. Instead of one point, administrative divisions of cities could be represented by many points, with data at county, district, or lower levels, to be more accurate.
Cities are connected by the flow of people and information in networks (Taylor & DeRudder, 2016). University of Southern California communications professor Manuel Castells argues that 'the space of flows' – the flows of people, goods, capital, and information into and out of cities – is as important as 'the space of places' in global cities (Castells, 1996). Analysis combining the space of flows and the space of places can provide a richer understanding of rapidly changing megacity regions like PRD and the Jakarta megacity region. Looking at PRD and similar world megacity regions at an even larger scale is also important. PRD is closely connected to the nearby Special Administrative Regions of Hongkong and Macao and analysis that takes these regions into consideration would provide a more comprehensive and accurate understanding of the PRD megacity region.
Indonesia, China, and other developing countries in Asia are at the epicenter of world urbanization. During the next 30 years most of the world's population growth, urbanization, and economic development will occur there. These countries have the greatest need for urban and regional planning – particularly in the enormous Jakarta-Bandung, Pearl River Delta, Yangtze River Delta, and JingJinJi megacity regions and emerging megacity regions in India, Pakistan, the Philippines, and Vietnam. Population growth, rural-urban migration, expansion of urban land areas, peri-urbanization, impacts of globalization, transportation and communications improvements, and technological change provide enormous opportunities, but also pose enormous challenges for these countries. Understanding how networks of cities within megacity regions are changing is essential information for planning at the national, regional, city, and sub-city scale. It can contribute to better infrastructure planning, planning of the locations of economic development zones, and decisions about investments that can contribute to more efficient urban structure, greater efficiency, higher GDP, and more sustainable, livable, and equitable societies. The information on changes in China's Pearl River Delta's economic structure and the city system in PRD presented in this article makes a contribution to this important topic. The methodology we used can be applied to other megacity regions in Asia and worldwide. The information on the PRD can help planners and policy makers in Indonesia, China, Asia and elsewhere in formulating plans and policies for developing megacity regions.
Acknowledgement
The author thanks Tongji professor Richard LeGates for his advice and comments on this paper.