
Introduction
Since the reform and opening-up, especially after China's accession to the WTO in 2002, China's economic development has been increasingly concentrated in large cities, which dominate most national resources. As socialism with Chinese characteristics has entered a new era, the 19th National Congress of the Communist Party of China pointed out that the contradictions of our current society have changed from "the contradiction between the increasing material and cultural needs of the people and backward social production" to "the contradiction between the people's increasing demand for a better life and unbalanced development". As the direct space carrier of national economic development, cities, especially those with geographical advantages, usually experience such processes as factor aggregation, scale expansion and city rank transition. And then, they drive the development of surrounding areas and becomes the engine of economic development of the whole region and even the whole country. Especially in the eastern coastal area represented by the Yangtze River Delta city region, the evolution of the regional spatial structure reflects the past economic growth pattern of our country, which also exposes the problems of insufficient development and imbalance. With the approval of the state council in 2017, the new round of the Yangtze River Delta city cluster development plan pointed out that several underdeveloped areas, Northern Jiangsu, Southern Zhejiang, and Anhui Province, were added to the Yangtze River Delta, which makes the problems of insufficient development and imbalance in the region even more prominent.
In order to alleviate urban disease, it is clearly required to control the size of the permanent population, while controlling the growth of construction land to zero or negative in super cities such as Beijing and Shanghai. In this process, the scale agglomeration effect in regional spaces changes from megacities to the city-region led by megacities, whose further development should be supported by advanced inter-regional transport infrastructure systems. In China, the high-speed railway undoubtedly plays the role of regional 'aorta', enabling the efficient connection of various functional units within the global city-region led by world-class megacities to become a closely connected life entity.
In China, high-speed railway (hereinafter referred to as HSR) is usually defined as an EMU train with a design speed of more than 250 km/h and an initial operating speed of not less than 200 km/h. The success of Beijing-Guangzhou's trial operation in December 9, 2009 presented China's official entry into the 'HSR era'. Since then, China has witnessed rapid development of HSR in 2012, when China's HSR operating mileage was 9,356 kilometers. By 2016, China's HSR operating mileage was over 22,000 kilometers, accounting for 65% of the global HSR operating mileage. At the same time, China's HSR industry also experienced a rapid development period: before 2007, the industry related to HSR was basically monopolized by the European and Japanese markets; during the period from 2007 to 2009, China CRRC Corporation Limited accounted for 28 percent of the global market share, almost the same as Germany, Japan and France. By 2016, the global market share of China automobile groups was nearly 70%, far exceeding the traditional manufacturing countries such as Germany, Japan and France (Error!
Reference source not found.). Considering the increasingly mature development of China's HSR, it is undoubtedly an effective way to know regional spatial structure and clarify the correlation between regional cities through studying the urban network formed by HSR. In view of this, based on the urban network of HSR, this paper interprets the spatial structure characteristics of the Yangtze River Delta city-region, which is one of the three major cities in China, and then compares the characteristics of the HSR network with the HSR networks in Ring-Bohai city-region and Guangdong-Guangxi city-region. Finally, in combination with the development background of relevant urban agglomerations, a possible future regional spatial optimization strategy is discussed.
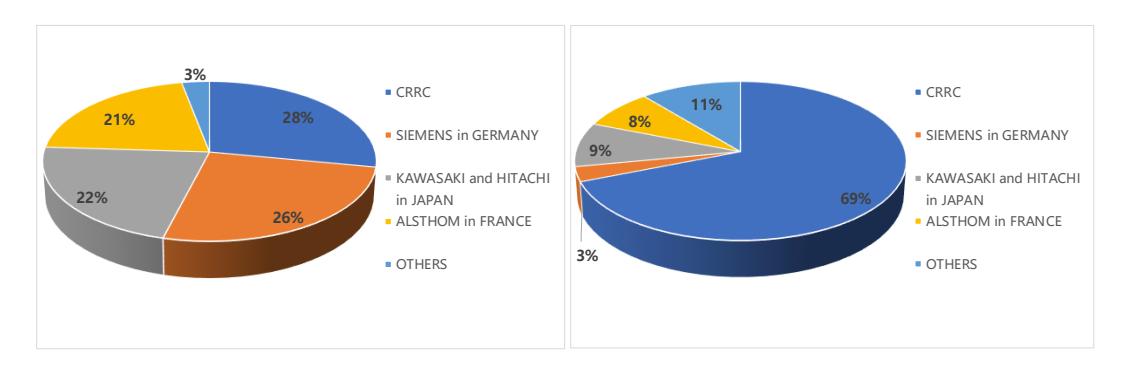
Figure 1. 2007-2009 and 2014 world market share of major HSR manufacturers.
Related Research Review
Some scholars have summarized the research trends of foreign studies on the relationship between HSR and regional economic development and found that the research in foreign academic circles mainly focused on the motivation of HSR development, the influence characteristics of regional economic development, and the influence mechanism (Jia Shanming, Cheng Lin, 2014). For example, Andersson (2010) analyzed the impact of HSR accessibility on the housing market in Taiwan. Through empirical studies in Europe, Gutiérrez analyzed the influence of HSR on location, economic potential, accessibility and other aspects, and predicted a future accessibility index (1996, 2001) and so on.
In recent years, domestic academic circles have also shown considerable enthusiasm for academic research on HSR networks, which is mainly reflected in empirical research focused on the following aspects: firstly, the role and influence of HSR on economic, industrial and employment development. For example, some scholars have conducted empirical studies on the influence of HSR on ties between tourism and economy at national and regional levels (Huangtai, ET, 2014; Wandegen, ET, 2016, Guo Jianke, ET, 2016); Dong Yanmei ET (2016) made an empirical analysis of the employment effect of HSR construction based on data from 285 Chinese cities; Rough (2013) analyzed the economic impact of HSR on China through scenario analysis and a mathematical model. Secondly, the ability of HSR to shape regional spatial patterns involving regional and urban aspects. For instance, using the HSR train shift, Luo Zhendong (2015) analyzed the regional spatial structure of the Yangtze River Delta city-region; Dong Tongbin (2017) analyzed the influence of HSR economy on regional pattern shaping in Pearl river delta region; taking the Beijing-Shanghai HSR as an example, Yu Tao (2012) discussed the characteristics and mechanism of urban suburbanization in China.
Based on relevant research experience and methods, this paper describes the regional spatial structure evolution of the Yangtze River Delta region under the influence of the high-speed
railway, including the overall characteristics of the network, the division of major metropolitan areas, and the division of urban hinterland areas of different cities. Moreover, as an extension of the existing research on the time section, assisted by a comparison of Guangdong-Guangxi and Ring-Bohai area, this paper enriches the empirical research on the existing urban network system.
Analysis of Network Development Characteristics in Yangtze River Delta City-Region
The Yangtze River Delta (hereinafter referred to as YRD) city-region is one of the three major city clusters in China and is the most active region in China's market economy. The rapid development of the YRD city-region has made great contributions to China's economic boom. According to the scope of the latest round of YRD planning, the YRD city-region includes a total of 26 cities in 3 provinces, Jiangsu, Zhejiang and Anhui Province, and 1 municipality, Shanghai. According to the classification standard of Chinese cities in 2014, Shanghai is a super city, while Nanjing, Soochow and Hangzhou are mega-cities, Changzhou, Hefei, Wuxi are Ⅱ-type large cities. In addition, there are 10 Ⅱ-type large cities, and other 9 medium-sized cities. In 2015, the urbanization rate of the permanent resident population in the 26 cities in the YRD was 69.3%.
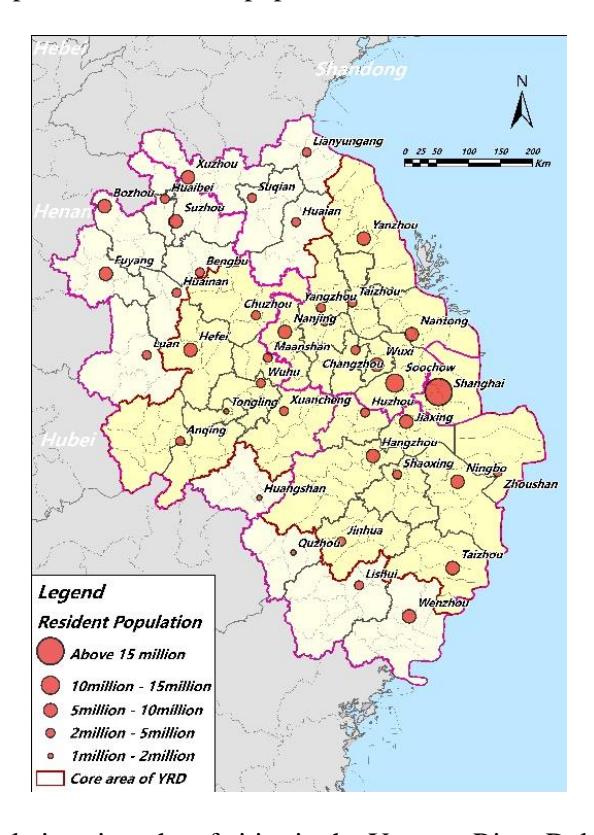
Figure 2. Population sizes the of cities in the Yangtze River Delta area in 2015.
According to the experience of developed countries and urbanization, the urbanization rate of Shanghai (87.6%) and Nanjing (81.4%) has reached more than 80% and entered the level of developed countries. The total resident population of this area is 156 million, accounting for for 11.4% of the whole nation, and its GDP is 1.36 billion Yuan, accounting for 20.1% of the whole nation. When viewed as an economy, in terms of population size and economy size, the YRD city-region is already on par with many countries in the world. For example, GDP in YRD is slightly higher than that of India, the 7th largest economic entity in the world, and has a population
comparable to Bangladesh, the world's 8th -largest country in population in 2015. In China, especially in the large urban agglomerations in the east, the population density is relatively high, which is greatly different from the United States and other developed countries with less population in vast territories. The experience of Europe and other high-density residential areas shows that the connection of people and logistics between cities cannot be carried out only on highways. The actual situation of high population density in developing countries such as China, Indonesia and so on decides that HSR should be selected as the main means of transportation to connect cities efficiently within urban agglomerations so it plays a crucial role in influencing regional development pattern.
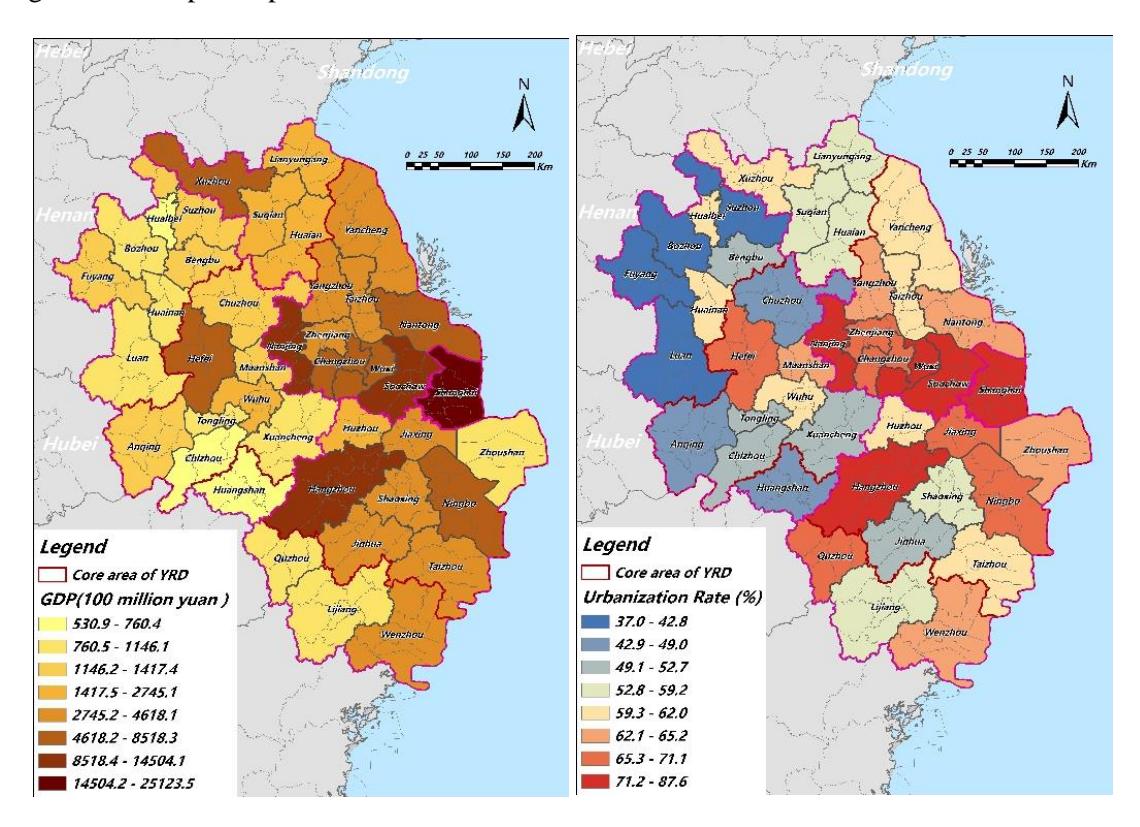
Figure 3. GDP and urbanization rate of cities in Yangtze River Delta in 2015.
Research Scope and Index Selection
This study mainly focused on the 26 cities designated in the development planning of the Yangtze River Delta urban cluster (2017) and the research perspective was extended to the whole area of 3 provinces and 1 municipality.
As of December 2017, 35 prefecture-level cities in this area have opened high-speed trains. Among them, the prefecture-level cities in the YRD, except island cities like Zhoushan and Yancheng, have all opened HSR lines. The research unit was divided into districts and counties, and for megalopolises (such as Shanghai, Nanjing, Hangzhou, etc.), it was divided into urban areas and suburbs. According to this, the YRD area can be divided into 146 research units, among which 94 units own HSR lines, accounting for 77% of the units with HSR in the whole region.
According to relevant research experience, as the HSR shift is regulated by market demand, it can reflect the relative relationship of people flows between cities in a relatively real way. HSR
services between two cities were obtained from the official website of the Chinese railway ministry (www.12306.cn) on December 25, 2017. Network analysis was conducted according to the following indicators:
Network Correlation Degree
In this study, the network was constructed on the data of HSR shifts, in the following way.
Firstly, \(S_{ij}\) is defined as service P from the departure in city I to the destination in city J, \(S_{ji}\) is defined as service from Q the departure in city J to the destination in city I. \(T_{ij}\) are all HSR services from the departure in city I to the destination in city J. Related to these definitions we have the following equations:
\[T_{ij} = \sum_{1}^{m} S_{ij} = \sum_{p=1}^{m} \tag{1}\]
\[T_{ii} = \sum_{1}^{n} S_{ii} = \sum_{a=1}^{n} \tag{2}\]
Network correlation between two cities, \[V_{ii}\] or \(V_{ii}=T_{ii}+T_{ii}\) (3)
Network Density
Network density is used to represent a close degree of connection between nodes in the network, and the network density of the whole network was used for calculation. The higher the density of the whole network, the greater the impact of the network on economic units and the closer the connection between each economic unit. Related to this we have the following equation:
\[D = \frac{\sum_{i=1}^{k} \sum_{j=1}^{k} T_{ij}}{k(k-1)} \tag{4}\] where D is the density of the whole city network, k is the number of nodes, and \(T_{ij}\) is the correlation between cities I and J.
Center Degree and Center Potential
Centrality is used to measure the ability of influence and control of one city in the urban network. For an oriented city network, a node has an in-degree, \(I_i\), and an out-degree, \(O_i\). The former is used to distinguish the ability of city I as a central control factor, while the latter represents the capacity of city I as a platform or hinterland (Alderson and Beckfield, 2004). The sum of the two is the central degree \(C_i\) of city I. The calculation formula is as follows:
\[I_i = \sum_{i=1}^k T_{ij} \tag{5}\]
\[O_i = \sum_{j=1}^k T_{ji} \tag{6}\]
The central potential is used to express the overall degree of integration or consistency of the network. Its value is between 0 and 1. The closer to 0, the more uniform the distribution. The closer to 1, the more centralized the network power, and the more unbalanced the network structure. The calculation formula is as follows:
\[C = \frac{\sum_{i=1}^{k} (c_{imax} - c_i)}{\max \sum_{i=1}^{k} (c_{imax} - c_i)}\](7)
According to the above indexes, a 94*94 matrix of the HSR network in YRD city-region was constructed, as shown in the following table.
Table 1. OD matrix of HSR network in YRD city-region (Top 10).
| Departure | Nan jing | Shang hai | Hang zhou | Soo chow | Wu -xi | Chang zhou | Wen zhou | Zhen jiang | He fei | Ning -bo | … … |
|---|---|---|---|---|---|---|---|---|---|---|---|
| Destination | … | ||||||||||
| Nanjing | 221 | 104 | 185 | 169 | 145 | 36 | 123 | 83 | 37 | … | |
| Shanghai | 213 | 138 | 190 | 176 | 108 | 45 | 112 | 51 | 57 | … | |
| … … | |||||||||||
| Hangzhou | 105 | 133 | 29 | 28 | 18 | 82 | 18 | 30 | 99 | … | |
| Soochow | 179 | 212 | 31 | 165 | 101 | 15 | 107 | 48 | 18 | … | |
| … … | |||||||||||
| Wuxi | 171 | 183 | 26 | 178 | 93 | 13 | 106 | 48 | 15 | … | |
| Changzhou | 102 | 156 | 24 | 151 | 142 | 12 | 55 | 27 | 13 | … | |
| … | |||||||||||
| Wenzhou | 38 | 44 | 82 | 14 | 15 | 10 | 8 | 11 | 65 | … … | |
| Zhenjiang | 112 | 127 | 20 | 121 | 114 | 102 | 9 | 33 | 10 | … | |
| … | |||||||||||
| Hefei | 84 | 54 | 29 | 57 | 51 | 43 | 10 | 41 | 13 | … … | |
| … | |||||||||||
| Ningbo | 43 | 52 | 96 | 18 | 16 | 11 | 64 | 11 | 14 | … | |
| … | … | ||||||||||
| … | … |
Development Characteristics of HSR Network in YRD City-region
Compared with 2015, the overall characteristics of the HSR network in the YRD city-region have significantly changed (Error! Reference source not found.). The maximum connection strength is still between Shanghai and Nanjing (434) and is much higher than that of 2015 (342). Taking the 15%, 40% and 60% of maximum value as breakpoints, the connection degree between cities was divided into 4 gradients. At the same time, the network center of the city was divided into 5 gradients according to the maximum number of shifts in each city (downtown of Nanjing, 4687) of 5%, 15%, 40% and 60% as the breakpoints. Firstly, it is not only convenient to compare and analyze with previous studies but also to highlight the first degree of contact network status.
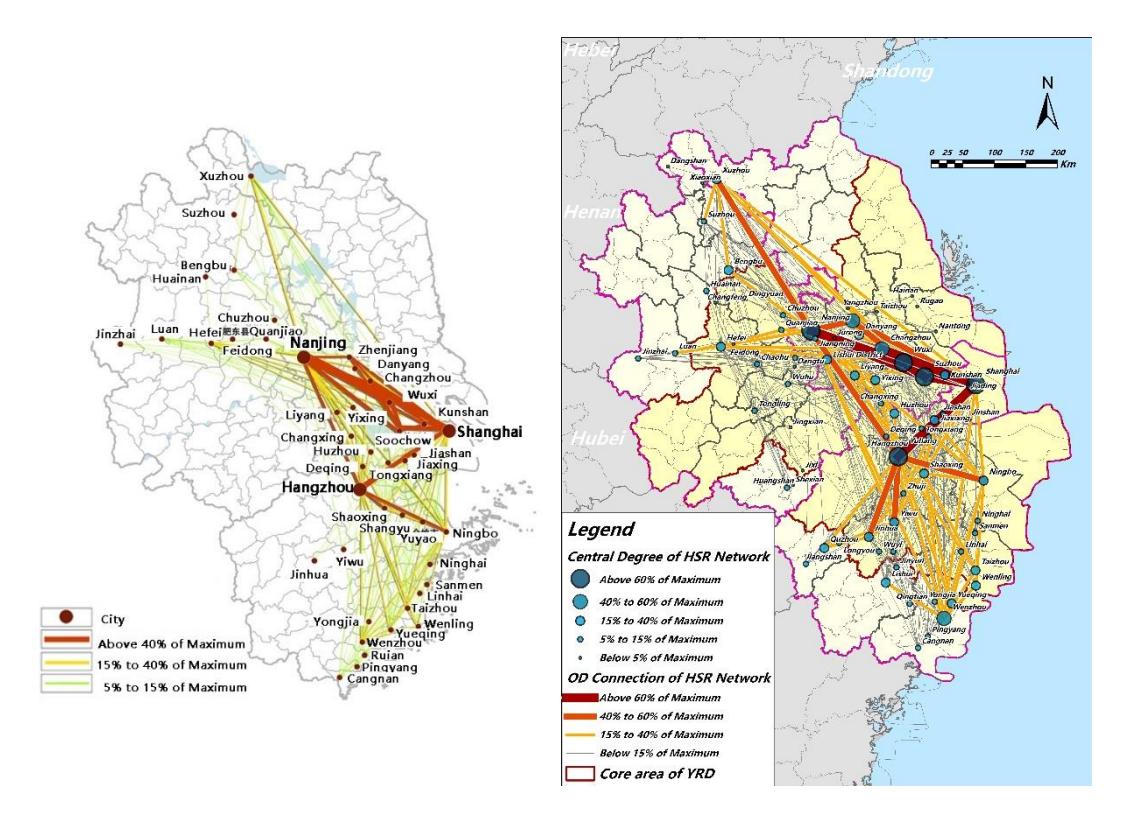
Figure 4. Connection evolution of HSR network in YRD city-region in 2015 and 2017 (left graph, from Luo Zhendong, 2015) and 2017 (right graph, drawn by the author).
Nanjing-Shanghai-Hangzhou-Ningbo Core Area: Prominent Network Status
The Nanjing-Shanghai-Hangzhou-Ningbo Z-shaped corridor is most the active zone of exchange for economy, people and other links in the YRD city-region; the region's top 20 rankings are distributed in this corridor.
Apart from the first link between Shanghai and Nanjing, the links between Shanghai-Soochow (402), Nanjing-Soochow (364), Shanghai-Wuxi (359), Wuxi-Soochow (343), Nanjing-Wuxi (340), etc., represent that the top connections according to network correlation in YRD are basically on the line Ningbo-Shanghai.
Due to topography and landform, the HSR corridor in Zhejiang is not as developed as that in Jiangsu province. The links between Shanghai and Hangzhou (271) are ranked seventh, followed by the links between Hangzhou- Ningbo (195), Hangzhou-Yiwu (191), and Hangzhou-Jiaxing (185).
The calculation of central degree also proves the above characteristics. The regional central degree of Nanjing, Shanghai, Soochow-Wuxi-Changzhou and other regions is relatively high, which respectively indicates that Nanjing, Shanghai and the areas under the influence of the Nanjing metropolitan circle, the Soochow-Wuxi-Changzhou metropolitan circle and other regions have strong ability to organize regional traffic (Error! Reference source not found.).
Periphery Corridor: Evolution from Linear Space to Flat Network
With the continuous improvement of HSR corridor construction, compared with 2015, the development process of the peripheral corridor in the YRD city-region is more prominent. The corridor has evolved from the original peripheral linear space to the flat network, and the ability of network control in the core region has obviously been extended.
Firstly, in the corridor of southwest Zhejiang province, the correlations between Hangzhou-Yiwu and Hangzhou-Jinhua have skyrocketed from 12 to 191 and 179. The regional network correlation is significantly higher than that in 2015, and the secondary network around the region has gradually been developed. Periphery areas such as Quzhou and Lishui also show significant signs of integration into the planning circles of YRD.
In addition, although Anhui province still shows relatively weak features in the whole network, the construction of the HSR corridor has improved markedly. There were only 4 prefecture-level cities opening HSR in 2015, while by 2017, in all 8 Anhui cities in the YRD city-region have HSR. The accessibility of Anhui province as a peripheral region and the core corridor in YRD will be improved obviously and the connection between the core and the periphery will be increasingly strong.
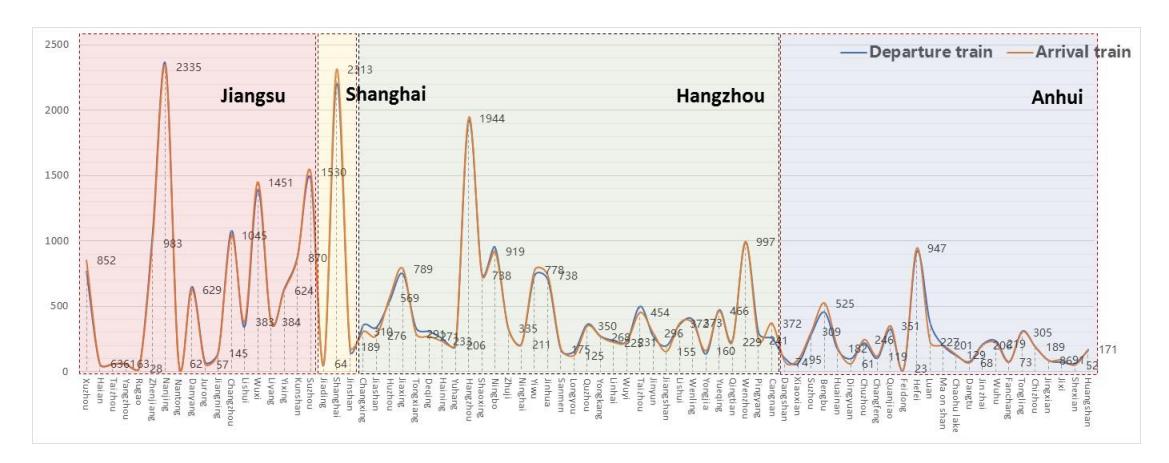
Figure 5. Comparison of network centers of cities in Jiangsu, Shanghai, Zhejiang and Anhui.
Division of Major Metropolitan Influence Areas
Taking the shortest transit time from one city to another via HSR, the metropolitan influence areas of major cities in the YRD city-region were divided, and six cities, i.e. Shanghai, Hangzhou, Nanjing, Hefei, Soochow and Ningbo, were selected for further investigation.
Compared with ordinary railway corridors, the construction and opening of HSR corridors have expanded the one-hour area of major cities significantly (Error! Reference source not found.). Especially in a two-hour metropolitan areas, the straight distance for spatial accessibility of several large cities were increased by more than 2 times.
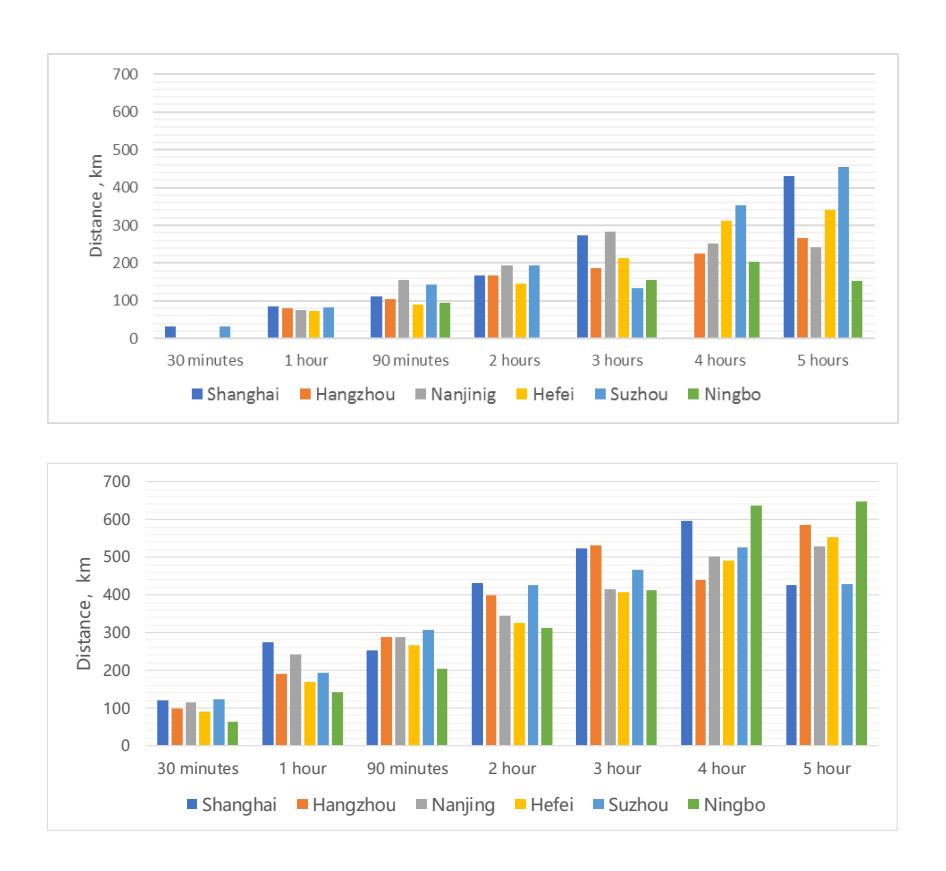
Figure 6. Comparison of network centers of cities in Jiangsu, Shanghai, Zhejiang and Anhui.
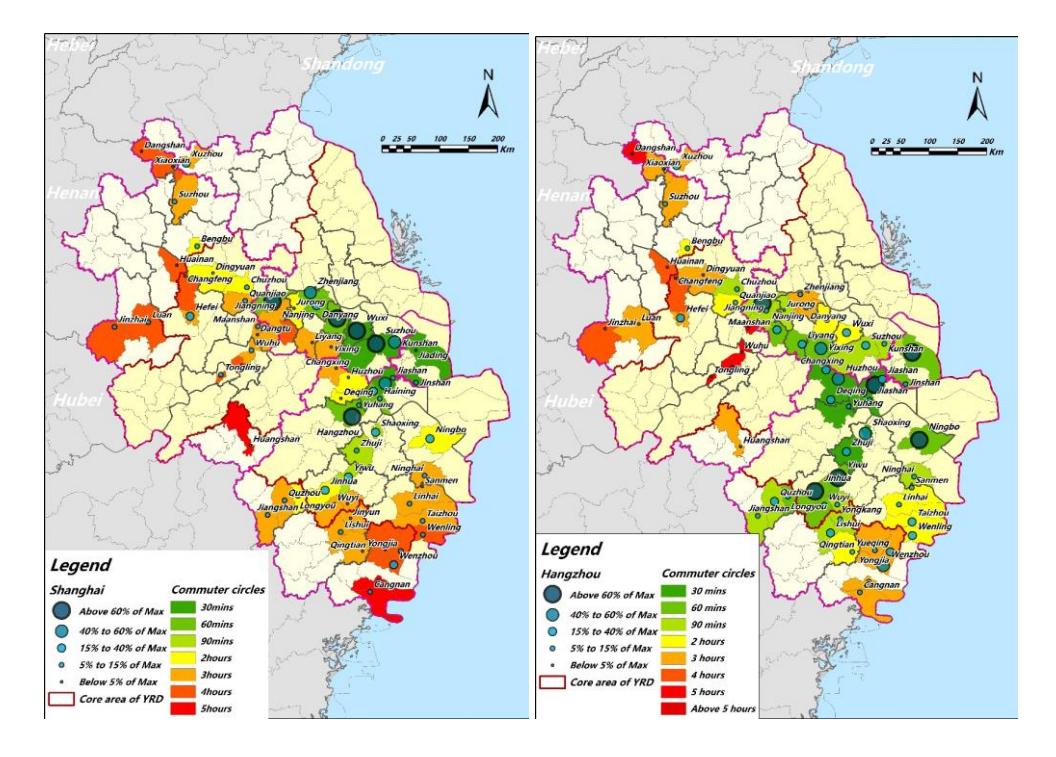
Figure 7. The metropolis influence area of Shanghai and Hangzhou based on the HSR network.
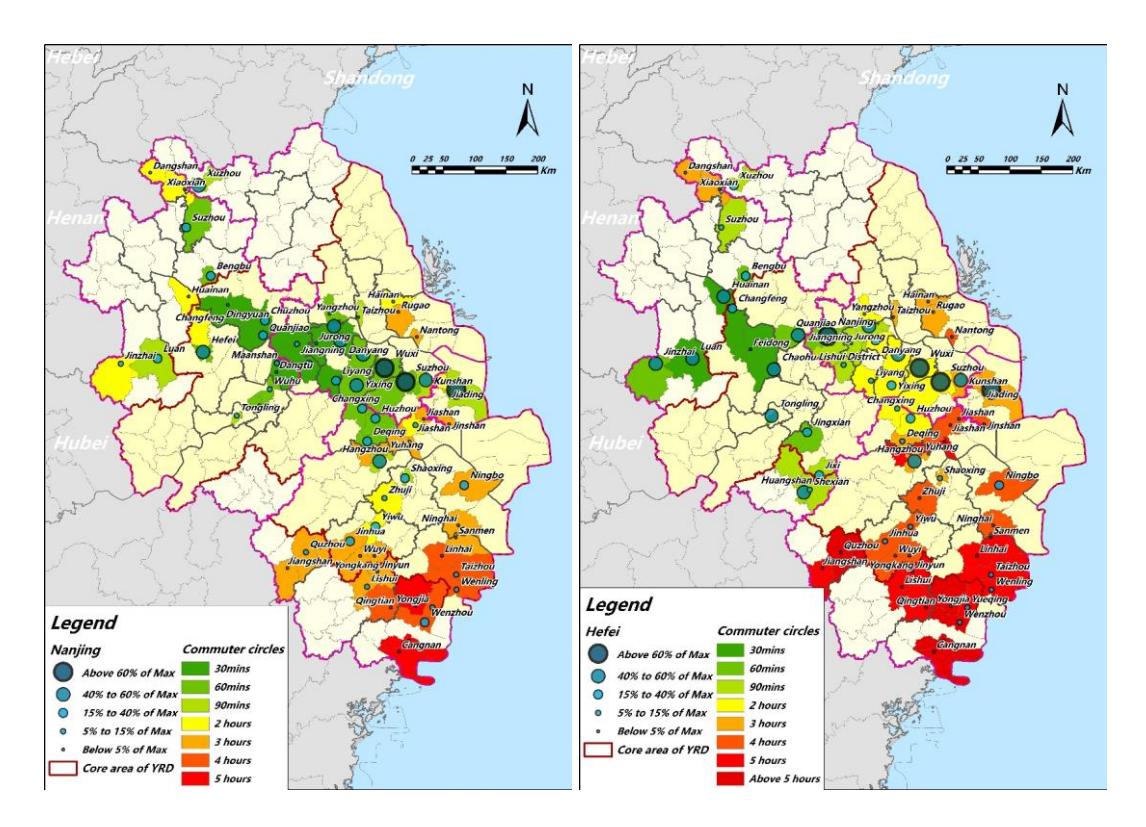
Figure 8. The metropolis influence area of Nanjing and Hefei based on the HSR network.
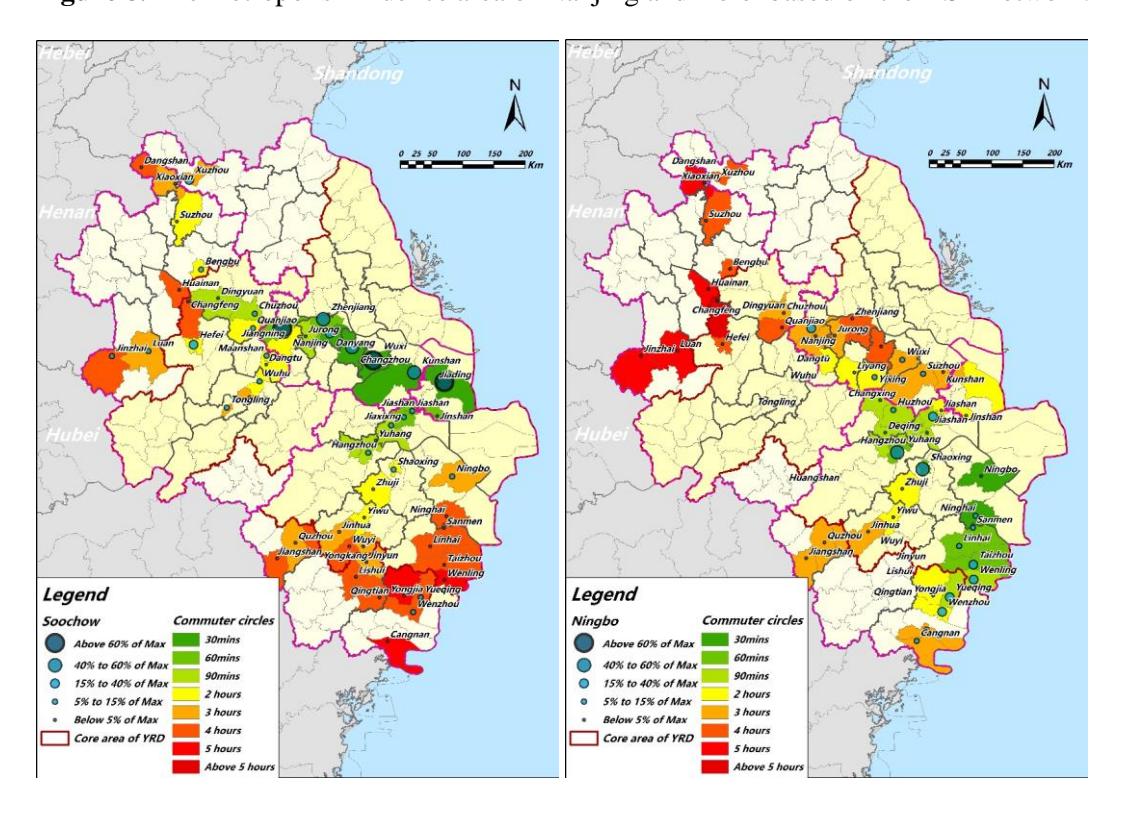
Figure 9. The metropolis influence area of Soochow and Hangzhou based on the HSR network.
Division of Urban Hinterland Area in YRD City-Region
The urban hinterland area in the YRD city-region was divided by the number of daily HSR services between cities, with the following classification criteria:
For a city i, (1) the total number of departures from city j to city i, Tji, is the highest number of departures among all cities to city i; (2) the maximum number of departures is more than 10% higher than that of the second city p to city i, and we can then define that city i is located in the urban hinterland area in the YRD city-region, so that the urban hinterland area in the YRD cityregion could be drawn in this research.
In the YRD city-region, there are big differences between urban hinterland areas and other indicators, such as the degree of center and the degree of correlation. The distributions of network influence are interlaced with each other. First of all, the influence struggle area is quite large, concentrated on the Nanjing-Shanghai HSR line, indicating strong integration characteristics of the subregion. Secondly, there are obvious enclaves in the influence circle of some cities, such as Nanjing and Shanghai. Thirdly, the influence circle in peripheral areas, such as Hefei and Ningbo, is more concentrated.
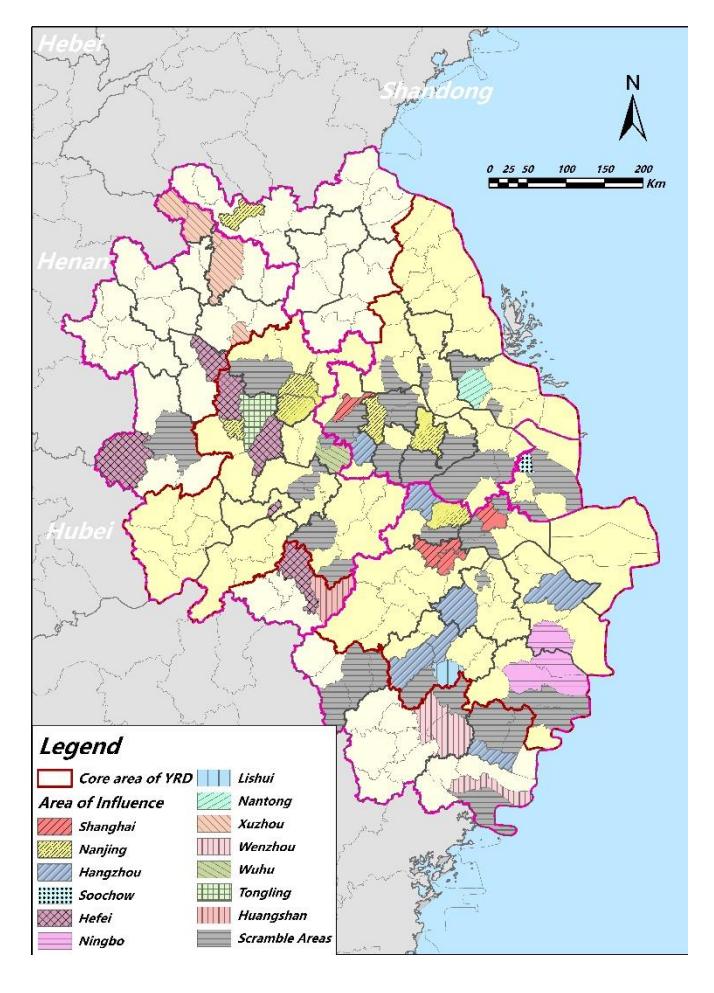
Figure 10. Division of urban hinterland area based on HSR travel in the YRD city-region.
Comparison with the Characteristics of the Ring-Bohai and Guangdong-Guangxi City-Region
Using the same method, the HSR network was built for two other major city-regions, Guangdong-Guangxi and Ring-Bohai. In the Guangdong-Guangxi region there is a pretty strong coreperipheral spatial structure and the most closely connected region is undoubtedly the core area, including Guangzhou, Shenzhen, Foshan, Huizhou and other bay area cities, presenting a trend of linear extension from the core area to eastern Guangdong-Guangxi (Error! Reference source not found.).
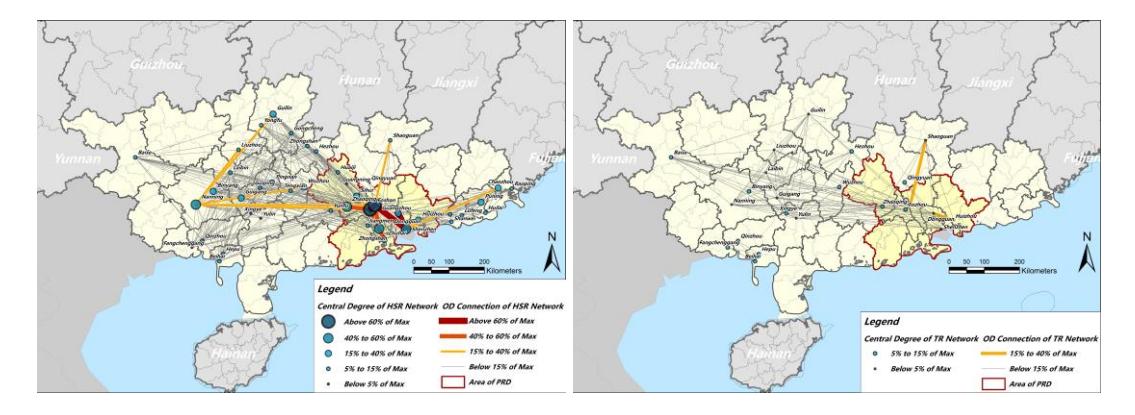
Figure 11. HSR network correlation (left) and general railway network correlation (right) diagram for the Guangdong-Guangxi region.
In the Ring-Bohai region there is a strong core-peripheral spatial structure as well, for the reason that the regional network is greatly influenced by the administrative division and there are relative long distances between the high-level cities. Therefore, the network in this region also shows a core coastal corridor, the Shenyang-Beijing-Tianjin-Jinan-Qingdao corridor. However, the overall network still has more obvious hierarchical features, with higher railway frequency, and the network flattening still needing to be strengthened. (Error! Reference source not found.).
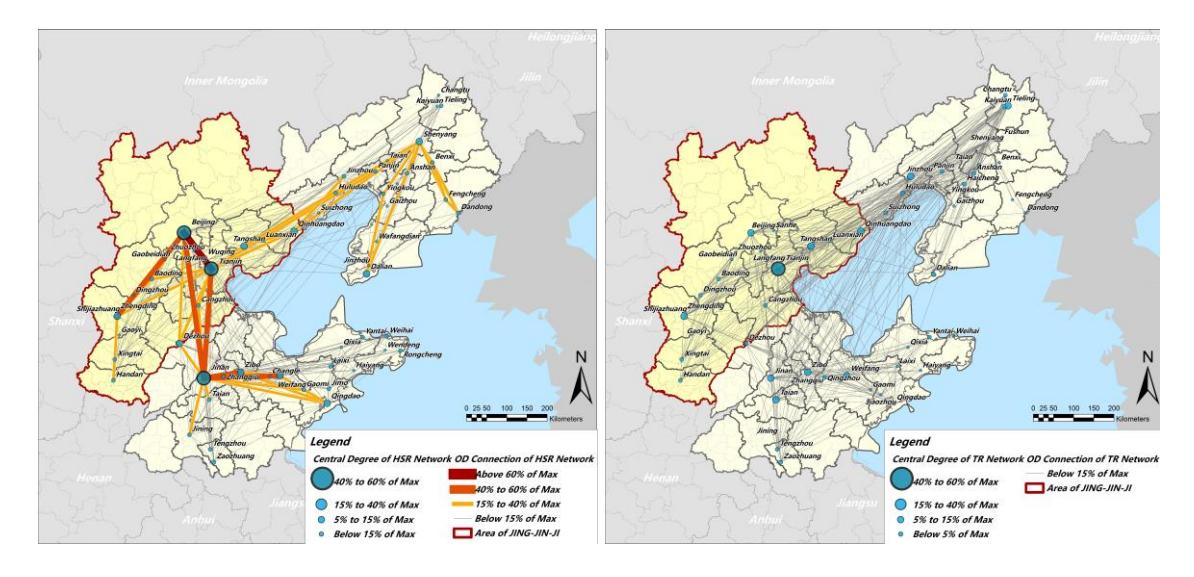
Figure 12. HSR network correlation (left) and general railway network correlation (right) diagram for the Ring-Bohai region.
The overall network characteristics in the 3 city-regions were compared by using two indicators, network density and network central potential. In terms of network density, YRD is in the middle between the Ring-Bohai and the Guangdong-Guangxi region, while its residual difference is significantly smaller than that of the Guangdong-Guangxi region, showing a more balanced feature; The network central potential of YRD is only 6.95%, which is not only less than the 8.92% of the Ring-Bohai region, it is also far below the 20.86% of the Guangdong-Guangxi region.
| Index Region | Network density | Network density Std Dev | Centralization Index | |
|---|---|---|---|---|
| Yangzi Delta | 10.9626 | 19.8546 | 6.95% | |
| Ring-Bohai | 8.97 | 14.6008 | 8.92% | |
| Guangdong and Guangxi | 15.4347 | 33.3798 | 20.86% | |
Table 1. Network index in three regions.
Summary and Prospect
In this study, the regional spatial structure of the YRD city-region was reinterpreted using data from HSR services. The main conclusions are as follows:
- (1) Person exchange in the area along the Shanghai-Nanjing-Hangzhou-Ningbo corridor is still the most frequent in the YRD city-region. As time goes by, its core status is continuously strengthened, which improves the element flow in the whole area.
- (2) As an important junction of the Beijing-Shanghai and Shanghai-Nanjing lines, Nanjing has a higher network status than Shanghai. Nanjing is not only an important part of the core of the YRD area but also an important engine driving the development of Anhui and other places. Meanwhile, Shanghai has promoted the development of regional integration through the rapid transition of its own city functions.
- (3) The development of a peripheral corridor has been further improved, which makes the networking features of the YRD city-region increasingly diversified and the regional network structure increasingly mature.
- (4) The construction of the HSR has brought greater external accessibility. The one-hour metropolis, represented by core cities such as Shanghai, Nanjing and Hangzhou, has expanded significantly, and the spatial and temporal distance of the region has been compressed.
- (5) A comparative analysis with Ring-Bohai region and Guangdong-Guangxi region showed that the YRD region has the most balanced spatial development structure among China's three largest urban agglomerations, showing its good regional integration process.
This paper took the HSR network in the YRD city-region as an example to explore the regional spatial reorganization under major infrastructure construction. The rise of Shanghai as a world city not only further strengthens its status as a regional core city, but also drives the coordinated development of surrounding areas, making the whole area more diversified and balanced. Moreover, each major city has its own specialized division of labor and regional transportation organization function. Integration in the YRD area can be objectively shown in the change of characteristics of the HSR network through the adjustment to market demand.
For the first-mover regions, the economic, cultural and political exchanges between cities have become more and more frequent, and the collision of various 'flows' has accelerated the process of regional integration. For latecomers, the link to the HSR network may lead to further outflow of its own elements, while it also forces its own role in the process of regional integration, which is beneficial to the construction of its own urban places and the professional division of labor.
As an urban agglomeration aiming at world class, the YRD area still has a strong potential in its future economic and population development. In the process of the transformation of China's regional spatial development centers from megacities to megacity-regions, the infrastructure network constructed by HSR will undoubtedly further reshape and strengthen the network characteristics of the YRD region, which will continue to play an important role, and also provide an important method and measure for subtopics such as the governance of metropolitan areas in the process of building a more balanced urban agglomeration.