
Introduction
Intention to leave a place to move to a better place is an attitude that is suspected to be caused by dissatisfaction with the living environment (Amérigo & Aragones, 1997). Assessment of satisfaction towards an environment (residential satisfaction) is used to determine to what extent housing and settlements can meet one's needs to achieve one's goals. These assessments are subjective, based on people's perceptions.
Currently, particularly in developing countries, housing construction grows uncontrollably and causes overcrowding. This can cause dissatisfaction with the residential environment, which encourages the intention to move. However, the fact is that some communities persist in environments that are overpopulated. This phenomenon occurs in Medan Belawan District, one of the most populous districts in Medan City. Based on the Central Bureau of Statistics (BPS), in the year of 2017, the population in Medan Belawan District was 116,616 people (BPS, 2018). This number was 98,167 in 2016, which means an increase of around 18%. However, even though dissatisfaction towards one's residence is the main predictor for determining intention to move, there is no explicit correlation between the mediating variable of residential satisfaction and mobility (Liao, 2004).
In this case, the bond to the place acts as one of the factors that influence people's attitude or behavior. That bond is formed because of the relationship between individuals and the neighborhood. A person's relationship to their environment is often discussed in the scope of place identity (Lalli, 1992; Proshansky, Fabian, & Kaminoff, 1983) and place attachment (Hidalgo & Hernández, 2001; Low & Altman, 1992). However, this study focused on place attachment.
There is still limited research that reveals the correlational relationship between place attachment as mediating variable towards residential satisfaction and intention to move, particulary in Indonesia. Place attachment strongly influences the level of satisfaction of one's residence (Amérigo & Aragones, 1997; Zenker & Rütter, 2014). This preliminary study explored the element of residential satisfaction affecting the formation of place attachment and intention to move. The results can be used in urban planning as a basis for setting regional development priorities.
Literature Review
Residential Satisfaction
Assessment of residential satisfaction is used as an approach to measure the sustainability of a city or of urban liveability (Pacione, 1990; Zhan et al., 2018), which is defined as urban quality of life and individual well-being associated with the local environment (Zhan et al., 2018). The measurement of residential satisfaction is carried out by comparing the actual and the expected quality of an urban environment from the perspective of community satisfaction. In previous studies, residential satisfaction has been used as an approach for assessing place quality (Ayataç
& Türk, 2009; Pacione, 1990), determining behavioral trends (Amérigo & Aragones, 1997), understanding the mobility of residents (Amérigo & Aragones, 1997; Galster, 1987), and measuring quality of life in relation to residential environment (Amérigo & Aragones, 1997; Shoeibi et al., 2015).
Residential satisfaction influences positive or negative attitudes and behaviors. Positive attitudes due to residential satisfaction could be life satisfaction (Zhang, Zhang, & Hudson, 2018); adjustment (Hidalgo & Hernández, 2001); word-of-mouth behavior (Chen, Dwyer, & Firth, 2018; Zenker & Rütter, 2014); and pro-environmental behavior (Ramkissoon, Smith, & Weiler, 2013). Meanwhile, attitudes towards a place that arise due to dissatisfaction with housing conditions and environment quality can refer to negative attitudes as well as intention to move (Andersen, 2008; Kearns & Parkes, 2003; Morris, Winter, & Murphy, 1988; Widiastomo, 2014); stress (Campagna, 2016); and feeling crowded (Bonnes, Bonaiuto, & Ercolani, 1991).
Residential satisfaction is a multidimensional concept that is generally assessed using both micro and macro focus. The micro focus assesses satisfaction with residential occupancy (Huang, Du, & Yu, 2015; Zhang et al., 2018). Meanwhile, the macro focus includes environmental conditions (De Vos, Van Acker, & Witlox, 2016) and neighbor relationships (Amérigo & Aragones, 1997). However, previous studies tended to assess satisfaction separately, focusing only on one dimension. Furthermore, limited studies have been done that discuss residential satisfaction as a whole dimension. Moreover, the three dimensions influence each other (Ginsberg & Churchman, 1984).
Residential satisfaction is influenced by several factors, i.e. the characteristics of the physical environment (De Vos et al., 2016); the socioeconomic status of the residents (Faridah, 2014); interaction with neighbors (Amérigo & Aragones, 1997); psychological feelings such as feeling crowded (Bonnes et al., 1991; Campagna, 2016) and privacy. Meanwhile, studies related to residential satisfaction in Indonesia tended to assess micro focus, such as the study of resident satisfaction towards housing and environmental quality (Syafrina et al., 2018; Widiastomo, 2014); public housing or apartments (Setiadi, 2015); and satisfaction with living in certain residential regions (Faridah, 2014; Widiastomo, 2014).
Place Attachment
A place is formed by physical form, activity, and meaning (Canter, 1997). Meaning is closely related to one's psychological and social processes and influences one's perception of a place (Ujang, 2012). Theories related to the formation of meaning in a place are generally discussed in the fields of environmental psychology, tourism, and place branding. The theory of one's relationship with a place is based on place identity (Lalli, 1992; Proshansky et al., 1983) or place attachment (Hidalgo & Hernández, 2001; Low & Altman, 1992; Ujang, 2012). The main focus of this study was place attachment.
Place attachment is a cognitive bond that is formed by someone's experience with a particular place (Hidalgo & Hernández, 2001). Place attachment consists of two dimensions, namely a physical and a social dimension. The physical dimension (rootedness or physical attachment) is an attachment to environmental attributes. On the other hand, the social dimension (social bonding/attachment) refers to the social bonds that are created with other people, such as friends and relatives (Hidalgo & Hernández, 2001). In a previous study, several dimensions of place attachment were measured, namely place identity, place dependence, affective attachment, social bonding, place memory, place expectation, and place satisfaction (Chen et al., 2018).
Place attachment is seen as a mediating variable in determining intended behavior such as the behavior of word-of-mouth promotion of touristic destinations (Chen et al., 2018; Zenker & Rütter, 2014); pro-environmental behavior (Ramkissoon et al., 2013); and intention to move (Zenker & Rütter, 2014).
Intention to Move
Residential mobility is the process of adjustment of a household's housing and changes in its housing needs over the life cycle (Morris et al., 1988). The attitude of staying somewhere or moving to another place is a decision that happens when residents have or do not have a living environment that matches their expectations (Pacione, 1990). Researches that have addressed residential satisfaction and residential mobility are limited in number (Andersen, 2008). Kearns & Parkes (2003) explained that there is a relationship between desire to move and dissatisfaction with occupancy, surrounding environment, and social relations. The environmental characteristics include security, environmental health, accessibility, and public facilities (Kearns & Parkes, 2003). Moreover, dissatisfaction with the environment (neighbor disturbances, drug dealing, vandalism) can make people want to move (Andersen, 2008).
Besides that, a negative reputation of a neighborhood based on outsiders' assessment can also have a positive effect on the desire to move (Andersen, 2008). A negative reputation toward a place will not affect one's satisfaction or dissatisfaction but can directly cause someone to want to move (Andersen, 2008). Furthermore, socio-economic status (Andersen, 2008) and emotional bonding (Liao, 2004) also play a role in the decision to move.
Several previous studies have directly examined the relationship between residential satisfaction and intention to move. Residential satisfaction was taken as an independent variable and intention to move as a dependent variable. By using control variables, Morris et al. (1988) found that high residential satisfaction produces a propensity to make alterations or additions to their housing and reduces the intention to move. Similar to this previous study, Widiastomo (2014) investigated the influence of residential satisfaction (housing and environment quality) and intention to move at Bukit Sendangmulyo Housing. He found that environmental quality has a more significant effect on intention to move than housing quality. In contrast, Sakina & Kusuma (2017), who examined the same correlation in student housing, found that housing satisfaction has greater influence on intention to move than environmental quality. In contrast to the two previous findings, Ginsberg & Churchman (1984), who examined the correlational relationship between apartment owners in multi-family buildings of different heights, found that both residential satisfaction and intention to move are not necessarily different expressions of the same attitude. Someone may be satisfied with his/her living environment but still intend to move or may be dissatisfied and not intend to move.
Other the hand, a recent study (Zenker & Rütter, 2014) examined the relationship between residential satisfaction and intention to move with a mediating variable regarding the bond with a place that influences a person's attitude or behavior. This study indicated that residential satisfaction strongly influences attachment in residents and directly decreases their intention to move. Studies that have examined this relationship are still limited. Therefore, the current study examined the correlational relationship between residential satisfaction and intention to move with place attachment as mediating variable. We formulated the following hypotheses:
H.1 There is a negative relationship between the dimension of residential satisfaction and intention to move. The more satisfied a person, the less the intention to move.
- H.2 There is a positive relationship between the dimensions of residential satisfaction and place attachment. The place attachment level will be higher along with a higher residential satisfaction.
- H.3 There is a negative relationship between place attachment and intention to move. The higher the place attachment, the lower the intention to move.
Methodology
Study Area
This preliminary research took place in Medan Belawan District, Medan, which consists of six sub-districts (kelurahan), namely Belawan Pulau Sicanang, Belawan Bahagia, Belawan Bahari, Belawan I, Belawan II, and Bagan Deli. Medan Belawan Subdistrict is directly adjacent to the Melaka Strait to the north, and Medan Labuhan District to the south. Meanwhile, in the west and east, Medan Belawan Subdistrict is bordered by Deli Serdang Regency (see Figure 1).
Medan Belawan District is a northern suburb of Medan City. The majority of the population living there are middle to lower income people. Belawan is an economically strategic area due to its location directly adjacent to the Malacca Strait. Some residential areas are located along the Medan-Belawan railway line and in the seaside area. In addition, international ports serving passengers and cargo are also located in Belawan.
Medan Belawan District was chosen for the case study because it is a densely populated slum area. In view of the research goal, it was necessary to assess the subjective level of residential satisfaction instead of an objective assessment. The result of this study was expected to provide recommendations for how to upgrade slum areas and to act as a reference for setting development priorities. However, the sample used in this study was only 119 respondents. Thus, the sample is not fully representative of the population of Medan Belawan District. In addition, the questionnaires were not distributed equally in each village. Moreover, low-income people do not have the opportunity of finding more affordable housing and not all respondents had adequate knowledge to assess their environment due to a lack of education. These were the limitations of this study.
Figure 1. Research location.
Source: Urban Land-use Plan (RTRW) of Medan City for the year 2010-2030
Methodology
A research method is required to be able to answer the research questions. This study used a mixed-method approach (Creswell, 2011). A mixed-method approach can be used to reduce bias. In the first stage, a qualitative research was conducted to explore the factors that influence residential satisfaction and dissatisfaction. Then, in the second stage, an explanatory quantitative research was conducted to confirm the key items resulted from the qualitative stage.
In the qualitative stage, a questionnaire survey was distributed both online and directly to residents to find out their perceptions of the quality of their homes and environment. The grounded theory approach with open-ended questions was used to let the respondents answer freely. Data collection was done from 5-18 September 2018. Selection of samples was carried out by non-random sampling with a snowball sampling technique, namely by asking respondents who had filled out the questionnaire to distribute it to others (Kumar 2005). A total of 100 respondents were asked to write down the reasons why they were satisfied/dissatisfied with living in the Medan Belawan District.
The text data collected from the open-ended questionnaire were analyzed by categorizing the represented keywords (content analysis). The results of content analysis indicated that residential satisfaction/dissatisfaction is influenced by physical aspects (availability of infrastructure; healthy environment; accessibility and urban transportation; affordability of house) and non-physical aspects (social relations; crime and security; economic capacity; convenience; and human resources) (Widya et al., 2019). This study examined residential satisfaction both according to a micro focus (house) and a macro (residential environment).
In the quantitative stage, the keywords obtained from the qualitative stage (content analysis) were redeveloped based on a study of the theory. A literature study was conducted to compare the elements of residential satisfaction. To the nine indicators of residential satisfaction from the results of the content analysis one indicator was added, namely 'recreation and tourism' based on theoretical study (Shoeibi et al., 2015; Zenker, 2011). In general, the questionnaire was divided into four sections. The first section consisted of 11 items related to the socio-economic situation and the demographics of the respondents. The second section dealt with residential satisfaction in 10 categories with 74 measured variables. The third section continued with place attachment. Referring to Chen et al. (2018), there are seven categories of place attachment with 15 measured variables. In the last section, three questions represented the measured variable of intention to move (Zenker & Rütter, 2014). The measured variables can be seen in Appendix 1.
The next stage of data collection used closed-ended questions. These questions were compiled using a Likert scale of 1-5, which provides "continuous" response options to questions with assumed equal distances between options (Table 1). On the other hand, some researchers consider the Likert scale as an ordinal scale due to the unequal distances. This different perspective would influence statistical tests later. In considering Likert-scale as interval scale, Creswell (2011) suggested to develop choices in the scale and establish the distance between each value on the scale is equal. This consideration is also supported by the previous research cited in this study (Chen et al., 2018; Zenker & Rütter, 2014; Campagna, 2016). Referring to Creswell (2011) and the prior research conducted previously, thus the current research treats Likert-scale as an interval scale.
The questionnaire was distributed online and directly in the field from 17 October to 4 November 2018. Of the 130 questionnaires that were completed, 119 were analyzed. From the results of the questionnaires that were used (n = 119), the majority of respondents were aged 18- 24 years (43%), followed by 37% aged 25-39 years. The respondents were dominated by women (66%) compared to men (34%). The majority of respondents lived in Belawan II (n = 39) and Bagan Deli (n = 29). More than half of the respondents were students (n = 51) followed by housewives (n = 33).
| Variable | Scale | ||||||
|---|---|---|---|---|---|---|---|
| Residential | Availability of sewer/drainage channel | ||||||
| satisfaction | Very dissatisfied | 1 | 2 | 3 | 4 | 5 | Very satisfied |
| Satisfied because I was born in Belawan | |||||||
| Place attachment | Strongly disagree | 1 | 2 | 3 | 4 | 5 | Strongly agree |
| I would be happy to move from Belawan | |||||||
| Intention to move | Strongly disagree | 1 | 2 | 3 | 4 | 5 | Strongly agree |
Table 1. Example question with Likert-scale .
Furthermore, the numerical data from each variable were analyzed quantitatively with factor analysis (FA). FA was conducted by principal component analysis (PCA) and varimax rotation to get the latent variables that represent the measured variables. The measured variables included aspects of residential satisfaction (10 categories); place attachment (7 categories); and intention to move. The measured variables were reduced to a number of latent variables that represented most of the variance of the main principle components. The number of latent variables representing each measured variable was based on a scree plot. A sharp slope between one latent variable and the next latent variable indicates that the number of latent variables is still growing. The number of latent variables stops growing when the curve starts to slope downward. In determining the latent variable's name, the measured variables that had a loading score of < 0.5 were considered not to have a significant role so these were ignored in the formation of the latent variables. Moreover, multivariate analysis was performed to reveal the correlational relationships between the latent variables.
Results and Discussion
Residential Satisfaction
PCA was performed on the measured variables of residential satisfaction. The satisfaction component was divided into two aspects. PCA was carried out separately between the physical and the non-physical aspects of residential satisfaction to make it easier for the researchers to name the latent variables. For the physical aspects of satisfaction, five principal components were obtained from the PCA results. Furthermore, the principal components were analyzed by FA using the varimax rotated component method.
The results of FA (latent variables) represent 48 measured variables with a total variance of 52.44% (Table 2). Meanwhile, five latent variables were obtained from the results of FA analysis of physical aspects of residential satisfaction, i.e. accessibility, environmental health, availability of infrastructure, housing affordability, and availability of public facilities.
Table 2. Factor analysis of residential satisfaction – physical aspects.
| Measured Variables | Mean | Factor Loading | Eigen Value | % of variance | Cum % | Cronbach's Alpha |
|---|---|---|---|---|---|---|
| Factor 1: Accessibility | 3.07 | 13.51 | 28.148 | 28.14 | 0.89 | |
| Accessibility related to public | ||||||
| transportation | 3.34 | 0.73 | ||||
| Accessibility related to school | 3.34 | 0.67 | ||||
| Distance to workplace | 3.05 | 0.65 | ||||
| Availability of internet/telephone network | 3.19 | 0.64 | ||||
| Availability of electricity network | 3.12 | 0.64 | ||||
| Accessibility related to market | 3.46 | 0.60 | ||||
| Intensity of passing vehicles | 2.36 | 0.60 | ||||
| Proximity to city center | 2.77 | 0.59 | ||||
| Accessibility related to hospital/clinic | 3.43 | 0.53 | ||||
| Availability of parking space | 2.49 | 0.53 | ||||
| Factor 2: Environmental Health | 2.20 | 4.53 | 9.455 | 37.60 | 0.86 | |
| Noise | 2.17 | 0.80 | ||||
| Air pollution | 2.31 | 0.71 | ||||
| Animal pest | 2.05 | 0.69 | ||||
| Housing density | 2.28 | 0.66 | ||||
| Rubbish | 1.83 | 0.65 | ||||
| Chaotic housing | 2.16 | 0.63 | ||||
| Water pollution | 2.18 | 0.61 | ||||
| Land pollution | 2.55 | 0.60 | ||||
| Traffic congestion | 2.33 | 0.54 | ||||
| Factor 3: Availability of Infrastructure | 2.84 | 2.90 | 6.25 | 43.85 | 0.89 | |
| Quality of drink water | 2.90 | 0.67 | ||||
| Availability of drink water | 2.82 | 0.64 | ||||
| Road width | 3.04 | 0.64 | ||||
| Availability of water supply | 2.90 | 0.56 | ||||
| Condition of road surface | 2.96 | 0.54 | ||||
| Factor 4: Housing Affordability | 3.15 | 2.30 | 4.803 | 48.65 | 0.91 | |
| Adequacy of the number of indoor spaces | 3.18 | 0.83 | ||||
| Physical resistance of the house | 3.02 | 0.82 | ||||
| Bathroom inside | 3.37 | 0.77 | ||||
| Availability of yard/garden | 3.18 | 0.76 | ||||
| Size | 3.05 | 0.75 | ||||
| Factor 5: Availability of Public Facilities | 2.70 | 1.81 | 3.79 | 52.44 | 0.75 | |
| Availability of recreational facilities | 2.44 | 0.73 | ||||
| Availability of sports facilities | 2.59 | 0.71 | ||||
| Availability of tourist attraction | 2.70 | 0.66 | ||||
| Availability of sewage drainage | 2.31 | 0.63 |
Meanwhile, related to the non-physical aspects of residential satisfaction, 26 measured variables were represented by five latent variables, representing 65.59% of the data (Table 3). The latent variables were: social solidarity, environmental security, social cohesion, economic capacity, and territoriality.
Table 3. Factor analysis of residential satisfaction – non-physical aspects.
| Measured Variables | Mean | Factor Loading | Eigen Value | % of variance | Cum % | Cronbach's Alpha |
|---|---|---|---|---|---|---|
| Factor 1: Social Solidarity | 2.81 | 7.77 | 29.87 | 29.86 | 0.88 | |
| Community participation | 2.65 | 0.83 | ||||
| Community motivation | 2.82 | 0.81 | ||||
| Natural environment | 2.80 | 0.74 | ||||
| Convenience of the environment | 2.90 | 0.72 | ||||
| Mutual cooperation | 2.93 | 0.66 | ||||
| Convenience of the climate | 2.90 | 0.64 | ||||
| High-quality of society | 2.81 | 0.54 | ||||
| Factor 2: Environmental Security | 2.01 | 3.98 | 15.30 | 45.16 | 0.89 | |
| Gambling | 1.75 | 0.86 | ||||
| Networking of drug users | 1.70 | 0.86 | ||||
| Prostitution | 1.97 | 0.83 | ||||
| Juvenile delinquency (brawl) | 1.98 | 0.82 | ||||
| Crime (robbery, theft) | 1.89 | 0.79 | ||||
| Outdoor security at night | 2.35 | 0.58 | ||||
| Natural disaster threat | 2.49 | 0.58 | ||||
| Factor 3: Social Cohesion | 3.50 | 2.20 | 8.45 | 53.61 | 0.81 | |
| Social tolerance among neighbors Interaction and communication among | 3.51 | 0.87 | ||||
| neighbors | 3.41 | 0.77 | ||||
| Diversity of ethnic/cultural/religious | ||||||
| communities | 3.81 | 0.77 | ||||
| Pleasant atmosphere | 3.30 | 0.53 | ||||
| Factor 4: Economic Capacity | 3.08 | 1.88 | 7.22 | 60.84 | 0.79 | |
| Life fulfillment | 3.14 | 0.85 | ||||
| Employment status | 3.13 | 0.83 | ||||
| Monthly income | 2.97 | 0.77 | ||||
| Homeownership status | 3.39 | 0.67 | ||||
| Factor 5: Territoriality | 2.98 | 1.23 | 4.74 | 65.59 | 0.10 | |
| Privacy | 3.42 | -0.58 | ||||
| Driving safety | 2.55 | 0.52 |
The latent variables of residential satisfaction, both physical and non-physical, were in accordance with satisfaction factors from a previous study (Buys & Mill 2012), which examined factors that influence residential satisfaction in high-density urban areas in Australia. The evaluation of these assessments consisted of current dwelling, environmental conditions, and social relations (Buys & Miller, 2012). Meanwhile, Zhan et al. (2018) divided satisfaction into six factors. However, these factors did not include satisfaction with dwelling. On the other hand, the housing characteristics dramatically influence the level of satisfaction (Huang et al., 2015; Zhang et al., 2018). A comparison of recent findings can be seen in Table 4.
Table 4. Comparison of residential satisfaction factors.
| Residential Satisfaction | |||
|---|---|---|---|
| Zhan et al. (2018) | Buys & Miller (2012) | Huang et al. (2015) | Current findings |
| Natural environment - Favorable climate - Access to urban parks - Access to water area | Environmental conditions - Accessibility | Neighborhood characteristics - School (access to nearby school) - Environment sanitation | Accessibility - Accessibility related to public transportation, school, market, hospital/clinic - Distance to workplace - Availability of internet/telephone network, electricity networks - Intensity of passing vehicle |
| Urban security - Social security - Transport security - Emergency shelters | - Security | - Proximity to the city center Environmental security - Gambling - Networking of drug users - Prostitution - Juvenile delinquency (brawl) - Crime - Outdoor security at night | |
| Convenience of public facilities | - Public facilities | - Natural disaster threat Availability of public facilities - Availability of recreational facilities, sports facilities, tourist attraction, sewage drainage | |
| Convenient transportation - Urban road conditions - Access to public transit - Availability of parking space | - Transportation convenience | Availability of infrastructure - Quality of drink water - Availability of drink water & water supply - Road width - Condition of road surface | |
| - Traffic congestion Environmental health - Pollution (water, solid, air, and noise) | - Noise - Smell - Pollution | Environmental health - Pollution (water, land, air, and noise) - Animal pest - Housing density - Chaotic housing - Rubbish - Traffic congestion | |
| Dwelling - Facilities - Maintenance - Size - Cost - Design - Natural environment - Location - Weather - Environmental | Housing Characteristic - House area - Building age - Decoration - Floor evaluation - Noise insulation - Daylight | Housing affordability - Adequacy of the number of indoor spaces - Physical resistance of the house - Bathroom inside - Availability of yard/garden - Size |
| Residential Satisfaction | |||
|---|---|---|---|
| Zhan et al. (2018) | Buys & Miller (2012) | Huang et al. (2015) | Current findings |
| management | |||
| Sociocultural | Social relations | Social solidarity | |
| environment - High-quality | - Social interaction | - Community participation & motivation | |
| citizens | - Natural environment | ||
| - Social inclusion - Urban identity | - Convenience of the environment | ||
| - Protection of | - Mutual cooperation | ||
| historical culture | - Convenience of the climate | ||
| - High-quality of society | |||
| Social cohesion | |||
| - Social tolerance & interaction and communication with neighbors | |||
| - Diversity of ethnic/cultural/religious communities | |||
| - Pleasant atmosphere | |||
| Economic capacity | |||
| - Life fulfillment | |||
| - Employment status | |||
| - Monthly income | |||
| - Homeownership status | |||
| Territoriality | |||
| - Privacy & driving safety |
Place Attachment
Generally, the overall place attachment value was 3.08. From the FA results, two latent variables could represent seven categories of place attachment (Chen et al., 2018). The first latent variable, namely functional attachment, had a total variance of 45.55%, which represents six measured variables (Table 5). In the first latent variable, the measured variables tend to compare one place with another place. This comparison is formed through perceived significance related to the physical and functional quality of the place (Ujang, 2012), or related to activity and purpose (Lin & Lockwood, 2014). This is what causes a person to feel dependent on a place. Williams & Roggenbuck (1989) use the term functional attachment to describe place dependence.
Meanwhile, the measured variables of the second latent variable tended to involve memories and knowledge. This is cognitive attachment, with a total variance of 8.54%. In the present study, the term cognitive attachment is used for the accumulation of memories and prior knowledge, leading to perception, recognition, and identification towards a place. This cognitive process requires time and is processed rationally, which is definitely different from an affective process (fast response) (Gregory et al., 2012). Meanwhile, the categories of Lin & Lockwood (2014) place attachment into three dimensions, i.e. affective, functional, and cognitive. Lin & Lockwood (2014) define affective attachment as a social bond with settings that involves memories and spontaneous associations. Moreover, cognitive attachment is explained as an intellectual attachment created through historical knowledge and association (Lin & Lockwood, 2014). At the same time, Liao (2004) uses the term emotional attachment for the concept of cognitive attachment used in this article.
Measured Variables Mean Factor Loading Eigen Value % of variance Cum % Cronbach's Alpha Factor 1: Functional Attachment 2.86 6.83 45.55 45.55 0.85 I prefer to live in Belawan compared to other places (COMPARISON) 2.82 0.86 There is no other place I want to live in other than Belawan (COMPARISON) 2.82 0.81 Belawan is truly meaningful to me (MEANING) 3.03 0.79 I have an emotional attachment to Belawan (ATTACHMENT) 2.86 0.63 Many of my friends/family prefer to live in Belawan compared to other places (COMPARISON) 2.82 0.59 Factor 2: Cognitive Attachment 3.23 1.28 8.54 54.09 0.86 I can recognize Belawan strongly (RECOGNITION) 3.53 0.75 I am satisfied because I have lived in Belawan for a long time (LONG STAY) 3.29 0.72 My experience during staying in Belawan is unforgettable (POSITIVE EXPERIENCE) 3.34 0.69 I am satisfied with my life in Belawan (SATISFACTION) 3.07 0.64 Belawan fulfills my needs well (SATISFACTION) 3.08 0.64 I am satisfied because I was born in Belawan (BIRTHPLACE) 3.31 0.62 My memory in Belawan makes me feel more in love with this place (LOVE) 3.20 0.56
Table 5. Factor analysis of place attachment.
The findings of the FA place attachment are in line with Lin & Lockwood (2014), although there are some differences in defining cognitive attachment. In contrast, Ujang (2012), who examined the level of place attachment in a shopping street in Kuala Lumpur, Malaysia, found that people can have functional and emotional attachment. That bond will bind the people and place in shared activity.
Intention to Move
The FA of three measured variables of intention to move resulted in two latent variables, namely mismatch and opportunities elsewhere with a total variance of 94.06% (Table 6). In this finding, mismatch refers to the interest of moving to a better place. Mismatch is a reaction when someone cannot meet the needs of his/her household in a certain environment. Meanwhile, the second latent variable represents the opportunities elsewhere.
It is essential to view housing adjustment as a decision-making process about either to move or to make changes in the current dwelling (Morris et al., 1988). When a family's housing does not meet their needs and norms, a conflict will exist. Morris et al. (1988) state that this conflict can be removed by changing the household (adaption), changing the house/environment (adjustment), or moving to a new residence. The current findings support the statement of Morris et al. (1988). Mismatch is an accumulation of not feeling adapted to his or her dwelling and environment, and trying to adapt by bringing harmony in the environment. Meanwhile, the opportunities elsewhere is a reaction when the conflict is impossible to resolve, leading to the plan of finding a new residence.
| Measured Variables | Mean | Factor Loading | Eigen Value | % of variance | Cum % | Cronbach's alpha |
|---|---|---|---|---|---|---|
| Factor 1: Mismatch | 3.22 | 2.47 | 82.53 | 82.53 | 0.90 | |
| Other places are much more appealing than Belawan (INTEREST IN OTHER PLACES) | 3.39 | 0.90 | ||||
| I would be happy to move from Belawan (PREFERENCE OF MOVING) | 3.15 | 0.85 | ||||
| Factor 2: Opportunities Elsewhere | 3.30 | 0.34 | 11.53 | 94.06 | ||
| Other places have more opportunities than Belawan (INSUFFICIENT OPPORTUNITIES) | 3.30 | 0.92 |
Table 6. Factor analysis of intention to move.
The Correlational Relationship
After the data were analyzed by FA, multivariate correlation analysis was conducted to find the correlations between the latent variables. In a causal relationship, the independent variable precedes the dependent variable. Referring to this principle, it cannot be determined which dimension takes precedence between residential satisfaction and place attachment. However, intention to move is a result of dissatisfaction and low place attachment, which is supported by previous research (Zenker & Rütter, 2014). Residential satisfaction and place attachment are predictors of a person's attitude or behavior towards a place. Therefore, in this study, residential satisfaction and place attachment were selected as independent variables while intention to move was selected as dependent variable.
Table 7. Multivariate correlation analysis between residential satisfaction, place attachment, and intention to move.
| Independent variables | Dependent variables | Functional Attachment | Cognitive Attachment | Mismatch | Opportunities Elsewhere |
|---|---|---|---|---|---|
| Accessibility | 0.295** | 0.276** | 0.050 | 0.051 | |
| Environmental health | ! | 0.487*** | 0.031 | -0.268** | -0.186 |
| Availability of infrast | ructure | 0.002 | 0.225* | -0.043 | -0.199* |
| Housing affordability | -0.111 | 0.186 | 0.118 | 0.118 | |
| Availability of public | facilities | 0.030 | 0.229* | -0.117 | -0.068 |
| Social solidarity | 0.485*** | 0.164 | -0.111 | -0.050 | |
| Environmental securi | ity | 0.199* | 0.006 | 0.071 | -0.183 |
| Social cohesion | -0.056 | 0.346*** | -0.045 | 0.124 | |
| Economic capacity | -0.029 | 0.429*** | -0.127 | -0.040 | |
| Territoriality | 0.028 | -0.041 | -0.014 | 0.035 | |
| Functional attachmen | ıt | 1 | 0 | -0.329** | -0.127 |
| Cognitive attachment | 0 | 1 | -0.268** | -0.240* |
Note: *p < 0.05. **p < 0.01. ***p < 0.0001
The correlation between all latent variables can be seen in Table 7. From the results of the analysis, residential satisfaction directly affects functional attachment and cognitive attachment, respectively. However, residential satisfaction does not affect intention to move directly. Therefore, our first hypothesis is not fully confirmed. In this case, functional attachment and cognitive attachment are mediating variables of mismatch and opportunities elsewhere. This finding is consistent with previous findings (Zenker & Rütter, 2014) that residential satisfaction is the main predictor affecting place attachment as mediating variable or an intervening variable of intention to move. Similar to these studies, Liao (2004) found that residential satisfaction does not affect intention to move directly. Emotional attachment, social-economic background (educational, household income, age) and proximity to working space tend to affect intention to move.
To simplify the analysis, we developed a model that represents the multivariate correlation analysis (Figure 3). It can be seen that environmental health (r = -0.27; p < 0.01) has a strong direct influence on mismatch. Environmental pollution, housing density, and traffic congestion cause a person to feel uncomfortable and not homey. Furthermore, previous studies revealed that higher levels of air pollution and noise significantly reduced subjective well-being (Zenker & Rütter, 2014) as well as caused stress (Campagna, 2016) and crowding (Bonnes et al., 1991). Environmental quality more encourages intention to move compared to quality of the dwelling. This result is in line with the findings of Widiastomo (2014).
Meanwhile, physical and non-physical aspects of residential satisfaction affect place attachment, both functional and cognitive (Figure 3). This explanation supports the second hypothesis, i.e. residential satisfaction has a positive impact on place attachment. This finding is in line with (Zenker & Rütter, 2014). As shown in Figure 3, functional attachment tends to be influenced by the latent variables environmental health (r = 0.49; p < 0.0001); social solidarity (r = 0.49; p < 0.0001); and accessibility (r = 0.30; p < 0.01). Functional attachment is closely related to activities or purposes that are bound to a place (Lin & Lockwood, 2014; Williams & Roggenbuck, 1989). This can be in the form of accessibility related to public facilities and public transportation and proximity to the city center (Fried, 1982; Lin & Lockwood, 2014). Besides the physical dimension, the social dimension, in this case social solidarity, also influences the level of place attachment (Hidalgo & Hernández, 2001). People are bound to a place if their relationship with the community is well established. This relationship will further strengthen the community's commitment to making its environment more agreeable. Looking further into this, it turns out that the three latent variables affecting functional attachment are elements of basic needs in supporting daily activities.
The results of the analysis show that functional attachment (r = -0.33; p < 0.01) has a negative influence on mismatch (figure 3). Functional attachment refers to a person's functional bond to a place. This bond is formed when a place provides the conditions and features needed to meet one's needs (Anton & Lawrence, 2016; Ujang, 2012). This will make someone dependent on to that place in conducting activities and social interaction (Ujang, 2012). In this case, if a place no longer meets the individual's needs, the dependence on the area will decrease. A sense of mismatch or even finding a better alternative place will arise along with the feeling of incomplete need fulfillment. On the other hand, the existence of an environment with wellmaintained and complete facilities and infrastructure will make people feel at home so that their tendency to move will be smaller (Widiastomo, 2014).
On the other hand, cognitive attachment has a strong correlation with economic capacity (r = 0.43; p < 0.001), social cohesion (r = 0.35; p < 0.001); and accessibility (r = 0.28; p < 0.01) (Figure 3). These three latent variables represent a person's requirements for survival. Satisfaction with fulfilled basic needs and income have a positive effect on cognitive attachment. This is in line with Liao (2004), who states that satisfaction with the living environment positively affects attachment with the community. Moreover, the quality of the built environment, in this case accessibility, encourages social cohesion (Dempsey, 2009; Farahani & Lozanovska, 2014). Strong social interaction between the members of a community is believed to increase the occurrence of strong bonds and social affiliation (Farahani & Lozanovska, 2014). This bond will also have a positive influence on the sense of security.
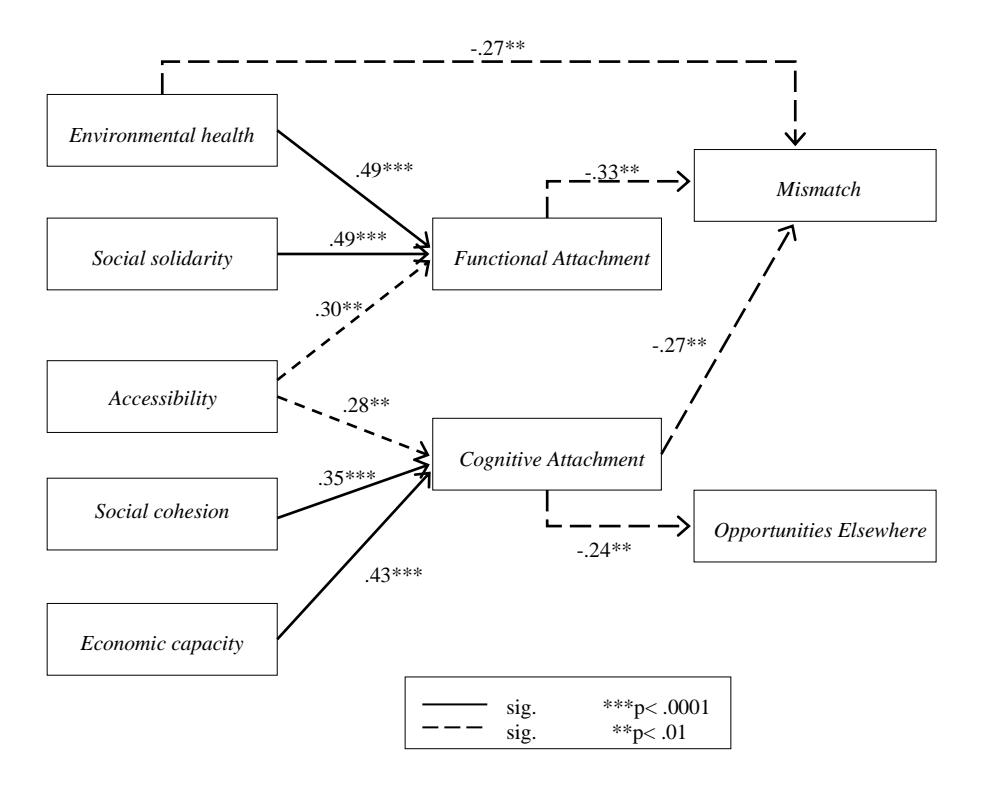
Figure 3. Diagram of correlational relationship between residential satisfaction, place attachment, and intention to move.
The results of the analysis show that cognitive attachment has a strong influence on mismatch (r = -0.27; p < 0.01) and also opportunities elsewhere (r = -0.24; p < 0.01). Cognitive/emotional attachment refers to place identity (Proshansky et al., 1983; Williams & Roggenbuck, 1989). Memories and knowledge about a place encourage people to stay in and adapt to certain places and make them reluctant to move, for example if the environment contains many memories for them.
In general, it can be concluded that low attachment to a place, both functional and cognitive, affects intention to move. This explanation supports the third hypothesis, namely the higher the place attachment, the lower the intention to move. However, intention to move is not only influenced by place attachment but also by educational and socio-economic background as revealed in a prior study (Andersen, 2008). However, in the present study, the influence of the respondents' backgrounds on their intention to move was limitedly analyzed.
Conclusion
This study revealed the correlational relationship between residential satisfaction, place attachment, and intention to move. The preliminary results showed that place attachment is the most significant predictor for intention to move. A person's attachment to a place, both functional and cognitive, has a more significant influence on intention to move compared to residential satisfaction. In this case, the quality of the environment and social ties with the environment (having family and friends nearby) dramatically reduce a person's intention to move (Andersen, 2008).
In general, intention to move is more influenced by satisfaction with the environment (macro focus) compared to satisfaction with housing features (micro focus). Residential satisfaction as independent variable encourages functional and cognitive attachment and can be increased through improving the quality of the place and providing public spaces. This will enable social interaction between the members of the community.
This study has a low level of generalization. Therefore, the researchers suggest replication of the research in future studies, taking into account the limitations of the study. By using a more significant number of samples and equal distribution of questionnaires in separate sub-districts, more representative results are expected. Besides, further research should consider the socioeconomic status of the respondents (age, education level, length of residence, homeownership status, and income) and see their correlation with their intention to move. This should be done while considering that socioeconomic status is inseparable from intention to move. Someone who rents a house tends to have a lower attachment to their dwelling place compared to someone who owns a house (Andersen, 2008). Also, low income and higher age may reduce the intention to move. Since households with low income prefer to adapt their housing even though the conditions of the house and environment do not meet their expectations (Widiastomo, 2014). This research aimed to contribute to knowledge related to residential satisfaction based on analyzing latent variables. The results can be implemented in urban planning as a basis for setting regional development priorities.