
Introduction
Entrepreneurship creates wealth by combining labor, capital and knowledge in productive use. Many studies have shown that entrepreneurship plays an important role in enhancing economic growth (Acs et al., 2004; Audretsch et al., 2002; Sobel, 2008; van Praag, 1999). Economic activities of businesses generate income as well as jobs and thus entrepreneurship is considered an essential aspect of economic development. In this respect, actions to stimulate entrepreneurship could be critical to enhance economic performance.
The relationship between economic development and entrepreneurship, however, is rather complex and dynamic, especially when considered at the regional level. In fact, a country should not be seen as a single entity. When national economic growth is high, it does not imply that all regions grow to an equal extent. Entrepreneurship is a regional phenomenon (Sternberg and Rocha, 2007), partly because some regions have better opportunities for entrepreneurs due to their environmental, demographic, economic and cultural conditions. Regions with abundant natural resources offer opportunities to enterprises that depend on the availability of raw materials. Densely populated regions provide a wide range of economic activities. Regions that have a better business climate, i.e. easy access to capital, a pool of highly skilled workers and flexible entry regulations, encourage entrepreneurship. In addition, cultural values that support entrepreneurial traditions enhance attitudes towards entrepreneurship. Therefore, analyzing entrepreneurship at the regional level is as important as analyzing it at the national level (Bosma, 2009).
It has been argued that entrepreneurs can emerge in both affluent and poorer regions. This can be explained either by supply-side or demand-side factors. On the one hand, an advanced economy provides business opportunities due to the availability of capital. Generally, consumers in wealthy regions have relatively high purchasing power, which stimulates entrepreneurship focused on business profits (Krugman & Obstfeld, 2009). Nonetheless, the opportunity cost – the expected income when someone is employed – in wealthy regions is higher, which may prevent individuals from becoming entrepreneurs. On the other hand, one characteristic of less developed regions is a high unemployment rate. The scarcity of jobs may motivate individuals to establish an enterprise or engage in other economic activities to generate income because no other options are available.
The level of economic development can also shape the type of enterprises and start-ups located in a region, i.e. sectors, business scale, and registration status (formal or informal) (Reynolds et al., 2001). One can expect a larger percentage of service-oriented enterprises in highly developed regions compared to emerging regions, while manufacturing enterprises dominate business in the latter. Large-scale businesses are probably mostly located in highly developed regions due to the relatively wide market opportunities, while small-scale economic activities are favorable in less developed regions due to for example lower capital intensity. In addition, large-scale enterprises in wealthy regions require more capital, which encourages business founders to apply for a formal business status as it is usually included as a prerequisite in loan applications. Accordingly, smallscale businesses in less developed regions may be prefer to stay informal so they do not have to pay taxes and other establishment fees (see Koster and Rai, 2008).
The relationships between economic development and entrepreneurship have been extensively studied in the context of developed countries (Leibenstein, 1968, Acs et al., 2005; Koster and Rai, 2008; Glaeser et al., 2012). Few studies on this topic have been conducted that are specifically related to developing countries (Koster and Rai, 2008; Naudé, 2010), yet many developing countries regard entrepreneurship as a cornerstone of their economic policies (Desai, 2009). Thus, studies on this subject in developing countries are needed to provide meaningful
recommendations for policy makers. With regard to this matter, and motivated by the lack of studies on this topic in developing countries, this study aimed to provide a better understanding of how regional economic development shapes entrepreneurial activities in emerging economies. In addition, this study conducted an extended analysis of entrepreneurship, in which the type of businesses was categorized based on their registration status (formal or informal). This study hopes to contribute to a better understanding of entrepreneurship issues in developing countries, especially those related to regional economic development. Indonesia was chosen as the locus of this study because as an archipelago its geographical conditions are very varied. Every island has its specific natural resources and culture, which may directly or indirectly shape the presence of economic activities in the regions.
Methodology
This research employed three types of data: business-level data, regional-level data and spatial data. The first type of data were collected through the Indonesian Economic Census (Listing Sensus Ekonomi) from 2006 by BPS-Statistics Indonesia. These include extended information on characteristics of enterprises, such as location, year of establishment, sector, registration status, and production matrix. For the purpose of this study, regional data were aggregated. It is important to mention that missing values were found for 5 out of 440 regions, i.e. Tanjung Pinang, Pontianak, Minahasa, Manokwari, and Nabire; these regions were omitted from the analysis.
The second set of data was retrieved from BPS-Statistics Indonesia and the Ministry of Home Affairs. From the first source we obtained the gross domestic product (GDP) at constant market price, population and labor force. GDP at constant market price was chosen because it reflects real changes in the economic development of the regions, whereas GDP at the current market price is biased due to inflation effects. From the second source, we used the area of the regions in square meters and the history of regional fragmentation in Indonesia. The latter plays a substantial role in matching the regional-level data with the enterprise-level data. Lastly, the current map of Indonesia was obtained from BPS-Statistics Indonesia on the basis of the population census of 2010. The spatial data contain polygons2 of the third-tier regions, i.e. municipalities (kota) and regencies (kabupaten). To enable the spatial analysis, the map was transformed from a geographic coordinate system (GCS-WGS-1994) to a projected coordinate system (DGN 1995 UTM zone 56N).
The number of regions in the regional-level data was different from that in the enterprise-level data, i.e. 495 regions and 440 regions, respectively. Thus, the first was readjusted to the second. The map was edited by merging the polygons of areas that were split after 2005 according to the original regional division. Finally, all data were merged to serve as input for ArcGIS and GeoDa.
To represent the level of entrepreneurship, this study calculated start-up rates using two approaches. The first method, the so-called labor market approach, standardized the number of new (start-up) enterprises in the respective regions relative to their labor force. Using this method, three start-up rates were computed, i.e. total start-up rate, formal start-up rate, and informal startup rate. This is expressed in the equation below,
\[Y_i = \frac{F_i}{L_i} \times 1000\] 2 This represents areas that are defined by borders (Mitchell, 1999).
where Y represents the total formal or informal start-up rates, F represents the number of enterprises that were established in 2005 and later, and L represents the number of the labor force; and the subscript i refers to the different Indonesian regions.
The second method, the ecological approach, considered the number of start-ups relative to the size of the existing population of enterprises. In other words, the number of start-ups that were established from 2005 until the census date was divided by the number of existing enterprises, which were established prior to 2004. It is important to note that the number of start-ups in these two calculations includes only the new enterprises were able to survive until the census period; thus, the actual number of start-ups could be higher.
To represent regional differences, this study employed demographic and economic data, i.e. population density, GDP at constant market price, unemployment rate diversity, and enterprise size. Population density was calculated as the number of the population in each region divided by the region's area in square kilometres. This apporach is widely used to assess the potential for positive agglomeration effects, in particular of demand effects (Armington and Acs, 2002). However, this measurement is rather weak in identifying potential spill-over effects, because it does not provide the density of similar establishments in the regions (Armington and Acs, 2002). The GDP per capita at constant market price was calculated by dividing the gross added value relative to the size of the population in the regions. Calculating the economic diversity was performed using The Global Diversity Report from Oxford Economic. The entropy index of economic diversity is defined as follows:
\[D_i = \sum_{i=1}^N S_i \ln\left(\frac{1}{S_i}\right)\] where N is the number of sectors, Si is the share of enterprises in the sector and ln is a natural logarithm. Higher entropy index values indicate greater relative diversity of entrepreneurial activities; on the other hand, lower values indicate relatively more specialization of entrepreneurial activities in each region.
Unemployment Rate
The unemployment rates were retrieved from BPS-Statistics Indonesia as collected through the Indonesian Labour Force Survey (Survei Angkatan Kerja Nasional – Sakernas). This has been widely used in previous studies (see for example, Reynolds, 1994). The expected correlation of this variable with start-ups is mixed: the unemployment rate is expected to be negatively correlated with start-ups in high-capital sectors and, conversely, it is expected to be positively correlated with start-ups in low-capital sectors. Therefore, the overall effect of the unemployment rate is indeterminate. Nevertheless, a number of studies found that a higher level of unemployment is related to a greater number of new establishments (Reynolds, 1994).
Enterprise Size
Enterprise size is a proxy for the structure of industries in a region. It is measured by the average enterprise size in the region. The size refers to the number of workers; the larger the average size, the greater the dominance by larger enterprises. Therefore, enterprise size is expected to negatively correlate with start-ups.
In addition, this study looked at three dummy variables, i.e. cityness (kota/kabupaten status), Java island (or non-Java), and mining area (or non-mining area). The first variable is important for the following reasons. Firstly, cities in general have better infrastructure facilities, such as the transportation system, and easier access to financial resources that encourage start-ups, such as banks. In addition, cities attract younger, better educated adults that form a pool of potential entrepreneurs (Reynolds, 1991). The second dummy variable is used to divide the regions into two categories, i.e. Java and non-Java. This is important due to the historical trajectory of Indonesia, both economically and politically. Using the third dummy variable, a region was categorized as a mining region if the share of the mining sector in GDP at constant market price was 10% or higher. To our knowledge, there is no exact cutting-off point for the percentage to be called a mining region or otherwise. Therefore, this study first tried out two percentages, i.e. 10% and 20% share of the mining sector. The results showed that the direction and the significance test in the regression remained unchanged for both measurements, thus either measurement is valid.
To answer the research questions, we employed two analysis tools, i.e. mapping entrepreneurial activities and regression analysis. With the first tool, the start-up rates were mapped using ArcGIS. The mapping process used the symbology query3 based on the quantile approach4 . With the second tool, a regression analysis was performed using GeoDa. For this purpose, we constructed a weight matrix using the first-order Rook's contiguity-based matrix. The weight matrix was modified manually, considering possible neighboring regions between islands. The regression began with defining the dependent variable and the independent variables. The dependent variable was regional entrepreneurship as represented by the regional start-up rate. The independent variables were: GDP in 2005 at constant market price, population density in 2006, sector diversity index, unemployment rate in 2007, and enterprise size. In addition, three dummy variables were employed, i.e. cityness (kota/kabupaten status), Java Island (or non-Java) and mining area (or non-mining area). This was followed by the regression analysis using spatial lag and spatial error models.
Regional Economic Development and Entrepreneurship at Regional Level
Bosma (2009) argues that regional economic development and regional entrepreneurship have twofold causal relationships (Figure 1). On the one hand, regional conditions influence the regional level of entrepreneurship (type A relationship). During decision-making processes, individuals consider the past, the present, and the expected future of the business environment in the region where they intend to establish a enterprise (Wennekers et al. 2002). Regions that are more creative and diverse enjoy more dynamic entrepreneurship activities (Lee et al. 2004). On the other hand, regional entrepreneurship influences regional economic development (type B relationship), which is translated into regional conditions. Businesses contribute to regional development by providing job opportunities, expanding markets, enhancing economic growth, and increasing productivity as well as stimulating dynamic competition.
3 This query is used to assign symbols to features based on an attribute that contains a quantity (Mitchell, 1999).
4 Each class contains an equal number of features (Mitchell, 1999).
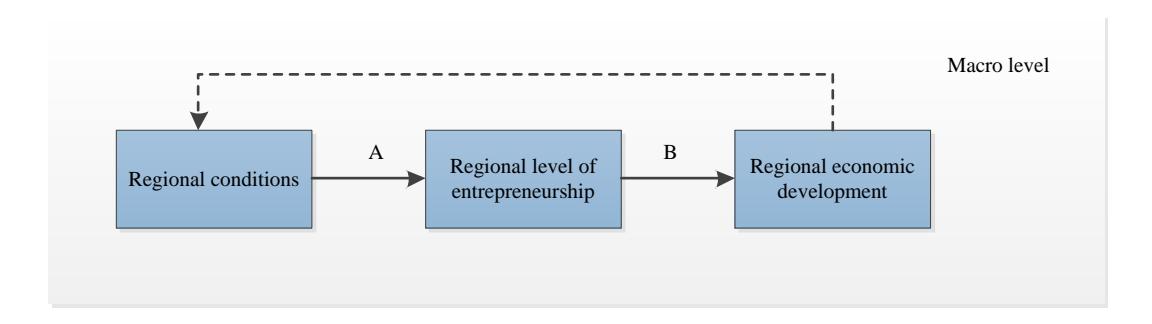
Figure 1. Macro relations between entrepreneurship and regional economic development. Source: Bosma, 2009
To explain the inter-relationship between regional conditions and entrepreneurship, the current study employed approaches that were introduced by Wennekers et al. (2002), which include both the supply and the demand side5 . These approaches have been widely used in entrepreneurship studies (see for example Koster and Karlsson, 2010; Bosma, 2009). The first refers to "the pool of individuals with both the capabilities and preferences to start a business" and the latter refers to "the opportunities available for starting business" (p. 36). Both are explained in the remainder of this section.
Supply Side
Entrepreneurship is economic activity by individuals in a population. Individuals with relevant preferences or attitudes, skills and resources represent the potential supply of entrepreneurs (Wennekers et al., 2002). Entrepreneurial attitudes are influenced by fear of failure, perceived opportunities and self-efficacy (Bosma, 2009). Skills are determined by the knowledge of individuals, i.e. their level of education and talent. Meanwhile, resources can be financial, such as capital, and non-financial, such as networks. Although becoming an entrepreneur is an individual's choice, it is also related to the regional environment. A competitive business climate could foster entrepreneurship; reversely, a less supportive economic environment could hamper entrepreneurship. Indeed, regional conditions, such as financial resources and employment, also determine the regional supply of potential entrepreneurs. In the following, each regional condition is explained.
Financial resources include assets, income, savings and other financial resources owned by individuals. Capital is required to fund a business, which can be borrowed from external sources. Either formal sources, such as banks, venture capital, and micro financing, or from informal sources, such as family, friends, and unauthorized money loaners. In other words, people can start a business if they have capital or if they have access to it. In general, wealthy regions have a higher accumulation of capital, represented by their GDP, which means that potential entrepreneurs in wealthy regions also have a higher chance of realizing their business plans. Accordingly, more entrepreneurs are expected to emerge in wealthy regions. Nonetheless, the access to funding is less substantial when enterprises are at the initial establishment stage compared to the expansion business stage, especially in developing countries (Estrin et al., 2008). This is probably due to the fact that relatively little capital is required for self-employed 5 This approach is influenced by the economics literature as well as the eclectic model proposed by Verheul et al. (2002).
entrepreneurs, small-size enterprises and low-tech businesses. Moreover, ambitious potential entrepreneurs may adjust their plans by rescaling their business.
Apart from the number of entrepreneurs, Klapper and Love (2010) found that business registration is positively correlated with GDP per capita. This suggests that individuals in highly developed regions may favor having a formal business so they can borrow the capital they need from a bank or another institution where formal registration is a compulsory requirement. Thus, we expect to find more formal start-ups in wealthy regions and a larger average enterprise size. Nevertheless, like in developing countries, even if GDP is high it may still happen that the share of regional consumption versus GDP is considerably higher than the share of regional savings versus GDP. In such cases, income is not always available to finance businesses, resulting in a lower number of entrepreneurs. Thus, in general, the enterprise size in the regions was expected to be small. An informal business can also be viewed as a favorable option because they do not have to pay taxes. For small enterprises, it is not necessary to apply for funding from banks or other formal institutions. Moreover, poor quality management of government agencies in developing countries lowers the willingness to legalize enterprises. Illegal retribution, unclear procedures and unspecified actual time to complete applications are examples.
Regional (un)employment rates also affect the supply of entrepreneurs. On the one hand, employed individuals have higher opportunity costs, defined as "the discounted present value of future earnings in the individual's most desirable career path" (Amit et al., 1995, 97). The opportunity costs restrict the choice of becoming an entrepreneur since individuals will start a business when the expected discounted profits in the future are higher than the discounted sum of future earnings from dependent employment (Evans and Jovanovic, 1989). Based on data related to Canadian workers, Amit et al. (1995), the likelihood of individuals starting entrepreneurial activities is higher when the opportunity costs are lower. According to this view, rich regions may have a lower number of entrepreneurs. Nevertheless, the opportunity costs in developing countries are generally lower compared to those in developed countries, which can lead to different results.
On the other hand, if unemployment rates are high, many people have no jobs. Unemployed residents may generate income by starting an enterprise or a business because they can immediately become self-employed, assuming they have a positive attitude toward entrepreneurship (Audretsch et al., 2002). Especially in developing countries, where social security programmes are not well established or even not available, these effects could be stronger. Therefore, the effects of regional un(employment) on entrepreneurship in developing countries remain unclear.
To conclude, the relationship between unemployment and number of start-ups is rather complicated (Armington and Acs, 2002). Regions with a higher unemployment rate may experience a decrease in aggregate demand, which is an unfavorable environment for start-ups. Applying time series analysis, Storey (1991) found that unemployment is positively correlated with number of start-ups. However, applying cross-sectional or pooled cross-sectional analysis, the opposite was found. This suggests two things: first, there is a time lag between being unemployed and starting a business. Unemployed individuals need some time to make a business plan, to gather ideas and to obtain resources. Secondly, it may be due to different requirements for start-ups in each economic activity. In the case of high unemployment, economic sectors that require less capital can have more start-ups. In addition, one cannot easily move from a particular sector to another sector due to specific expertise.
Demand Side
Market demand determines the range of economic activities, quantitatively and qualitatively. Assuming that entrepreneurs serve only a local market, the quantity of demand can be represented by the number of potential buyers residing in the region. One proxy for representing potential buyers is population density, where densely populated areas provide a greater number of potential buyers. In other words, densely populated regions have higher market demand. In this case, individuals will perceive more opportunities to commercialize their knowledge and resources. They seize opportunities and fill gaps in the market, which is called opportunity-based entrepreneurship (Audretsch et al., 2002). In addition, there are local markets that are unique for an archipelago country because the geography naturally isolates one island from another, which can benefit local entrepreneurs to act upon local markets. Even if there is expansion from external markets, local entrepreneurs have a competitive advantage as they can reduce their prices because they have lower transportation costs.
Population density can be used to represent agglomeration effects. These effects are also known as urbanization effects, which consist of density effects and spill-over effects. Density effects are based on the assumption that higher concentrations of people can reduce production costs in terms of access to costumers as well as access to suppliers. Moreover, since industries are located in close proximity to the market, enterprises can easily adapt to new developments with their competitors, such as implementing new technology. Apart from population density, these effects can also be represented by population growth, the percentage of the population in their early adult years, i.e. 25 to 44 years of age (Reynolds, 1994).
The quality of market demand can be represented by the range of products that are available in the market. Since rich regions are generally characterized by relatively high consumer purchasing power, the residents are capable of buying more diverse products. In addition to meeting their basic needs, people may also spend money on complementary and luxury products. This encourages potential entrepreneurs (Kirznerian entrepreneurs) to create new products or to enhance the quality of existing products. Moreover, as people are willing to increase their expenditure, this situation allows new enterprises to use advanced technology and production methods. In other words, these opportunities can be combined creatively, which in turn increases entrepreneurial activities in the region.
Indonesia as the Locus of the Study
Indonesia is the largest archipelagic country in the world, encompassing 13,000 islands. These islands are located in an area of 1.9 million square metres. The country, which has a tropical climate, has spatially diverse patterns of ethnicity, natural resource endowment, population settlement, and economic structure. The dynamics of Indonesia are explained briefly in the rest of this section.
Demographic Dynamic
According to BPS-Statistics Indonesia, the population in 2006 was around 224 million people. Those people were located equally in urban and rural areas, 47% and 53%, respectively. Some regions are densely populated, such as Java, Bali and Lombok. Other regions, such as Sumatera, Sumbawa, Nusa Tenggara Timur and Sulawesi, are only partially densely populated. Meanwhile, the rest of the country is categorized as sparsely populated, i.e. almost all of Kalimantan and eastern Indonesia (Maluku, Maluku Utara, and Papua).
| Table 1. Net Enrolment Rate and Education Attainment in 2004. |
|---|
| Source: Modified by author based on Tables 2 and 3 in Suryadarma et al. (2006) |
| Net enrolment rate (%) | Mean of education | |||
|---|---|---|---|---|
| Primary | Junior | Senior | attainment (years) | |
| National | 92.8 | 65.2 | 44.6 | 7.7 |
| Urban | 92.5 | 73.6 | 59.7 | 9.1 |
| Rural | 93.0 | 60.2 | 34.0 | 6.5 |
| Difference | -0.5 | 13.4 | 25.7 | 2.6 |
| Java + Bali | 93.4 | 68.0 | 45.5 | 7.6 |
| Outside Java + Bali | 92.6 | 63.9 | 44.2 | 7.9 |
| Difference | 0.8 | 4.1 | 1.3 | -0.3 |
Another important feature of the demographic dynamics of Indonesia is human capital. This can be represented by the level of education. Table 1 provides an overview of spatial patterns of education attainment based on net enrolment rate. It shows that at the primary school level, the net enrolment rate is almost the same in all regional categories. The junior and senior secondary school levels, on the other hand, show regional inequality in education.
Spatial inequality occurs between urban and rural areas as well as between Java + Bali and the outer islands. Variation between rural and urban areas increases as the level of education increases. The difference in senior secondary level is the highest of all, at 26 percentage points. Meanwhile, the gap between Java + Bali and the outer islands is small for both the junior and senior school level, especially for the second one, at only one percentage point. With regard to education attainment, the average level of education in Indonesia is 7.7 years, which means that most people in Indonesia only finished the second year of junior high school. The difference between urban and rural areas is significant, i.e. almost equal to the time for completing junior secondary education (2.5 years). Meanwhile, there is almost no difference between Java + Bali and the outer islands.
Economic Structure
There is considerable variation in the levels of economic development of Indonesian regions. Based on local economic indicators, i.e. GDP, non-mining GDP and consumption expenditure per capita, Hill et al. (2008) categorized Indonesian provinces into four categories, namely 'consistently wealthy', 'consistently non-poor', 'very poor', and 'slipping behind'. The first category (consistently wealthy) comprises Jakarta, Kalimantan Timur, and Riau. The second category (consistently poor) comprises Sumatera Utara, Kalimantan Tengah, Jawa Barat, Jawa Timur, Bali, and Sumatera Barat. The third category (very poor) consists of Nusa Tenggara Barat, Nusa Tenggara Timur, Maluku, and Sulawesi Tenggara. The fourth category consists of the rest of the provinces and are categorized as 'slipping behind', such as Sumatera Utara, Jambi, Bengkulu, Kalimantan Barat, Kalimantan Selatan, and Lampung.
The contributions of different sectors to the Indonesian economy can be seen in Table 2. Economic activities are concentrated in three major sectors: manufacturing; wholesale and retail trade, restaurants and hotels; and agriculture; at 24.9%, 19.3% and 15.85, respectively. This indicates that Indonesia is currently in a phase of industrialization, which can be linked to rapid export-industrialization due to the major policy reforms of the 1980s (Hill et al., 2008).
Meanwhile, the three sectors that have the lowest share in the Indonesian economy are electricity, gas and water (1.1%); construction (5.7%); and transport, storage, and communications (6.5%).
Table 2 also shows that the economic structure of Java and that of the outer islands is different. The three largest sectors of Java are: manufacturing; wholesale and retail trade, restaurants and hotels; and finance, insurance, real estate, and business. Meanwhile, the major sectors on the outer islands are: agriculture; mining and quarrying; and manufacturing. These patterns also suggest that the level of economic development is different between Java and the rest of Indonesia. With regard to Porter's argument (2001) on the stages of economic development, in a general sense, Java can be categorized as having an investment-driven economy. Business activities utilize production factors through industrialization as well as service-based businesses, such as banks, restaurants, and hotels. Accordingly, the outer islands can be categorized as having a factor-driven economy. Economic activities mainly depend on natural resource endowments such as land, minerals, oil and gas.
Table 2. Share of GDP at Constant Market Price Per Sector in 2006. Source: Author's own calculation based on BPS-Statistics Indonesia data
| Percentage of total | ||||||
|---|---|---|---|---|---|---|
| Sector | National | Java | The outer islands | |||
| 1 Agriculture | 15.8 | 11.3 | 22.4 | |||
| 2 Mining and quarrying | 9.1 | 1.4 | 20.3 | |||
| 3 Manufacturing industry | 24.9 | 29.7 | 17.8 | |||
| 4 Electricity, gas and water | 1.1 | 1.5 | 0.6 | |||
| 5 Construction | 5.7 | 6.0 | 5.2 | |||
| 6 Wholesale and retail trade, restaurants and hotels | 19.3 | 22.3 | 14.9 | |||
| 7 Transport, storage, and communication | 6.5 | 6.7 | 6.2 | |||
| 8 Finance, insurance, real estate, and business | 8.8 | 12.1 | 3.9 | |||
| 9 Public services | 8.8 | 8.9 | 8.7 | |||
Political Dynamics
It can be said that the devastating economic crisis in 1998, where the economy contracted by more than 13% (Hill and Shiraishi, 2007), was closely linked to the political instability that followed. The country saw massive protests against the central government because of issues related to the corruption, collusion, and nepotism of the New Order (Orde Baru), a centralist authoritarian regime. The student protests and decreasing political support forced President Soeharto, who had been running the country for more than 30 years, to announce his resignation on May 1998 (Fitrani et al., 2010). B.J. Habibie, Soeharto's successor, directed the nation towards democratisation and decentralisation. Two new laws were introduced as a cornerstone of decentralisation (autonomy policy), i.e. Law No. 22/1999 on regional government (UUPD) and Law No. 25/1999 on fiscal relations. These two laws affected local and regional dynamics, both politically and economically. As a result, Indonesia experienced a 'big bang' of new local governments. The number of thirdtier governments increased in as many as 141 regions, i.e. almost half of the original number in 1998 (298 regions). These new regions comprised of cities and regencies, 43 and 115, respectively. All new regions, except two cities (Depok and Cilegon), were located outside Java Island.
The second law strengthened the local economy by introducing revenue sharing between provinces and regencies (Alm et al., 2001). This regulation mainly benefits resource-rich regions because they are allowed to reserve most of their local revenues, which formerly went to the central government (Hill and Shiraishi, 2007). Nevertheless, the fixed general transfer from central to new regions provided decentralisation of fiscal resources, which can support the regional economy. In fact, the overall share of regional expenditure relative to total government expenditure after decentralisation was almost double, from approximately 17% in 2000 to over 30% after 2001 (Fitriani et al., 2010).
Mapping Entrepreneurial Regions
The number of enterprises in Indonesia in 2006 was around 13 million. Of those, around 16% can be categorized as start-ups. This indicates a large number of new establishments. Yet, the actual number of new establishments may have been higher since the data cover only the surving enterprises. Table 3 shows that the share of the wholesale and retail trade, restaurant and hotels sector was the largest for both established enterprises and start-ups. Meanwhile, the share of the electricity, gas and water sector was the lowest. One possible reason is that the enterprise size in the first sector is relatively small compared to that in the latter. This is confirmed by the employment percentages. Another reason is that anyone with relevant preferences and resources can easily do business, especially unregistered enterprises, in the wholesale or retail trade, restaurants and hotels sector. Meanwhile, this is unlikely to be the case in the electricity, gas and water sector because this sector requires high capital investments as well as technology intensity, which creates significant entry barriers.
Table 3. Share of Enterprises by Sector. Source: Author's own calculation based on BPS-Statistics Indonesia data
| Sector | Share of Established enterprises | Share of Start-ups | Share of Employment |
|---|---|---|---|
| 2 Mining and quarrying | 1.8 | 2.5 | 1.6 |
| 3 Manufacturing industry | 26.2 | 15.9 | 30.3 |
| 4 Electricity, gas and water | 0.1 | 0.1 | 0.4 |
| 5 Construction | 1.4 | 0.6 | 1.9 |
| 6 Wholesale or retail trade, restaurants, and hotels | 47.7 | 58.5 | 37.3 |
| 7 Transport, storage, and communications | 3.0 | 5.0 | 3.1 |
| 8 Finance, insurance, real estate, and business | 6.8 | 6.7 | 6.9 |
| 9 Public services | 13.0 | 10.8 | 18.9 |
The two approaches we used to measure the total start-up rates per region are presented in Figures 2 and 3. Both approaches show that regional variation of start-ups existed. These two maps also show that the start-up rates on Java and Bali islands were generally lower compared to the rest of the country. This finding is opposite to what was expected since these islands are well known as the leading regions in the Indonesian economy. This could be related to the following reasons. First, the high development of Java and Bali provides more job opportunities, which can constrain an individual's choice to become an entrepreneur. Second, the minimum wage, especially in Jakarta, is high, which can increase opportunity cost and restrict entrepreneurship. Lastly, changes in fiscal policy have enhanced the attractiveness of the outer islands in terms of the business climate. The augmentation of fiscal transfer from central to local government stimulates the local business climate and supports local entrepreneurs.
There are, however, some distinctive differences between the labor market approach and the ecological approach. Using the labour market approach, there was great diversity in start-ups outside Java, Bali and Lombok. Meanwhile, there was not much variation when applying the ecological approach. One of the possible explanations is that the structure of the population outside Java, Bali and Lombok is more diverse. These three islands have similar patterns of population structure, i.e. they are densely populated.
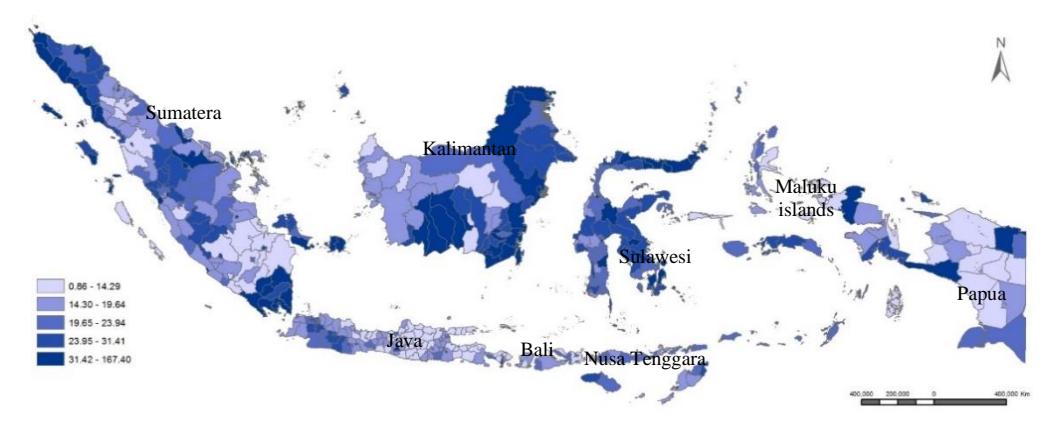
Figure 2. Mapping total start-up rates using the labor market approach. Source: Author's own calculation based on BPS-Statistics Indonesia data
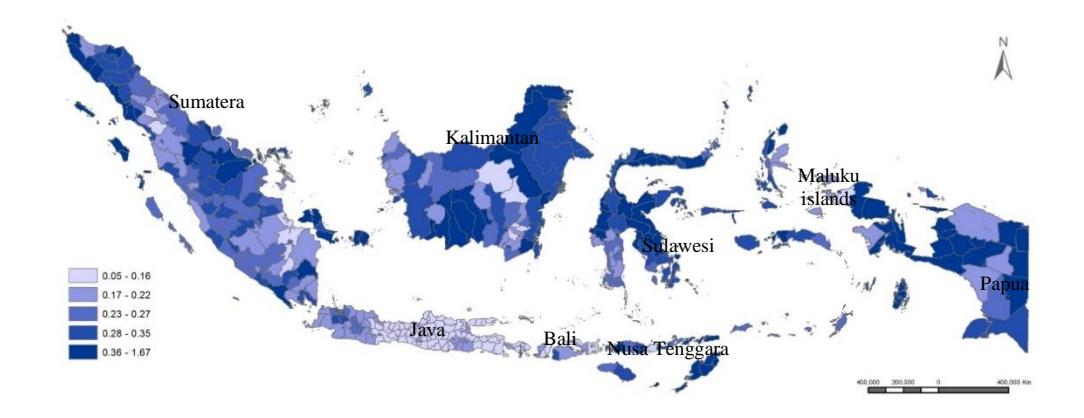
Figure 3. Mapping total start-up rates using the ecological approach. Source: Author's own calculation based on BPS-Statistics Indonesia data
With regard to the registration status of businesses, the regional variation was greater in the informal start-up rates compared to the formal start-up rates. It is important to note that around 91% of all new enterprises were informal businesses. As can be seen in Figures 2, 3 and 4, the regions can be divided, in a general sense, into three categories based on registration status, i.e. 'informal', 'formal', and 'mixed' regions. Informal regions are areas dominated by unregistered enterprises, such as Sulawesi island and the regions in East Nusa Tenggara and Maluku. Formal regions are dominated by registered business, such as the regions in Kalimantan and Papua. Meanwhile, mixed regions are found in Sumatera and Java. Another interesting observation is that the rates in cities are high although they are surrounded by less entrepreneurial areas. This indicates a greater concentration of economic activities in cities, which may be related to localized economies and knowledge spill-over.
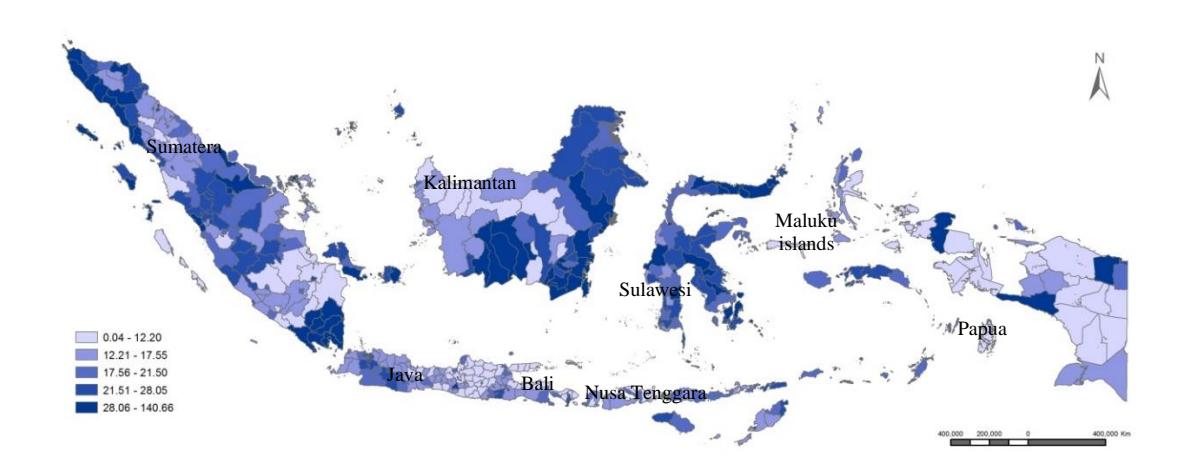
Figure 4. Mapping informal start-up rates using the labor market approach. Source: Author's own calculation based on BPS-Statistics Indonesia data
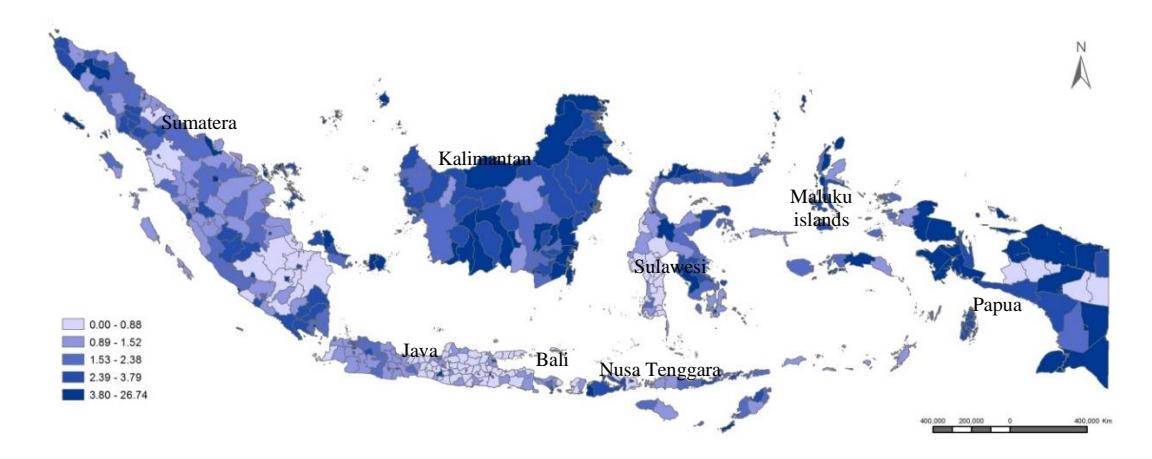
Figure 0. Mapping formal start-up rates using the labor market approach. Source: Author's own calculation based on BPS-Statistics Indonesia data
Regression Results
Using OLS regression, we tested three models on total start-up, formal start-up and informal startup using the labor-market start-up rates, and total start-up using the ecological start-up rates. This included interpreting the regression results on the effects of economic development. Then, we compared the differences between formal and informal start-ups. We begin this discussion by explaining descriptive statistics and the correlation between these variables.
Summary Statistics and Correlation
Summary statistics of the variables are presented in Table 4. The table shows that there are some values missing from our data, i.e. Tanjung Pinang, Pontianak, Minahasa, Manokwari, and Nabire; these regions were omitted from the analysis. It also shows that the variation of some variables was quite large, for example GDP per capita and population density. The large variation of GDP per capita suggests that there is large regional income inequality; indeed, the amount of GDP per
capita in the wealthiest region is 114 times that of the poorest regions. This can affect the probability of becoming an entrepreneurial region.
Table 4. Summary statistics of the variables. Source: Author's own calculation based on BPS-Statistics Indonesia data
| N | Minimum | Maximum | Mean | Std. deviation | |
|---|---|---|---|---|---|
| Total start-up rate | 435 | 0.86 | 167.4 | 24.1997 | 13.84647 |
| Formal start-up rate | 435 | 0 | 26.74 | 2.6173 | 2.49545 |
| Informal start-up rate | 435 | 0.04 | 140.66 | 21.5825 | 12.41013 |
| Ecological start-up rate | 435 | 0.048767874 | 1.667002012 | 0.274929681 | 0.168289898 |
| GDP per capita | 440 | 0.00E+00 | 114.8443111 | 7.561373925 | 10.74826231 |
| Population density | 440 | 1.029119564 | 17566.25089 | 1091.673735 | 2538.004016 |
| Diversity | 435 | 0.733102 | 1.977278 | 1.63452697 | 0.163495911 |
| Unemployment rate | 440 | 1.36882345 | 22.14708248 | 8.329762665 | 4.15806032 |
| Size | 435 | 1.59 | 7.59 | 2.7811 | 0.71618 |
| Dummy_city | 440 | 0 | 1 | 0.2 | 0.404 |
| Dummy_java | 440 | 0 | 1 | 0.26 | 0.44 |
| Dummy_mining | 440 | 0 | 1 | 0.15 | 0.357 |
| Valid N (listwise) | 435 |
The deviation of population density is twice greater than the mean. This suggests that some regions are more densely populated than others. Thus, the pattern of population settlement is varied. This can be caused regional differences in demographic dynamics, such as population growth, migration patterns, as well as regional attractiveness, for example because of liveability. Some areas can attract in-migration because of abundant employment opportunities, high quality of regional liveability and educational advantage. In densely populated areas, the entrepreneurs and their customers can be closely located to each other, which in turn is beneficial for entrepreneurship activities in terms of, for example, transportation or delivery costs.
The correlation matrix of the variables is provided in Table 5. As can be seen, some independent variables are significantly correlated with each other. Population density is positively correlated with all dependent variables except for the dummy variable mining. It shows that mining areas are not preferable for living due to environmental issues such as chemical waste pollution. In addition, mining areas are in many cases located in remote areas.
Moreover, population density is highly correlated with unemployment rate, size, dummy variable city and dummy variable Java. These relationships can be explained by the following reasons. Firstly, the highly positive relationship between density and unemployment rate suggests that people in densely populated areas are more likely to be unemployed. Perhaps this is because job seeking in those areas is more competitive. Secondly, it confirms the attractiveness of cities as places for living.
Apart from being highly correlated to density, the dummy variable city was also highly correlated to unemployment rate and size. Cities may attract migrants, who are more likely to be economically active in pursuing jobs or become part of the labor force. Thus, the labor force in cities can be greater compared to non-city areas, which increases the degree of competition among job seekers, which in turn influences the unemployment rate.
Effects of Economic Development on Start-ups
We ran three models for each independent variable, labor-market start-up rate and ecological start-up rate. Surprisingly, the results for both approaches were different. Sectoral diversity showed a significant negative effect when the labor-market approach was used and, conversely, it showed a significant positive effect when the ecological approach was used. The rest of the explanatory variables, except for dummy-Java, provided mixed interpretations. The GDP, density and unemployment rate were only significant in the first approach, while enterprise size was only significant in the second one.
Table 5. Correlation matrix. Source: Author's own calculation based on BPS-Statistics Indonesia data
| (1) | (2) | (3) | (4) | (5) | (6) | (7) | (8) | (9) | (10) | (11) | (12) | ||
|---|---|---|---|---|---|---|---|---|---|---|---|---|---|
| Total start-up | |||||||||||||
| 1 | rate | 1 | |||||||||||
| Formal start-up | |||||||||||||
| 2 | rate | .636** | 1 | ||||||||||
| Informal start | |||||||||||||
| 3 | up rate | .988** | .508** | 1 | |||||||||
| Ecological start | |||||||||||||
| 4 | up rate | .443** | .334** | .427** | 1 | ||||||||
| 5 | GDP per capita | .205** | .135** | .201** | 0.088 | 1 | |||||||
| 6 | Density | .098* | .098* | 0.09 | -0.09 | .235** | 1 | ||||||
| - | |||||||||||||
| 7 | Diversity | .205** | .245** | .179** | .276** | .097* | .178** | 1 | |||||
| Unemployment | |||||||||||||
| 8 | rate | .220** | .172** | .211** | -0.01 | .223** | .417** | .208** | 1 | ||||
| 9 | Size | 0.09 | .272** | 0.046 | .114* | .383** | .445** | .224** | .356** | 1 | |||
| 10 | Dummy_city | .321** | .391** | .279** | 0.006 | .184** | .608** | .299** | .577** | .408** | 1 | ||
| - | - | - | - | ||||||||||
| 11 | Dummy_java | .264** | .279** | .238** | .390** | 0.03 | .421** | .110* | .155** | .196** | .109* | 1 | |
| - | - | - | |||||||||||
| 12 | Dummy_mining | 0.069 | -0.01 | 0.078 | 0.026 | .320** | .159** | 0.061 | -0.07 | 0.025 | .181** | .163** | 1 |
** Correlation is significant at the 0.01 level (2-tailed)
Following the argumentation of Acs and Armington (2004), we based our analysis on the labormarket approach. They argued that the labor force is a better measurement for the start-up rate because of its implicit assumption that persons that choose to either become an entrepreneur or remain a wage worker are in the same labor market as their enterprises operate.
As can be seen from Table 6, the R squared increased when the regression included dummy variables for both the labor-market approach and the ecological approach. This suggests that model (2) and model (3) had a better statistical fit in estimating the start-up rates. The R squared indicates that model (2) provided a better estimation compared to model (3). Nevertheless, it seems that the dummy variable city interacted with other variables in the model, i.e. population density and unemployment rate. For the purpose of our analysis, it was more suitable to choose model (3).
In all OLS results, we obtained a statistically significant spatial autocorrelation in which Moran's I indices were highly significant for both the labor-market approach and the ecological approach. This implies that neighboring regions are important. Thus, it is necessary to employ either a
* Correlation is significant at the 0.05 level (2-tailed)
spatial-lag or an error model because the OLS regression is not valid anymore. In such cases, OLS may lead to an overestimation of the magnitude of the parameters (Anselin, 2005). Following Anselin's framework, there is not much to say about which model provided a better fit because both robust LM (lag) and (error) were not significant. In this case, we refer to log likelihood, the Akaike Information Criterion (AIC) and the Schwartz Criterion (SC). The lowest number of both AIC and SC confirms that the error model gave the best results.
Table 6. Regression results of total start-up rate using labour-market approach. Source: Author's own calculation based on BPS-Statistics Indonesia data
| OLS | Lag | Error | |||
|---|---|---|---|---|---|
| (1) | (2) | (3) | (3) | (3) | |
| W | 0.229(0.000)*** | ||||
| Constant | -1.890(0.778) | 5.892(0.357) | -2.008(0.747) | -4.532(0.454) | 2.054(0.745) |
| GDP per capita | 0.231(0.000)*** | 0.203(0.001)*** | 0.202(0.001)*** | 0.192(0.001)*** | 0.204(0.001)*** |
| Density | -0.00008(0.769) | 0.00006(0.846) | 0.0007(0.014)** | 0.0006(0.015)** | 0.0008(0.006)*** |
| Diversity | 14.358(0.000)*** | 12.111(0.001)*** | 15.674(0.000)*** | 13.745(0.000)*** | 12.985(0.000)*** |
| Unemployment rate | 0.591(0.000)*** | 0.248(0.157) | 0.558(0.000)*** | 0.501(0.001)*** | 0.541(0.001)*** |
| Size | -1.424(0.183) | -1.633(0.100) | -1.174(0.243) | -1.039(0.279) | -0.965(0.345) |
| Dummy_city | 9.331(0.000)*** | ||||
| Dummy_java | -9.823(0.000)*** | -11.438(0.000)*** | -9.204(0.000)*** | -11.756(0.000)*** | |
| Dummy_mining | 0.558(0.760) | -0.776(0.673) | -0.981(0.577) | -1.144(0.533) | |
| Lambda | 0.241(0.000)*** | ||||
| R Squared adjusted | 0.09 | 0.22 | 0.19 | ||
| Log likelihood | -1736 | -1699 | -1708 | -1696 | -1696 |
| AIC | 3484 | 3417 | 3433 | 3411 | 3408 |
| SC | 3509 | 3453 | 3465 | 3447 | 3441 |
| Moran's I | 8.150(0.000)*** | 6.520(0.000)*** | 6.330(0.000)*** | ||
| LM (lag) | 62.790(0.000)*** | 39.741(0.000)*** | 35.224(0.000)*** | ||
| Robust LM (lag) | 1.055(0.304) | 1.608(0.204) | 0.360(0.548) | ||
| LM (error) | 62.601(0.000)*** | 38.534(0.000)*** | 36.278(0.000)*** | ||
| Robust LM (error) | 0.866(0.351) | 0.401(0.526) | 1.414(0.234) |
***: p<0.01; **: p<0.05; *: p<0.10.
Comparing the OLS results with the spatial error results, we conclude that the magnitude of independent variables slightly changed when the regression accounted for spatial dependence in the spatial error model. Nonetheless, the significance of all variables remained unchanged. This suggests that the characteristics of a region matter regardless of its dependency on neighboring areas.
Analyzing the spatial error model, we obtained several important influences of regional variables on entrepreneurship. Firstly, regional economic performance is significant for entrepreneurship. Wealthy areas are more likely to become entrepreneurial regions. The availability of capital, represented by GDP per capita, encourages entrepreneurship. Secondly, the quantity of market
demand, represented by population density, is as important as the quality of market demand, represented GDP per capita. A greater market demand provides opportunities that can be acted upon. A high range of consumer expenditure allows for more diverse products, which also benefits entrepreneurs. Thirdly, the significant positive effect of the unemployment rate indicates a high degree of necessity-based entrepreneurship, i.e. unemployed individuals are pushed to start a business because no other options are available for them. Lastly, being in Java is not as important as expected because it has a negative influence on start-ups. This can be due to the different stages of economic development between Java and the outer islands, as explained in the previous section. The relationship between entrepreneurship and economic development is a U-shaped pattern, i.e. the number of active entrepreneurs is lower when the GDP begins to increase (Bosma, 2009).
Formal vs Informal Start-ups
The results of the spatial regression for formal and informal start-ups are presented in Table 7. Similar to the explanation above, we analyzed formal and informal start-ups based on model (3) using the spatial error model. This showed that the result for informal start-ups was similar to the result for total start-ups, except for enterprise size. This was as expected since informal businesses account for slightly more than 90% of the total number of start-ups.
There are others interesting findings of our regression results. The GDP per capita is only significant for informal start-ups. This finding is rather surprising because formal enterprises require more capital. One possible explanation is that the wealth of an individual may be relatively high, but it could still be only slightly more than enough for consumption expenditure. As a result, individuals will prefer to start a business that is small and informal in order to avoid additional costs such as registration fees.
Population density is positively significant, which indicates that the quantity of market demand plays an important role for both formal and informal start-ups. Accordingly, the diversity of the sector is significant for both types of enterprise. This confirms that the diversity of productive activity fosters entrepreneurship regardless of the type of enterprise. Meanwhile, the unemployment rate is significant for informal start-ups but not for formal start-ups. These finding are in line with the nature of both types. Unemployed individuals may choose to start an informal business because of lack of capital. In contrast, unemployed individuals may not be able to establish a formal enterprise due to additional requirements such as establishment fees.
The dummy variable Java was found to be negatively significant in both measurements, which suggests that Java is not a favorable place for new entrepreneurs, partly due to the U-shaped relationship between economic development and entrepreneurship. Lastly, enterprise size affects both formal and informal start-ups but in different directions. It has a negative effect on informal start-ups but a positive effect on formal start-ups. One possible explanation is that a competitive business climate is not favorable for informal enterprises but favorable for formal enterprises. Formal enterprises may tend to locate close to other large enterprises in order to gain positive effects from localization. In addition, abundant natural resources hardly have any impact on entrepreneurship.
Table 7. Regression results of formal and informal start-up rates. Source: Author's own calculation based on BPS-Statistics Indonesia data
| Dependent variable: Formal start-up rates | Dependent variable: Informal start-up rates | ||||||||||
|---|---|---|---|---|---|---|---|---|---|---|---|
| OLS | Lag | Error | OLS | Lag | Error | ||||||
| W | (1) | (2) | (3) | (3) 0.164(0.0 02)*** | (3) | (1) | (2) | (3) | (3) 0.275(0.0 00)*** | (3) | |
| Constant GDP per capita | - 4.617(0.0 00)*** 0.007(0.5 27) | - 2.650(0.0 15)** 0.007(0.4 89) | - 4.701(0.0 00)*** 0.007(0.5 22) | - 5.222(0.0 00)*** 0.006(0.5 55) | - 5.091(0.0 00)*** 0.006(0.5 41) | 2.726(0.6 47) 0.224(0.0 00)*** | 8.542(0.1 46) 0.196(0.0 00)*** | 2.692(0.6 35) 0.195(0.0 00)*** | 0.535(0.9 21) 0.183(0.0 00)*** | 8.039(0.1 61) 0.197(0.0 00)*** | |
| Density Diversity Unemploy ment rate | - 0.00007( 0.160) 2.880(0.0 00)*** 0.046(0.1 31) | - 0.00009( 0.091)* 2.301(0.0 00)*** 0.043(0.1 50) | 0.00007( 0.135) 3.226(0.0 00)*** 0.037(0.1 90) | 0.00008( 0.097)* 3.414(0.0 00)*** 0.041(0.1 39) | 0.0001(0. 017)** 3.713(0.0 00)*** 0.047(0.1 11) | - 0.00001( 0.962) 11.477(0. 001)*** 0.545(0.0 00)*** | 0.0001(0. 598) 9.809(0.0 05)*** 0.291(0.0 70)* | 0.0006(0. 016)** 12.448(0. 000)*** 0.521(0.0 00)*** | 0.0005(0. 020)** 9.819(0.0 02)*** 0.446(0.0 01)*** | 0.0007(0. 009)*** 8.593(0.0 15)** 0.488(0.0 01)*** | |
| Size | 0.777(0.0 00)*** | 0.705(0.0 00)*** | 0.824(0.0 00)*** | 0.728(0.0 00)*** | 0.666(0.0 00)*** | - 2.202(0.0 22)** | - 2.338(0.0 10)** | - 1.999(0.0 29)** | - 1.676(0.0 52)* | - 1.532(0.0 99)* | |
| Dummy_c ity | 2.421(0.0 00)*** | 6.909(0.0 00)*** | |||||||||
| Dummy_j ava | - 1.887(0.0 00)*** | - 2.306(0.0 00)*** | - 2.048(0.0 00)*** | - 2.449(0.0 00)*** | - 7.935(0.0 00)*** | - 9.131(0.0 00)*** | - 6.881(0.0 00)*** | - 9.335(0.0 00)*** | |||
| Dummy_ mining Lambda | - 0.260(0.4 04) | - 0.607(0.0 60)* | - 0.685(0.0 28)* | - 0.802(0.0 13)** 0.215(0.0 00)*** | 0.819(0.6 26) | - 0.169(0.9 19) | - 0.284(0.8 57) | - 0.353(0.8 31) 0.283(0.0 00)*** | |||
| R Squared adjusted Log | 0.10 | 0.30 | 0.24 | 0.08 | 0.19 | 0.17 | |||||
| likelihood | -987 | -930 | -950 | -944 | -942 | -1689 | -1661 | -1667 | -1650 | -1651 | |
| AIC | 1986 | 1878 | 1917 | 1907 | 1900 | 3391 | 3341 | 3351 | 3319 | 3318 | |
| SC | 2011 6.760(0.0 | 1915 5.154(0.0 | 1950 5.192(0.0 | 1944 | 1932 | 3415 8.587(0.0 | 3378 7.300(0.0 | 3384 7.117(0.0 | 3356 | 3351 | |
| Moran's I LM (lag) Robust LM (lag) LM (error) Robust LM (error) | 00)*** 36.950(0. 000)*** 0.424(0.5 14) 42.693(0. 000)*** 6.167(0.0 13)** | 00)*** 22.590(0. 000)*** 0.348(0.5 55) 23.593(0. 000)*** 1.351(0.2 45) | 00)*** 17.171(0. 000)*** 1.794(0.1 80) 23.986(0. 000)*** 8.609(0.0 03)*** | 00)*** 72.163(0. 000)*** 2.690(0.1 00) 69.633(0. 000)*** 0.159(0.6 89) | 00)*** 51.299(0. 000)*** 2.743(0.0 97)** 48.693(0. 000)*** 0.137(0.7 10) | 00)*** 47.457(0. 000)*** 1.640(0.2 00) 46.254(0. 000)*** 0.437(0.5 08) | |||||
***: p<0.01; **: p<0.05; *: p<0.10.
Conclusion
This study examined the relationship between economic development and entrepreneurship in the context of a developing country. Based on the findings, the level of entrepreneurship (start-ups) is determined by the regional economic development as well as the economic development of its surrounding regions. With regard to the measurement of regional start-ups, we conclude that the type of measurement plays an important role in explaining entrepreneurship at the regional level. Using different approaches led to slightly different results. This study contributes to understanding both supply and demand factors that explain regional entrepreneurship (Wennekers et al., 2002). While existing studies conducted in developed countries tend to reveal that supplyside factors matter the most in the development of regional entrepreneurship, in the context of a developing country such as Indonesia demand factors also matter (cf. Audretsch et al., 2002).
Wealthy regions with high GDP per capita are more entrepreneurial with regard to informal businesses. In addition, new entrepreneurs can emerge both because of necessity and opportunity. The findings confirm that the occurrence of start-ups can be explained by the supply-side approach in that unemployment stimulate individuals to become entrepreneurs, i.e. necessitybased entrepreneurship (see Reynolds et al., 2001). They start an informal business due to some limitations such as lack of capital. Meanwhile, the demand-side approach confirms that the size of market demand influences entrepreneurship. More individuals are willing to become entrepreneurs in regions where opportunities are abundant, which leads to opportunity-based entrepreneurship. Surprisingly, Java is not favorable for new businesses, indicating that competition is too stiff and does not stimulate further entrepreneurial development.
It is worth noticing that most of the start-ups in Indonesia are unregistered businesses, which is a unique characteristic of entrepreneurship in developing countries. Thissuggests two explanations. Firstly, individuals are reluctant to register their business in order to reduce additional costs and shorten the planning period. Secondly, business owners may not see benefits in registering their business. Lastly, it also suggests that government has weak bargaining power in controlling business activities. Such a condition is evident in developing countries, where the capability of the government is sometimes underrepresented (see Koster & Rai, 2008). This implies that policy reform to promote regional entrepreneurship is needed, but it is foreseen to be problematic; entrepreneurial activities should be promoted but tackling informality problems is not as simple, as it requires multifaceted considerations.