
Introduction
There are great differences between China's rural areas, while the rural areas themselves have complex development characteristics, and the exploration of rural development and the attempt to understand its characteristics never stop. With the implementation of the Rural Revitalization Strategy, based on the complexity of rural characteristics and the general characteristics of 2 Associate Professor, Tongji University, Shanghai, China. E-mail: 81951000@qq.com
policy tools, rural policies based on local conditions cannot be separated from the screening of rural types and 'one size fits all' policy standards have difficultly to meet the needs of different types of rural development. At the same time, under the objective premise of recognizing regional differences, through the policy oriented discrimination of different rural types, matching their development basis and development policies, respecting the autonomy of rural development is conducive to making up for policy inadaptability brought by regional differences between urban and rural areas. Therefore, it is of great significance to distinguish the different characteristics of rural areas scientifically and to carry out extensive research on rural types.
Rural development is a dynamic evolutionary process. Villages in different periods have their own specific characteristics. The dynamic evolution of overall rural development, the nonintegration of various elements of the countryside, the relationship between the countryside and the city, and the existence of an urban-rural continuum make it difficult to quantitatively grasp the contribution and interaction of various elements affecting the rural development and increase the difficulty of judging the type and stage of rural development. Cloke was the first to put forward a measurement system of rurality indicators to measure the relevance of a single region's rural areas in a certain geographical location point compared to other regions in its relative location (Cloke, 1977; 1987).
In the international study of rural types, foreign scholars have focused on the measurement of rurality indicators, combined with different research purposes, principal component analysis, cluster analysis and other applicable technical means to measure the relationship between one single factor and rural areas. Copus used 47 indicators in European nuts Ⅲ, and combined factor analysis and clustering technology to analyze the role of policy background in rural development (Copus, 1996); Bański established a mathematical model containing 8 indicators, and compared the spatial and functional structure changes of rural areas in Poland from the perspective of agricultural function (Bański, 2002); Dimitris represented the factors of economic change by clustering 52 indicators of social welfare, such as the impact of public institutions on backward rural areas and coastal areas in Greece (Dimitris et al., 2003); four indicators related to entrepreneurship and employment were developed by Ferrão to see the relationship between the development of different rural areas and entrepreneurship in Portugal (Ferrão et al., 2003); Aubert analyzed the economic participation of rural areas in France by clustering dynamic change indicators (Aubert et al., 2017).
Chinese scholars have focused on the study of rural types in geography. They focused on the relationship between rural development types, rural industry, urbanization and other factors, and mostly used linear weighting, index evaluation, image recognition and other technical means. For example, by defining the leading role of different industrial functions, the rural development in the eastern coastal areas of China can be divided into four types: agricultural leading type, industrial leading type, business travel service type, and balanced development type (Long et al., 2017). According to the position of the rural economy in social and economic development, a rural evaluation index and rural index evaluation model have been established. The spatial correlation was carried out by using GIS and GeoDa technology based on spot satellite images, using exploratory spatial data analysis, spatial rhythm measurement and other models to study the spatial differentiation characteristics of rural settlements in Jiangsu Province (Ma et al., 2012). Some scholars have also used qualitative evaluation/classification methods, mainly on rural governance, development and evolution. For example, three basic structural elements of rural governance can be qualitatively distinguished from the type of rural governance (the primary order type, the secondary order type, the rural collusion type, and the disorder type) by analyzing the urban-rural relationship in practice, the production capacity of the basic rural order (social relevance degree), and the role and dynamic mechanism of village cadres based on the urbanization process, affecting the rural settlement space to different degrees (He et al., 2005). Other examples are the qualitative analysis of the evolution of rural settlement space as affected by changes in land use, population, industry, facilities and concepts (Xin et al., 2007), and the qualitative analysis of the dialectical relationship between economy, construction and ecology based on the relative balance of the development degree of three rural types (Dong et al., 2017).
From the perspective of the type of rural classification, the research of rural classification at home and abroad focuses on the choice between three types. One is the rural classification of geographical distribution, the second is the rural classification of economic development level, and the third is the rural classification of industrial structure type. The classification methods try to find the correlation between a single category and the main influencing factors, but they have to be affected by human intervention in the process of analysis and clustering and cannot get a satisfactory linear relationship from a large number of complex index factors. According to Blunden, rural areas can have very different characteristics. When conducting rural research in a wide range of areas, the methods can be customized according to the needs, eliminating human interference factors and integrating a series of development data in different areas and at different spatial levels to reflect the availability of data, regional environment and policy objectives. Based on this, Blunden used a neural network method (BP) to study the European countryside by selecting 13 indicators, such as accessibility, population density and employment (Blunden et al., 1998), but this method has not yet been fully applied in China.
This paper introduces a neural network method that is adaptive, suitable for different spatial scales, and can reflect the availability of information. It not only greatly eliminates human interference factors, but is also more suitable for the exploration and research of a large number of index and type association relations. The fully trained neural network can be used to identify the same eigenvalue attributes in different regions and has a wide range of typology applications. In this study, we explored a rural classification method and an index system that are suitable for the characteristics of China using the neural network method so as to provide support for the formulation and optimization of rural policies.
Application of Neural Network Method in Rural Classification
The theoretical background of artificial neural networks has been explained in detail (Mcclelland et al., 1998; Lippmann et al., 1987) and its application in typology has been explored widely. The practical application is based on neural networks that can record the relationship between the input and output sample sets without any initial assumptions on the relationship between them so as to find out the concept of the data patterns. In short, the unique nonlinear adaptive information processing ability of the artificial neural network enables to see the network structure as a matrix of the same partially interconnected processing unit. By inputting parameter values into the matrix, each value reaches the processing unit through the connecting network. When an input value is passed through a link, it will be adjusted by a weighting factor between 0 and 1, that is, the network neuron. When the network is trained, the weights are constantly modified to allow the neural network to simulate the relationship between the input value and the output value of the sample (Figure 1).
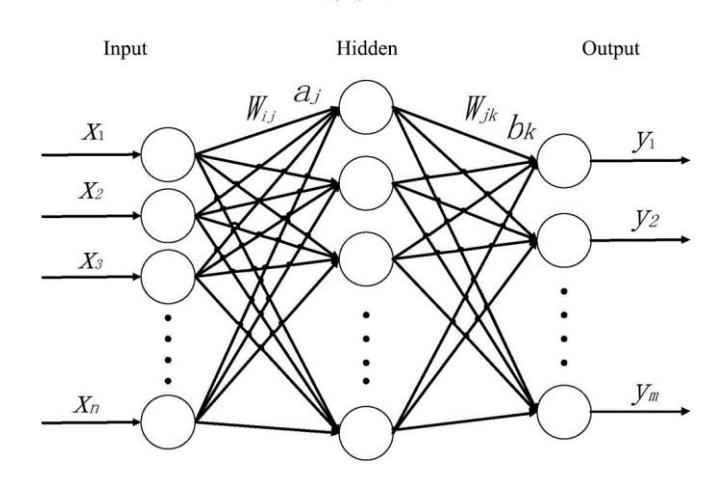
Figure 1. Principle of neural network method.
The biggest advantage of this method is that researchers do not need to pay attention to the type of mathematical mapping between the input value and the output value. In fact, this kind of relationship will become very complicated in the network. However, it is important to realize that the mapping of the optimal solution is generated in the form of a training network. Although many different types of artificial neural networks have been developed for specific purposes, the BP neural network model was used in this study because it is a mature technology that has been extensively applicatied. In order to train the network, data on representative regions were selected, including spatial, geographical, social and economic categories recognized in typology (Table 1). Ideally, this kind of network training should include more balanced and detailed regional data, but due to the limited data it was necessary to restrict the training in this supervised way.
Table 1. Type of data.
| Attribute category | Index | Explanation | ||
|---|---|---|---|---|
| Spatial attribute | Macro location | Reflecting the distribution of rural areas in the country | ||
| Meso location | Reflecting the convenience of transportation links between the village and the central city, delineated by distance | |||
| Geographic attribute | Terrain factors | Reflecting the natural distribution of the terrain in the countryside | ||
| Economic attribute | Regional development | Reflecting the per capita GDP level of the country where the village is located | ||
| Rural development | Delineated according to the per capita disposable income level of rural areas | |||
| Agricultural type | Reflecting the type of leading rural agricultural industry | |||
| Non-agricultural industry type | Reflecting the type of rural-led non-agricultural industries | |||
| Social attribute | Major ethnic group | Reflecting the attribution of rural national culture | ||
| History and culture | Delineated according to the historical and cultural relics of the village | |||
Another advantage of the neural network method is that it can be applied to feature selection (Dreyer, 1998). The fully trained network will estimate the importance of each input variable and remove variables that the network considers unimportant. This process is called network pruning, which is essentially based on the evaluation of the importance of each neuron. In the fully trained network, the efficiency of neuron removal can be calculated by the average value. If this value is very small, the neuron will be removed. This process can be repeated until all neurons that do serious damage to the neural network have been removed (Gao, 1998).
Classification Based on 480 Investigated Villages
Considering the data types and application of various methods commonly used in the study of rural types, there are some common problems. For example, the identification of critical values is often subjective, resulting in some problems that are inconsistent with the actual situation. Hence, this study used a deductive method with three main stages: first, cluster the existing data through the method of systematic clustering analysis to get the results of the rural type that can be learned; second, select the same dimension of input data combined with the results of the initial rural type to complete the training of the supervised artificial neural network model; third, based on the Xining case area data, verify the accuracy and feasibility of the neural network method.
Classification Criteria
According to the principle of the neural network method, we must find a learnable data set that includes rural type division so that we can use this method to carry out further rural type prediction. In 2015, Tongji University was commissioned by the Ministry of Housing and Urban-Rural Development to carry out a field survey of 480 villages in 13 provinces nationwide. In this survey, a matrix classification table of rural type attributes was established (Tongji University, 2016), thus obtaining the type attribute data of 480 villages (Table 2).
Table 2. Total number of surveyed villages by attribute.
| Type | Matrix Attributes and Number of Villages | |||||
|---|---|---|---|---|---|---|
| East | Middle | West | Northeast | Total | ||
| Macro location | 126 | 28 | 268 | 58 | 480 | |
| Meso location | Urban suburban village | Suburban village | Far suburb village | Remote area | ||
| 112 | 162 | 149 | 57 | 480 | ||
| Terrain factors | Mountain village | Hilly village | Plain village | Mountain plain village | ||
| 121 | 112 | 183 | 60 | 480 | ||
| Regional | Developed | Medium | Undeveloped | Backward village | ||
| development | 119 | 144 | 124 | 93 | 480 | |
| Rural | Developed | Medium | Undeveloped | Backward village | ||
| development | 92 | 175 | 111 | 102 | 480 | |
| Crop farming | Forestry | Animal husbandry | Fishery | Others | ||
| Agricultural type | 402 | 11 | 24 | 24 | 19 | 480 |
| Non-agricultural | Industry | Business | Service industry | Tourism | Others | |
| industry type | 65 | 24 | 36 | 57 | 23 | 205 |
| Major ethnic | Minority | Han nationality | ||||
| group | 109 | 371 | 480 | |||
| History and | Traditional Chinese | Historical and | General | Non-traditional | ||
| village | cultural village | traditional village | village | |||
| culture | 18 | 12 | 74 | 376 | 480 | |
On the basis of the above data, we subdivided the rural type in traditional cognition. This study used the method of hierarchical clustering analysis to analyze the initial data set from 480 villages, which contained nine dimensional data of four categories: spatial, geographical, social and economic. By measuring the data similarity of each individual type, two similar categories were merged into a new category until all objects were merged into one category. According to the principle of prominent neighboring types, the data similarity in the clustering results was screened and the number of clustering categories was selected. Combined with the findings from the field survey, clustering results that were very different from the actual types were eliminated, so finally the most appropriate classification results were obtained. Lastly, the clustering results were divided into five categories: primary development, regionally driven, transformation breakthrough, independent development, and high-level development.
Result of Type Division
Based on the type results of the above rural type division, through the statistical analysis of the data from the 480 villages, the mean value attribute features were extracted to explain the characteristic attributes of the type division results (Table 3). According to characteristics that have an impact on rural development, the five types are in different stages of transition vertically. The horizontal comparison also contains a great deal of rural characteristics in this development stage.
In terms of the proportion of quantity, there were some differences in the proportion of five types of villages in the sample of 480 villages. The proportion of type A (primary development) villages was the highest, reaching 30.4%; the proportion of type B, type C and type E villages was the same, 22.5%, 19.4% and 20.2% respectively, accounting for about one fifth of the total sample; the proportion of type D (independent development) villages was the lowest, at only 7.5%. Combined with the characteristics of national conditions, the classification results of the 480 villages were essentially in line with the basic cognitive image of rural areas. The number of underdeveloped villages was far higher than that of more developed villages. The development of different types of non-agricultural industries affects the level of rural economic development. The smallest number for D-type (independent development) villages also shows that the current rural development mechanism in China lacks power from the bottom up, which is consistent with reality.
From the perspective of the characteristic attribute, type A (primary development) villages were located far away from surrounding central cities, most of them were in hilly or mountainous plain terrain, and traffic conditions were not convenient. The whole regional economy was in an underdeveloped state, which basically depends on agriculture for development. This type of villages accounted for nearly one third of the total sample. Type B (regionally driven) villages were located close to a central city, mainly in hilly areas. The overall regional economy was also underdeveloped, but non-agricultural industry had started and developed to a certain extent. They were more engaged in some commercial logistics activities, accounting for nearly a quarter of the total. Type C (transformation breakthrough) villages were located relatively close to a central city, mostly in plain areas, with a moderate regional development and rural economic development level, still without non-agricultural industry, accounting for about one fifth of the total. Type D (independent development) villages were also relatively close to a central city and located in plain terrain. The economic level of the whole region and the economic development of the villages themselves were of medium level. Most of the nonagricultural activities were related to tourism. It is worth noting that most of the primary industries in this type of villages consisted of fishery, accounting for less than one tenth of the total. Type E (high-level development) villages were located closer to a central city, maybe already within a continuous urban area. The regional economic level and the development of the villages themselves were in a better state. Agriculture was dominated by planting industry and there was a certain amount of non-agricultural industry, accounting for one fifth of the total.
| ribute egory | Index | Category A | Category B | Category C | Category D | Category E | ||
|---|---|---|---|---|---|---|---|---|
| Country | Type | Primary development 146 | Regionally driven | Transformation breakthrough 93 | Independent development 36 | High-level development 97 | ||
| i | Co t | Quantity | ||||||
| Proportion | 30.40% | 22.50% | 19.40% | 7.50% | 20.20% | |||
| Macro location | West | West | Middle & West | Middle | East | |||
| Feature attribute | Spatial attribute | Meso location | Outskirts of the central city | Located in the suburbs of the central city, far from the city | Suburban city center, closer to the city | Suburban city center, closer to the city | In the suburbs of the central city, or connected to the city | |
| Geographic attribute | Terrain factors | Hilly plain or mountain plain | Hills | Plain hills | Plain | Plain | ||
| Regional development | Undeveloped | Undeveloped | Medium | Medium | Developed | |||
| Economic attribute | Rural development | Medium | Underdeveloped deviation | Underdeveloped preference | Medium | Moderately developed | ||
| Agricultural type | Crop farming | Plantation or forestry | Crop farming | Fishery | Crop farming | |||
| Non-agricultural industry type | No | Business | No | Tourism | Industry | |||
| Social attribute | Major ethnic group | Han nationality | Minority | Han nationality | Han nationality | Han nationality | ||
| History and culture | Non-traditional village | Non-traditional village | Non-traditional village | Non-traditional village | Non-traditional village | |||
Table 3. Village type and characteristic attributes.
Although the above classification is close to the real situation, in order to further demonstrate the applicability of the neural network method for the classification of rural types, Xining City, which we are familiar with, was selected as the validation case. The same table with 88 rural classification attributes was used to classify the villages in Xining City. The actual observation experience was used as the validation to test the model.
Test of the Xining Case
In the case of Xining City, considering the influence of samples from Qinghai Province, we used two models, one to deduct samples from Qinghai Province, the other to include samples from Qinghai Province.
A Learning Model Excluding Samples from Qinghai Province
Excluding the sample data from Qinghai Province, a total of 439 rural sample data were used to study and train the neural network model. By repeatedly testing the accuracy of the neural network model, a comprehensive accuracy rate of 83.9% of the learning model was finally
obtained, after which the 88 rural sample data with the same dimension attributes were used to get the prediction classification results (Figure 2).
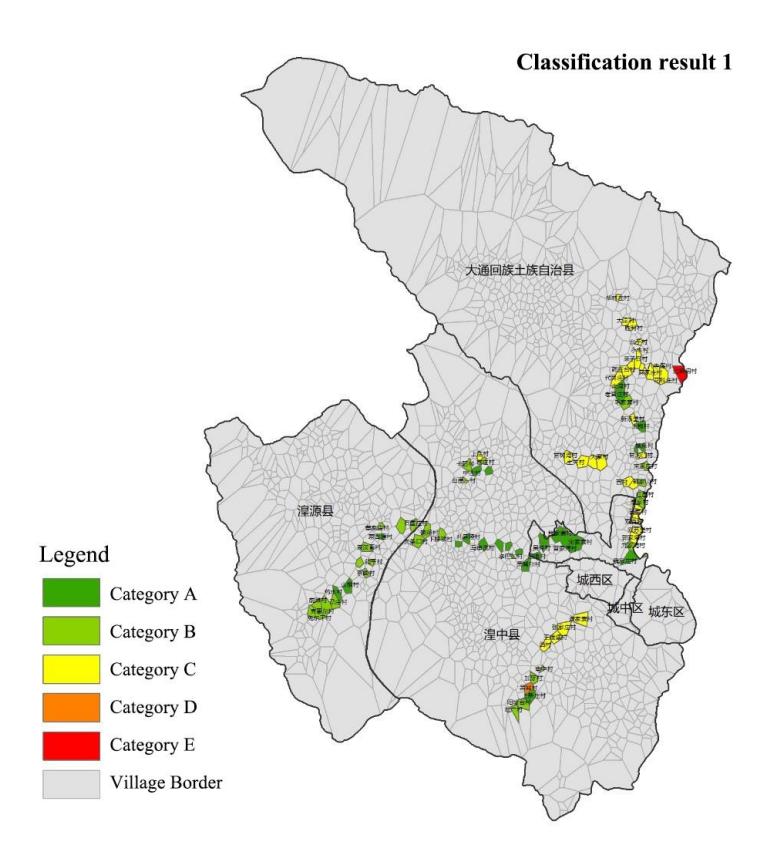
Figure 2. Prediction classification results excluding Qinghai Province samples.
The result of this classification included all five types of villages. The underdeveloped type A (primary development) and type B (regionally driven) villages accounted for 61.6% of the total, while type C (transformation breakthrough) villages accounted for 36.4% of the total, and there was one type D and one type E village respectively. The classification result shows that almost all of the Xining samples were underdeveloped villages and relatively underdeveloped villages; the proportion of these three types of villages was almost the same. This is close to our findings from the field survey, with the error within an acceptable range. The field survey indicated that most of the villages were underdeveloped, while only a few were relatively underdeveloped.
Looking at the distribution characteristics of various types of villages, type A (primary development) villages were mostly located in the suburbs or continuous areas, which is quite different from the rural distribution we know from experience. However, from the perspective of classification characteristics, the most underdeveloped suburban type villages should not appear in this area. It can be seen that this learning model is not accurate enough for the prediction and classification of type A (primary development) villages. By observing the distribution characteristics of type B (regionally driven) villages, it was found that the distribution of type B (regionally driven) villages was basically consistent with the findings from the field survey and also basically consistent with the description of the classification attributes. The economy was underdeveloped and located in the suburbs, i.e. relatively far away from a central city. We believe that the prediction and classification of type B (regionally
driven) villages by the model was more accurate. The C-type (transformation breakthrough) villages were located in the suburbs of a central city in terms of distribution and the economy was relatively underdeveloped, which is consistent with the classification characteristics and attributes, and also basically consistent with the findings from the field survey. It can be seen that the classification of the C-type (transformation breakthrough) villages was relatively accurate. Finally, the two remaining types of villages, type D (independent development) and type E (high-level development), appeared in two isolated locations far away from a central city, which is different from the classification characteristics and our field survey. The economic development level of these two types of villages is far from the relatively developed level, but these two types were far from the relatively developed level. There is only one rural area in China, accounting for a very small proportion.
In general, excluding the neural network learning model of the Qinghai Province samples, the prediction results of the Xining area case, although the overall proportion of various rural types was within the acceptable range, there were still a few villages far from the actual situation to some extent.
Learning Model Including Samples from Qinghai Province
We chose to train all 480 rural sample data for neural network learning and then through repeatedly testing the accuracy of the neural network model, we finally got a learning model with a comprehensive accuracy of 81.8%. Then we used 88 rural sample data of the same dimension attribute to get the prediction and classification results (Figure 3).
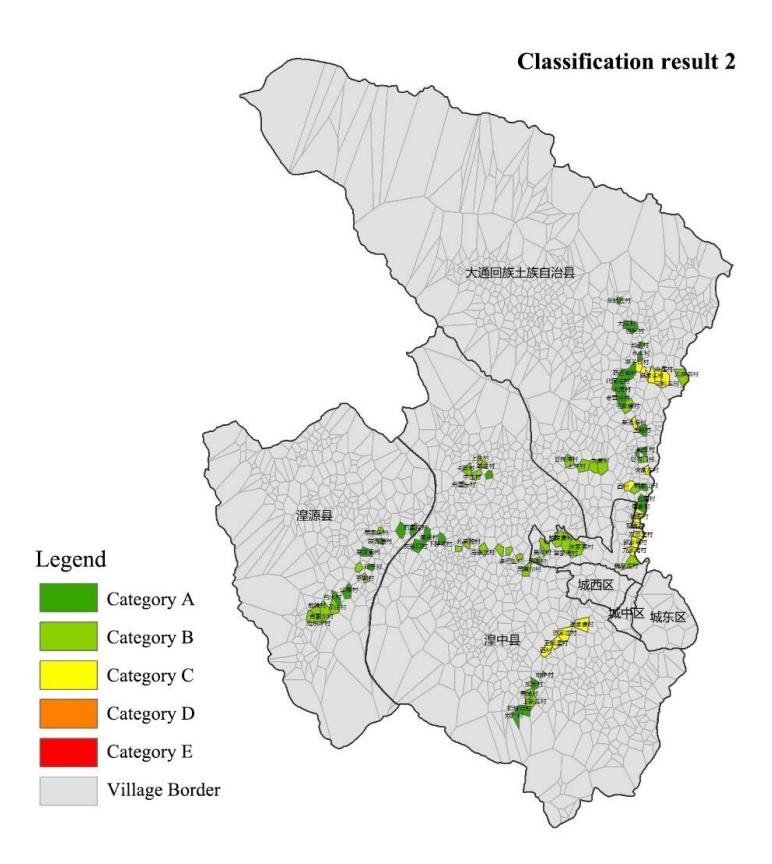
Figure 3. Prediction classification results including Qinghai Province samples.
The classification results only included three underdeveloped and relatively underdeveloped rural types A, B and C. The underdeveloped rural types A (primary development) and B (regionally driven) accounted for 78.4% of the total, while the rural type C (transformation breakthrough) accounted for 21.6% of the total. The classification results show that nearly four fifths of the villages in the Xining sample were underdeveloped villages and the underdeveloped villages accounted for an absolute proportion that was highly consistent with the findings from the field survey. In 2017, the per capita disposable income of all residents in Xining was 23792 yuan, which was lower than the national per capita disposable income of 25974 yuan in the same period and slightly higher than the median of the national per capita disposable income of 22408 yuan. Among them, the disposable income of urban and rural residents was 30043 and 10548 yuan respectively, i.e. lower than 36396 and 13432 yuan for the whole of China. The difference is that the two incomes were lower than the national median of 33834 and 11969 yuan. Xining area was still in a relatively underdeveloped stage, as manifested in rural areas, which shows that most of the rural types were underdeveloped.
Specifically, according to the distribution characteristics of all types of villages, three types of villages, A, B and C, had a central urban area as the center, showing a ladder-like distribution. The closest village to the central urban area was type C (transformation breakthrough), while in contrast, the villages located far away from the central urban area were mostly type A (primary development). Type B (regionally driven) villages were mostly in a spatial transition zone of two types of villages, A and C. This reflects the consistency between the transition of A and C rural development space and the transition of the development stage, especially in a continuous rural belt. For example, from the central urban area to Datong County, the villages close to the central urban area were of type C. With the increase of distance, the type gradually transitted to type A. In general, the distribution characteristics of village types A, B and C were consistent with our field survey cognition.
By studying the distribution of the classified prediction results, we found that the impact of the county on the surrounding villages was far lower than that of the central urban area, and almost did not contribute to sudden rural change and leaping development. In the radiation area close to the central urban area and the county, most of the villages were type C (transformation breakthrough). As shown in Figure 3, from the central urban area to Datong County and Huangzhong County, the villages were concentrated and of type C, while the villages located farther away gradually changed to type A and type B, similar to a ladder distribution. Of course, these villages were all distributed around main traffic arteries, which is also a factor that needs to be taken into account in relation to the distribution characteristics.
It also shows that the classification results were consistent with the field survey related to the intervention of external capital forces that also contribute to a qualitative change in the rural development of small regions but are not able to surpass the impact of the central urban area. As shown in Figure 3, when the surrounding villages were of type A (primary development), with tourism development and scenic area construction, the influx of capital makes the region's villages leap to type C (transformation breakthrough). Looking at the Kayang area and the Shangen to Tuergan section in the picture, the development of these two areas is also due to the development of rural tourism, which has made most of the villages in the two areas jump to type B (regionally driven). In three areas far away from the central urban area and the county seat, the same rural type mutation occurred, showing different village types. It can be considered that the impact of the length of external capital force intervention time and construction cycle. Therefore, it can be preliminarily considered that the intervention of external capital forces is enough to make a small area of rural leaping development stage, but it can not make it leaping developed and underdeveloped stage.
Interpretation of Results
In the classification of the neural network model excluding the sample training in Qinghai Province five types of villages were generated. The model recognized that Bianmagou village, which had a relatively developed tourism industry in the region, and Heicheng village, which was the only traditional Chinese village, have changed a lot according to their type. This type of change tended to be positive. Comparing classification result 1 with classification result 2 as a whole, classification result 1 was generally more optimistic than classification result 2, which mainly showed a large reduction of type B (regionally driven) villages and a large increase of type C (transformation breakthrough) villages.
Combined with the field survey information from Xining City, classification result 2 including the Qinghai data was closer to the real rural development situation. Because of the great difference in economic development between the east and the west of China, the level and balance of rural development in the western region are far lower than that in the eastern region, and the use of classification result 1 excluding the data from Qinghai Province produced more optimistic classification results. In fact, part of the C-type (transformation breakthrough) villages in result 1 should be classified as B-type (regionally driven), while the D-type (independent development) and E-type (high-level development) villages in the more developed stage should not be defined. Considering the purpose of the verification process, there may be some other problems related to data training, so further work is needed to verify the impact of the training data used from different regions on the classification results.
Conclusions
All in all, the classification results based on the neural network method basically reflect the situation of the rural areas in the case area, no matter what the spatial distribution gradient of rural type or the continuity of their development cycle. Although all kinds of statistical data can be used to describe the characteristics of all dimensions, it is undeniable that no matter what type of variable data is used, as long as the magnitude of the data is large enough and the network training is sufficient, the application is effective to a certain degree. The application of this method not only can get rid of subjective factors from the selection of artificial critical values, but can also ensure objectivity to a great extent.
Against the background of rural revitalization strategy, we should adopt a policy-making mode of adjusting measures to local conditions, effectively guiding the development of different types of villages to help the development of rural diversity in different areas. Because of this, it is essential to classify the countryside scientifically. This paper reports an attempt to introduce the mature neural network method of European rural classification into China, and explore the adaptability of localization.
The process of neural network training and verification in this paper is still in the initial stage of exploration and still has some deficiencies. One has to do with the research of multidimensional classification, which lacks a more intuitive reflection of production and life, so it is necessary to verify the accuracy of the network horizontally with different input value attributes. Another shortcoming is that in the process of network training, the artificial design of the neural network model and its network accuracy have a more direct impact on the final result, while the network model can still be further improved. Thirdly, there are certain missing values. Although the neural network method is quite efficient in predicting missing values, this will still have a certain impact on the final results. Fourthly, the case data are mainly distributed along main roads with insufficient data coverage, which has a certain impact on the results. Based on the above deficiencies, we still need to further improve the accuracy and breadth of data in order to fully understand the complexity of rural types, and explore suggestions for different types of rural development in line with their own characteristics.
Acknowledgment
An earlier draft of this article was presented at the 3rd Endinamosis: International Conference on Rural Development and Community Empowerment, Bandung, November 2-3, 2019.