
Introduction
Industrialization is an essential condition for the economic growth of a nation (Hazra & Acharya, 2015). Urbanization and urban land transformation in both developed and developing countries are closely associated with industrialization and the relocation, expansion, and transformation of industrial land (Davis, 1965; Gollin et al., 2016; Leigh & Hoelzel, 2012; Zhang et al., 2018). Location is a concept that refers to where something is in relation to other things. This means that industrial location is not only a statement of the spatial distribution of industry but also of the relations between that distribution and other phenomena (Webber, 2020). One of the essential land-use planning stages is the introduction of appropriate locations for various activities, such as industrial locations (Stewart et al., 2004). If this task is not done properly, irreparable losses will be brought to the environment, ecology and economy of a region, and to human communities (De Montis, 2013). The high vulnerability of natural resources and the need to protect and maintain them, especially in developing countries, entails consideration of environmental standards for maximum sustainability, as well as the determination of the most optimal location for developing land use, particularly for industrial purposes (Taherkhani, 2008; Faraji et al., 2015). The development of industrial centers has drastic effects on all aspects of human life and in many cases has led to environmental crises (Azimi Hoseiniet al., 2012) due to a lack of interest in sustainable economic growth (Forslid et al., 2002) and failure to apply systematic methods based on sustainable development in siting. In order to achieve balanced regional development and maximum use of the resources in a region without damaging the environment it is necessary to establish an industry that is proportionate to the capacities, potentials, and ecological constraints of the region in question, as well as proper siting with regard to its economic, infrastructural, ecological, and other characteristics.
Location of economic activities has been a main topic of regional economic analysis since the publication of seminal works by Alfred Marshall (agglomeration economies), Johann Heinrich Von Thünen (land-use model), Alfred Weber (the impact of transportation costs on the location decision), William Alonso (Central Business District) and Walter Christaller (Central Place Theory) (Arauzo Carod, 2005). In The Wealth of Nations, Adam Smith already comprehensively addressed the location of industrial activities (Smith, 2010). However, in all of these works, location (locating) is relied almost merely on economic and technical criteria. Currently, a higher degree of complexity is needed; selection criteria now also involve several
social and environmental requirements. Industrial location often requires complex multi-criteria analysis, considering a complex set of factors involving economic, social, environmental, political and technical issues that may lead to conflicting objectives (Reisi, 2011). Generally, location theories are intended to provide a set of principles by which industrial firms can determine their optimal location (land) that corresponds to maximum profit (Papoli Yazdi & Rajabi Senajardi, 2011: 177).
Based on what was mentioned above, land suitability is of great importance for studies on landuse in general and industrial land-use in particular. In this regard, consideration of a set of environmental and socio-economic indices, including ecological capacity (Makhdoum, 1999; Karimi et al., 2010), vicinity (Pan et al., 2010; Van Vliet et al., 2009), accessibility (LUPD, 2008; Ameri & Barg Gol, 2007; De Kok et al., 2004) and limitations (Karimi et al., 2010), is necessary. Accordingly, the basic approach towards the siting of each of these activities requires consideration of restricting factors such as slope, altitude, protected areas, tourist areas, faults, landslide-prone areas and so on, as well as strengthening factors such as accessibility to resources, roads, markets, land, mines, energy, etc.
The most repeated errors in the location of industries are ignorance of future changes in industry location, ignorance of environmental and human factors, errors in applying decision-making methods and techniques, lack of accurate information on criteria affecting decision making, lack of proper prioritization of location based on criteria, location decisions based on personal interests and prejudices of authorities, insisting on short-term interests and ignoring future developments. Amini (2015), using the fuzzy TOPSIS methodology in a group decision-making context, evaluated the rural industrial site selection in a central province of Iran. Kamali et al. (2015; 2017) have suggested a combination of a geographical information system and a Delphianalytical hierarchy process approach to select optimum sites for large extractive industrial units. Reisi et al. (2018) developed a set of clusters comprising 10 criteria for selecting industrial site in the Isfahan metropolis, Iran. Using the analytical network process (ANP) and the analytical hierarchy process (AHP) methods, the relationships between the criteria and clusters were modeled and analyzed. However, developing a fundamental, rigorous, and scientific method for locating industries within an area seems to be necessary due to the current importance of industry for the national economy as well as for regional development, where industrial activities act as the engine for the development of other sectors while also having undeniable environmental impact. Therefore, this study aimed to develop an intelligent method based on criteria obtained from a literature review and experts for locating industrial estates regionally. We chose Markazi Province, an industrial province located in Iran, as our case study to implement the proposed method. This method can widen the scope of location theory using artificial intelligence (AI) models, including Artificial Neural Network (ANN), Fuzzy Inference System (FIS) and Adaptive Neuro-Fuzzy Inference System (ANFIS). The novelty of this model is that it is intelligent and systematic, where manual calculations based on individual judgments or political decisions are avoided to locate industries. Using real and up-to-date data and programming based on the MATLAB software and the GIS database leads to more principled location decisions in accordance with the goals of sustainable development. The rest of this paper consists of four sections. Section 2 presents the background of this study. Section 3 elaborates the research methodology. Section 4 provides the analyses and results, and Section 5 provides a discussion and the conclusions that can be drawn.
Background
Industrial Location, Its Determinants and Criteria
Since the 1980s, the empirical literature has documented the key factors of new production bases. Earlier research conducted in the 1980s-1990s usually used large territorial units, such as states, metropolitan areas, and prefectures, while recent studies have focused on smaller units, such as counties, districts, and municipalities (Arauzo-Carod et al. 2010).
The selection criteria are generally explained by several different features, expressed both as quantitative and qualitative measures that can involve some uncertainty (Rikalovic et al., 2017). Accordingly, determinants of industrial location have largely discussed based on factors including earning stable tax revenue, the creation of new jobs, and the maintenance of industrial agglomeration (Takano et al., 2018). Fernando et al. (2015) used seven criteria arrays of industrial location, i.e. soil type, land-use, water, archaeological sites, wildlife, roads, and power lines, in Colombo district, Sri Lanka. Muhsin et al. (2017) applied nine criteria such as natural resources, connectivity factors, and topographical features in analyzing optimal locations for industries in suburban areas in Bangladesh while warranting the sustainability of agricultural lands.
According to USAID research conducted on Serbia, the following criteria points are important in selecting industrial locations: labor costs, geographic position, availability of a quality workforce, transport infrastructure availability of raw materials, licensing and permitting procedures for the land, telecommunication infrastructure, the efficiency of local authorities, availability and cost of business premises, references from local partners and previous experience, cost of construction land, availability of construction land, level of political interference in business, ecology utility cost accommodations (Aleksandar et al, 2015). Ramya & Devadas (2019) considered soil characteristics, topographical features, natural resources and their constraints, connectivity, settlements, labor availability, availability of raw material, location of barren lands, climate, and the vicinity of major functional centers parameters in Tehri Garhwal district of Uttarakhand State, India. Autant-Bernard (2006) researched the location of research and development (R&D) activities in France; Arauzo-Carod and Manj on-Antolın (2012) and Alamá-Sabater et al. (2011) investigated industrial location in Catalonia and Spain, respectively; and Li and Zhu (2017) investigated R&D in Nanjing, China. In Japan, Nguyen et al. (2013) analyzed the determinant factors of new firm bases considering spatial effects. Ramaul & Ramaul (2016) also identified various factors affecting location, which are shown in Table 1.
Table 1. Key factors influencing the location in international research.
| No. | Key factors affecting industrial location | No. | Key factors affecting industrian location | |
|---|---|---|---|---|
| 1 | Transportation | 8 | Economic factors | |
| 2 | Utilities | 9 | Political factors | |
| 3 | Social infrastructure | 10 | Government attitude | |
| 4 | Human resources | 11 | Government regulations | |
| 5 | Raw materials | 12 | Incentives and tax structure | |
| 6 | Markets | 13 | Climate | |
| 7 | Industrial sites | 14 | Community | |
A survey on the distribution of industries in the geographical area of a country shows that, in some cases the location of industrial settlements was correctly subjected to principles and regulations. However, in many cases, environmental problems, water shortage, inappropriate land use, and so on occurred due to a lack of attention to principles and regulations during industrial location. Where in the past, location was based almost solely on economic and technical criteria, today a greater degree of complexity is expected. The criteria selected must also meet social and environmental factors as prescribed by state laws and regulations. Based on the literature review conducted in this study, including theories, models, documents, indicators/criteria (Rikalovic, Ilija & Djordje, 2014; Ramaul, & Ramaul, 2016; Rachdawong & Apawootichai, 2003; Yasouri, 2013; Nasorllahi & Salehi, 2012; Masoumi et al., 2010; Faraji Sabokbar, 2016; Ashornezhad et al., 2016; Shiri, 2001; Soleimani & Zangane, 2005; Ahmadizadeh et al., 2012; Khoshmouz, 2010; Rezaei & Ranjbaran, 2009 & Rachdawong & Apawootichai, 2003; Briassoulis, 1995 and the aforementioned ones) as well as the result of a Delphi questionnaire, 18 indices were extracted that were divided into 6 main categories. Figure 1 shows the general classification of these indicators.
Fuzzy Inferense System (FIS)
There are a number of decision support tools used to support industrial location, including geographic information systems (GISs) (Church, 2002), multicriteria decision analysis (MCDA) (Chang & Lin, 2015), fuzzy expert systems (FISs) (Rikalovic, & Cosic, 2015), genetic algorithms (GAs) (Alp et al., 2003), artificial neural networks (ANNs) (Yanar & Akyüre, 2007), and various combinations of these approaches (Fataei & Mohammadian, 2015; Rikalovic et al., 2015). The fuzzy inference system (FIS) is a computing framework worked on the basis of the fuzzy set theory, fuzzy if-then rules, and fuzzy reasoning. A fuzzy inference system is structured based on three conceptual components: (1) a rule base, which contains a selection of fuzzy rules. The general form of a fuzzy if-then rule is as follows: if X is A then Y is B; (2) a database defining the membership functions used in the fuzzy rules; and (3) a reasoning mechanism, which performs the inference procedure upon the rules and given facts to derive a reasonable output or conclusion (Delavari et al., 2013).
Mamdani, Tsukamoto, and Sugeno systems are three different types of fuzzy inference systems (Castillo and Melin 2008). The Mamdani and Sugeno systems are different in the consequence of fuzzy rules. Mamdani systems apply fuzzy sets as rule consequence, whereas Sugeno systems exercise linear functions as rule consequence. In Tsukamoto systems, the consequent of each fuzzy rule uses a monotonical membership function (Aengchuan & Phruksaphanrat, 2018).
In a fuzzy inference system, the crisp inputs are converted into fuzzy inputs by using a fuzzification4 interface. The rule bases are developed after fuzzification. The database and the rule bases together are referred to as the knowledge base. Defuzzification5 is used to transform the fuzzy values to real-life values, which are the output. FIS is performed in different applications for both manufacturing and management (Kocyigit, 2015; Camastra et al. 2015; Guner and Yumuk 2014; Nasrollahzadeh and Basiri 2014; Kovac et al. 2013).
4 In fuzzification, the crisp input values are transformed into fuzzy values.
5 In the defuzzification stage, the outputs of the fuzzy rules are combined to a crisp output value (for further study, see Aengchuan, P. & Phruksaphanrat, B. (2018), A comparison of fuzzy inference system (FIS), FIS with artificial neural networks (FIS+ ANN), and FIS with adaptive neuro-fuzzy inference system (FIS+ ANFIS) for inventory control, Journal of Intelligent Manufacturing, 29(4), 905-924.)
272 Hadi Aliverdilou, et al.
Adaptive Neuro-Fuzzy Inference System (ANFIS)
ANFIS is an adaptive network of nodes and directional links with associated learning rules (Hndoosh et al., 2012). Unlike FIS, ANFIS automatically generates adequate rules regarding input and output data and advantages the learning capability of neural networks. It is currently one of the most efficient tools exercised for system identification and pattern recognition as it can create accurate models of systems. This method does not demand opinions of experts for modeling and training of the system (Aengchuan & Phruksaphanrat, 2018).
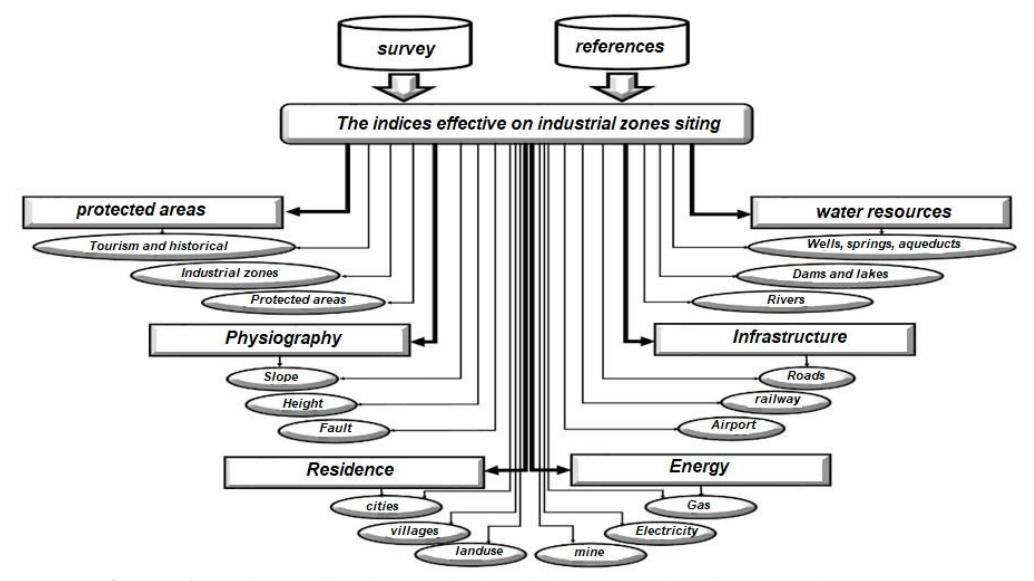
Figure 1. Indices effective on industrial estate selection. (Authors, 2020)
Methodology
In terms of its objective, this study was applied-developmental, while the analysis method used was descriptive-analytical (explorative). The data collection was field and library-based, done through the use of related literature, regulations, documents, books, theses, articles, and so on. The instrument for data collection was a questionnaire, with the use of a three-step Delphi survey (notecards, interview, observation). The statistical population included experts and scholars in the related field. A random sampling method was used. GIS and MATLAB software were used for the modeling of the data. Also, two fuzzy sub-systems, Inference System and Adaptive Neuro-Fuzzy Inference System, were used for the generation of fuzzy structures. These systems were generated by the operator and AI (see Fig. 2).
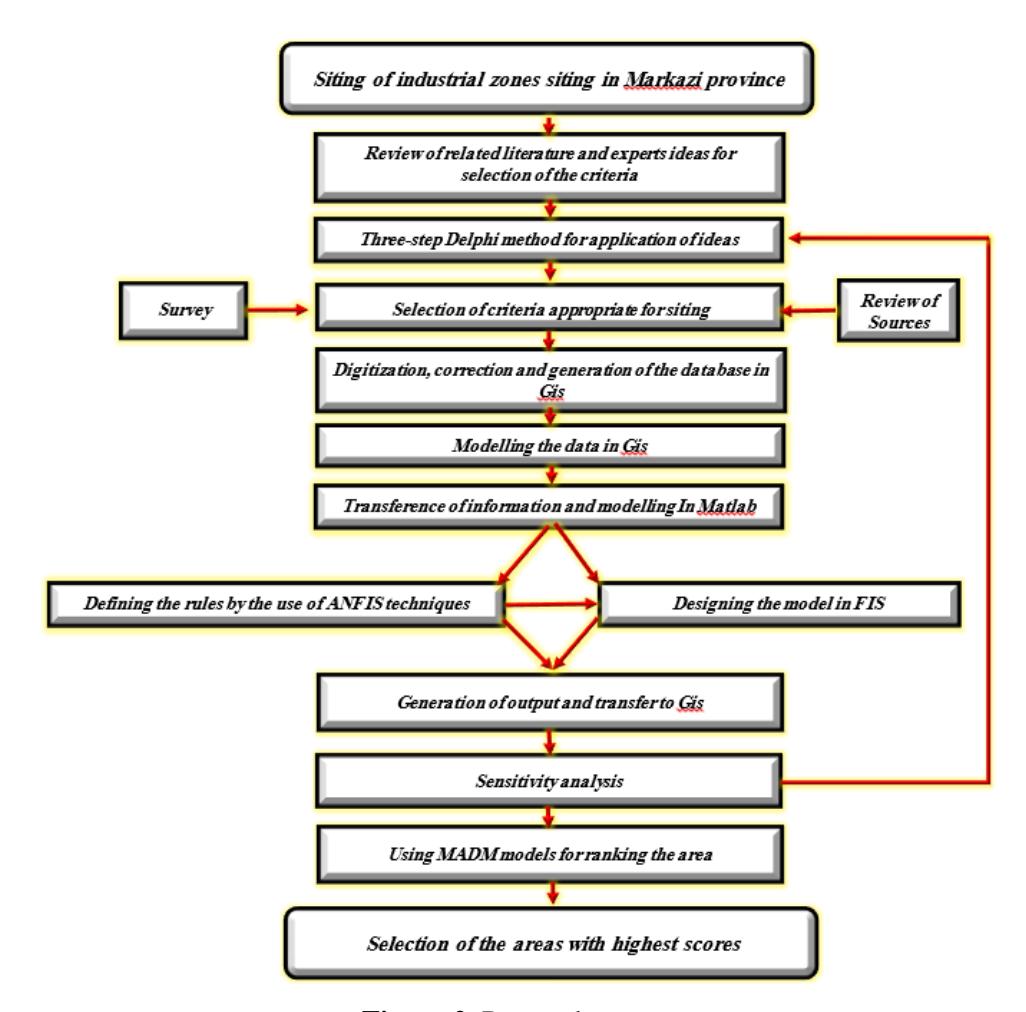
Figure 2. Research stages.
Specifications of the Studied Area
Markazi Province is located at 33° 23' to 35° 33'N and 48° 56' to 51° 3'N latitude and longitude respectively from the prime meridian in the central part of Iran (eastern part of Zagros). The total area of the region is 29,213 square kilometers, equal to 2,921,000 hectares, which is 1.9% of the total area of Iran (Management and Planning Organization, 2017). Figure 3 shows the location of this province.
The province has a variety of highlands, deep valleys, high slopes with high hillsides, open forests, and mountainous rangelands. In addition to the natural landscape of the region, parts of the province have been transformed by human and natural interventions. The variety of plant species in this province is high. So far, about 1,400 plant species have been identified in the province.
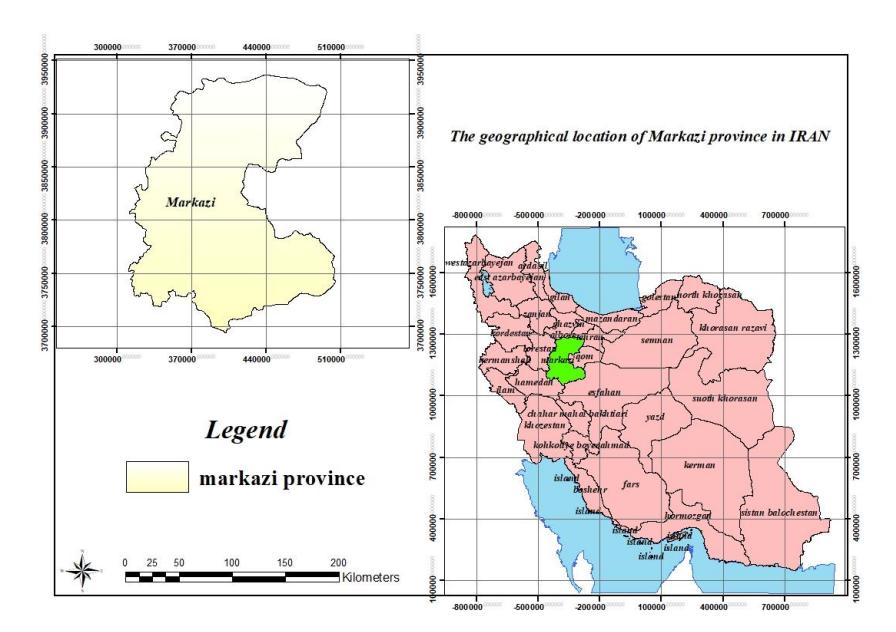
Figure 3. The location and coordinates of Markazi Province. (Management and Planning Organization, 2020)
Results
In this research, after collecting indices that are effective on zoning, the data in the form of maps and descriptive information was inputted into the Geographical Information System (GIS) software. In this phase, the data had to be corrected and digitized because it was gathered from different organizations and through a manual method. In this stage, the available maps' coordinates and scales were generated and integrated based on tools available in ArcGIS 10.4.1, such as Define Projection, Project Raster, Project, Editing, and Geo-referencing. In the second stage, since the layer has to be inputted in the MATLAB Software in raster form, some layers were fuzzified, after which all the layers were rasterized using tools available in GIS, such as the Feature to Raster, Distance, and Destiny tools. In this section, the input dimensions, which are the maps' pixels, should be considered as being fixed. Generally, there are two concepts: the mask and the cell size of the map. The mask is given by the four corners of the map, which should be refreshed, analyzed, and displayed within a certain range. In this case, the map covered the area of study that we have introduced, Markazi province. The cell size is the size of the pixels, where each pixel contains information about the map features, so that the information can be shared between layers. The sizes of all pixels should be equal. In the current research, the cell size was set to 100. In other words, the maps should have a fixed size (equal matrices) in order to be combined and transferred to the MATLAB software. These maps are the same as a matrix in MATLAB so that calculative operations can be applied to the data. After this stage, the data should be inputted into MATLAB in a specific format. There are some tools in the GIS toolbox that allow the transference of data to other systems for this purpose. In this stage, the data is transferred to MATLAB in a classified format by the use of the Raster to ASCII tool.
After collecting and extracting the indices and correcting and digitizing them, a database of the indices is generated in GIS in two parts, containing descriptive information and spatial information respectively. This descriptive information is transformed into the maps in the next stages and is linked to other maps.
After collecting and correcting the maps, the vector layers must be changed into raster ones. This operation is also accomplished using tools available in GIS. The measurement of the Euclidean distance of one or more phenomena or positions is called 'spacing', which is done with the Euclidean Distance tool in GIS. This tool allows the generation of total modeling areas in the form of a raster based on the position of each of the features and elements of the input vector layer. In the raster layer, each pixel has a value that shows its distance to the closest neighboring element. By using this function, the element borders or distance between them can be identified. This function is used for the determination of the spaces. After this stage, the raster maps are inputted into MATLAB in text format and saved in separate folders. In the next stage, 6 structures are generated using the Fuzzy Inference System (FIS). Generally, the FIS model structure follows Table 2. In this paper, there were 6 main components, each with 3 subcomponents.
| Subject | Water | Physiography | Residence | Infrastructure | Protection | Energy |
|---|---|---|---|---|---|---|
| resources | ||||||
| Input | 3 | 3 | 3 | 3 | 3 | 3 |
| Output | 1 | 1 | 1 | 1 | 1 | 1 |
| Frequency of membership functions on the input | 3 | 3 | 3 | 3 | 3 | 3 |
| Frequency of membership functions on the output | 3 | 3 | 3 | 3 | 3 | 3 |
| Number of rules | 27 | 27 | 27 | 27 | 27 | 27 |
Table 2. The specifications of the FIS.
Since the component 'water resources' had 3 sub-components, the number of formulas was 27, based on the following equation:
\[X^n = 3^3 = 27\] (i)
At the same time, 162 formulas were generated for all the structures. The output of all the components was equal. In fact, in these structures, the fuzzy rules are defined verbally for both the input and output, in the form of three features: premium, medium, and weak. The membership functions are numerically defined as membership function methods (triangular) and definitions of rules. Generally, the membership functions are defined based on the type and nature of the data and the index concept is defined according to the available membership functions. Figure 4 shows the FIS specifications.
Figure 4. Specifications of the FIS. (Authors, 2020)
276 Hadi Aliverdilou, et al.
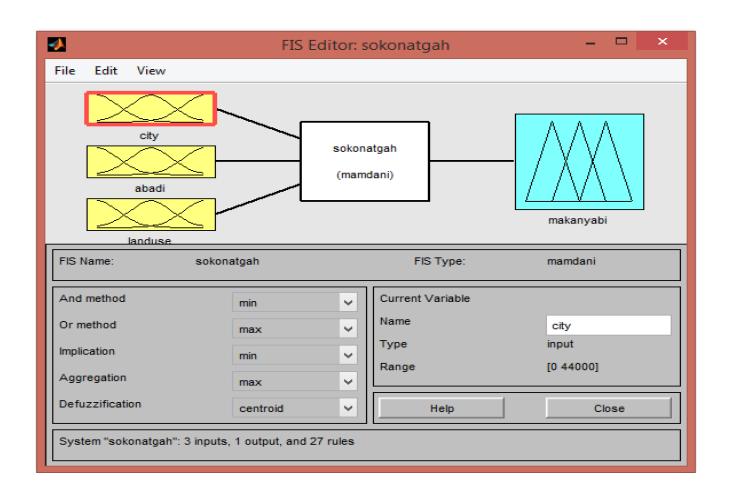
Figure 5. The database of the rules generated for the Residence component. (Authors, 2020)
As can be seen in the graphics interface of the FIS, this component has three inputs, i.e. City, Village ('Abadi' in Persian), and Land Use, with Siting as output ('Makanyabi' in Persian). Also, it has the inference engine as Residence ('Sokonatgah' in Persian), whose FIS is of the Mamdani type (see Figure 5). This graphic interface is the same for all of the components. In other words, the inputs and outputs are defined in this database. In this interface also the FIS features, including the specifications and functions, can be changed. The Center of Mass and Aggregation to the Center methods were used for defuzzification in this research.
In the graphic interface of the membership function (see Fig. 6), the verbal variables, the type of membership function (which is triangular here) and its parameters can be defined. On the left side of the interface, its range can be modified by clicking on each input. In this interface, the parameters are applied to the verbal variables based on expert knowledge and the literature available in the field of research. The division of the data range on the verbal variables is shown in the form of a graph as well. Through this graph, it can be determined which parts of the variables are more accumulated by the data. This graphic interface should be applied to all components.
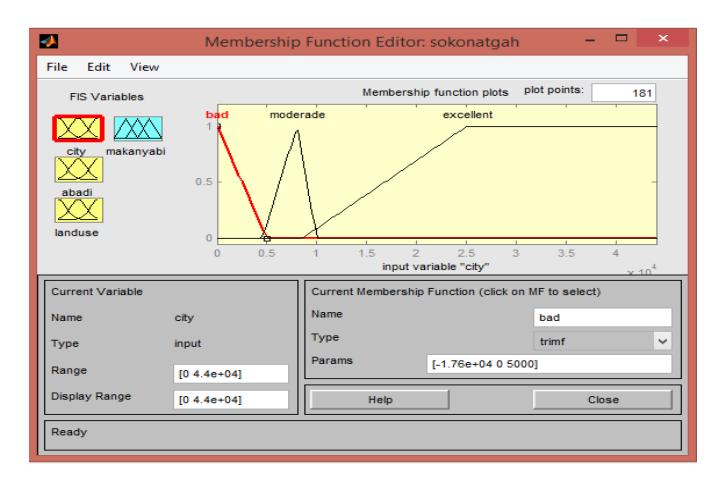
Figure 6. The graphics interface of the function generated for the Residence component. (Authors, 2020)
Figure 7. The graphics interface of rules defined for the Residence component (Authors, 2020)
After defining the input and output variables and determining their parameters, the rules are defined (see Fig. 7). This stage is the same as if-then rules. Here, forecasting is done by the use of if-then rules. Generally, the FIS is greatly affected by this context, since the result of the system is obtained in this context. The heart of an FIS is a database of its rules. However, the results can be manipulated and improved after the calculations. In this regard, for the generation of the rules, suggestions from experts and the related literature can be used to obtain better results.
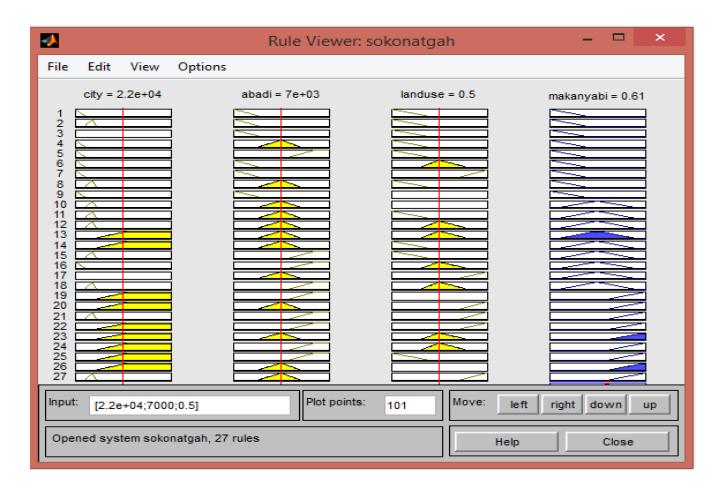
Figure 8. The results of the rules database for the residence component. (Authors, 2020)
The results of the rules database in the graphical interface are shown in Fig. 8. Here, if the distance from the city is 22,000 m, the distance from the village is 7,000 m, and the function is 0.5, the results of the system will be 0.61. Regarding the range of the fuzzy data defined for the output, the medium locations are raised to premium. Another region can also be evaluated in this interface. Using the red line in the middle of the interface and putting different numbers and parameters on the left side (input), decisions for other regions can be made.
Figure 9 shows the results of the rules database in 2D and 3D. In the generated patterns, the fuzzified as well as the defuzzified values from the system output are shown. Generally, the 278 Hadi Aliverdilou, et al.
pattern of changes in the output values can be observed by using these graphs. The generation process of other components also follows the above structure. This is not elobarated here because of space limitations, only the results and output of the structures are provided for a better understanding of the system in GIS. After generating the structures, the information layers are introduced into them and after the calculations by MATLAB, they are saved and the unique codes are added and introduced into GIS. The information is converted from ASCII to raster format. Based on the generated structures, maps of potential are generated. The information generated from the MATLAB calculations in the FIS model are shown in the format of a map with three color spectra, premium, medium, and weak, as shown in Fig. 10. The greenish regions have higher scores and are better areas for industrial estate selection.
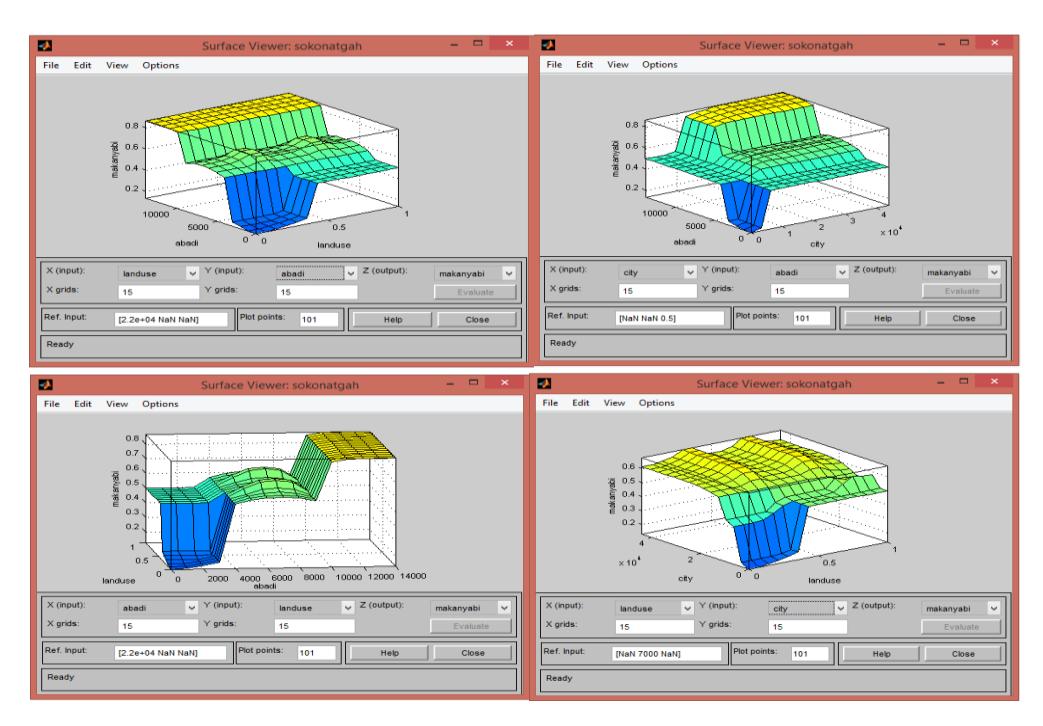
Figure 9. Demonstration of the rules database for the Residence component in the graph. (Authors, 2020)
After designing the FIS for all the components, the Adaptive Neural-Fuzzy Inference System (ANFIS) was designed. For this, the system had to be trained, since our goal was that the system should design the structures automatically through AI. We chose 100 training points from the output of the previous stage maps (FIS), which were our observation points. Our testing points were also three sub-layers from the main components, which were saved in the Excel Software at the end. In this step, MATLAB was opened to run the ANFIS function. The ANFIS function has different input and output arguments, and the information can be taught, tested, and checked.
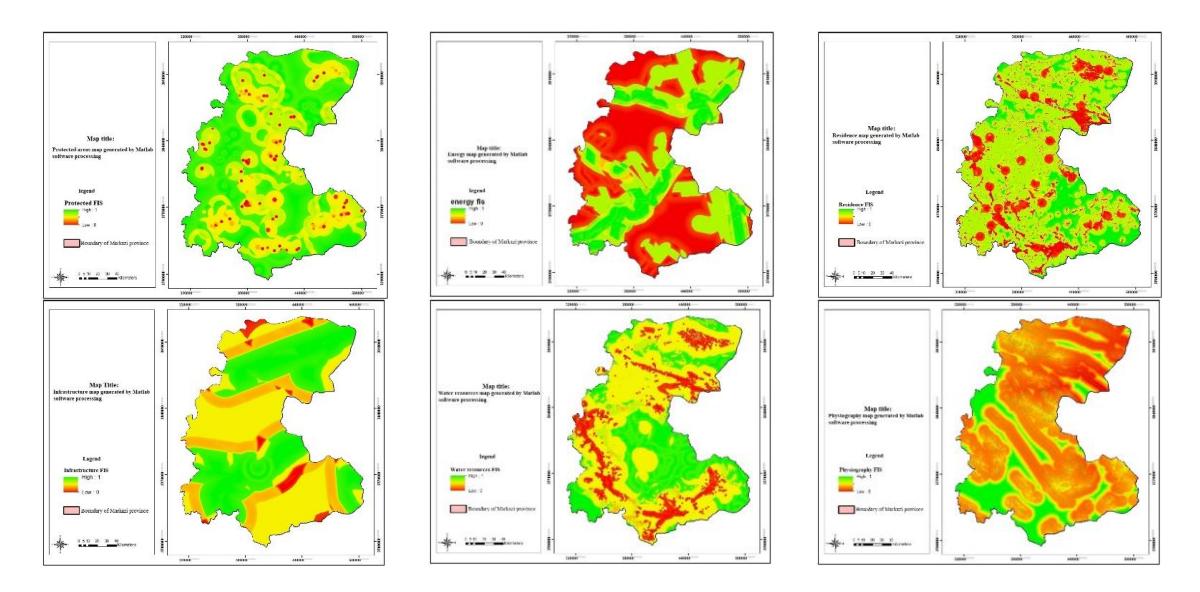
Figure 10. Maps resulted from calculations in FIS. (Authors, 2020)
An ANFIS structure of the Sogno type can be designed by the use of different membership functions as well as optimization methods, determination of the error domain, and determination of the number of membership functions. The triangular membership function with 3 3 3 membership functions and the output membership function are considered to be fixed-type. The number of periods and the optimal error are considered to be 3 and 0, respectively. The general interface of the ANFIS used for the energy component is shown in Figs. 11-13.
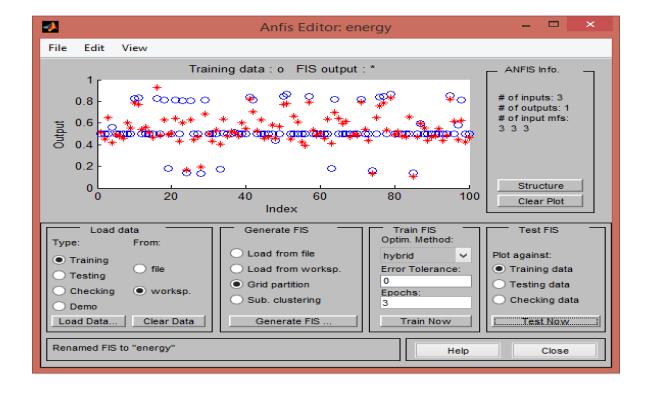
Figure 11. The ANFIS window for the generation of the energy structure. (Authors, 2020)
Figure 12. The type of input and output membership functions and the number of membership functions. (Authors, 2020)
Figure 13. The structure generated in the ANFIS model. (Authors, 2020)
As can be seen in the graph generated for ANFIS, each structure consists of three inputs, where each input has three membership functions, and each membership function has 9 rules. Finally, the output membership functions end in one output (see fig. 14). All the ANFIS structures also follow the same structure.
Figure 14. The general specifications used in the current paper for the ANFIS method. (Authors, 2020)
Finally, the information layers saved as a matrix in MATLAB are introduced into the structures and after calculation MATLAB saves them. Then, the codes are added and introduced into GIS. The maps generated from MATLAB computations in the ANFIS model are shown in Fig. 15. Here also, like the maps from ANFIS, the greenish areas have higher scores and are more suitable for industrial activities.
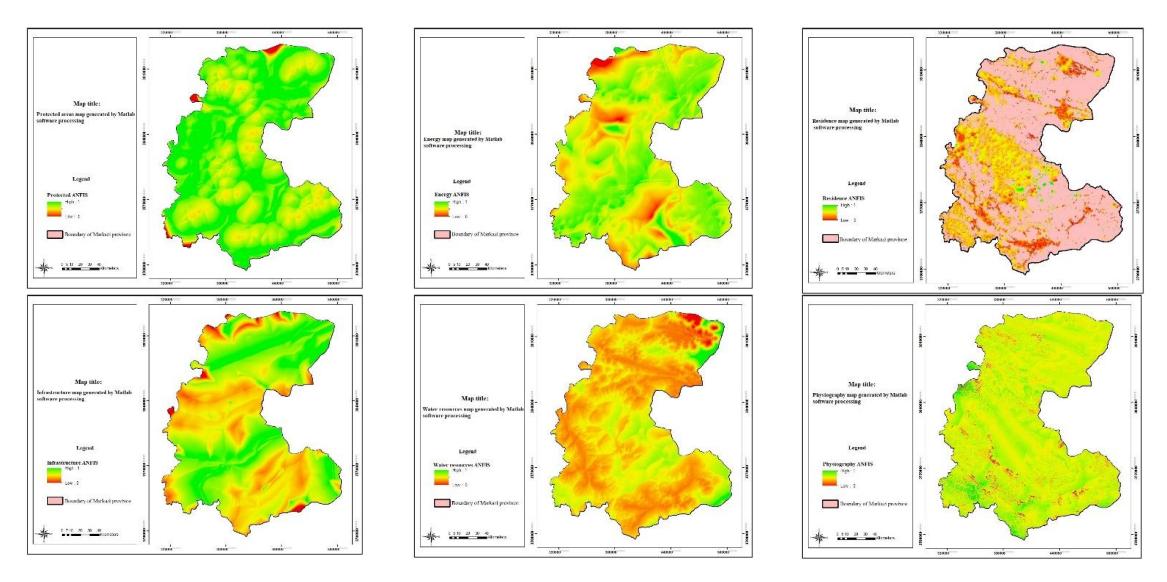
Figure 15. Output obtained from ANFIS structures in GIS. (Authors, 2020)
At the end of this stage, we deal with the combination of information layers from the output of the FIS and ANFIS structures using the fuzzy overlay method with gamma factor 0.7 in order to:
- 1. measure the designed systems;
- 2. compare the two designed systems;
- 3. analyze the subject sensitivity compared to the obtained result in the previous and current studies, and also compare it to the input information;
- 4. measure the conclusion of the designed system by the use of the available models.
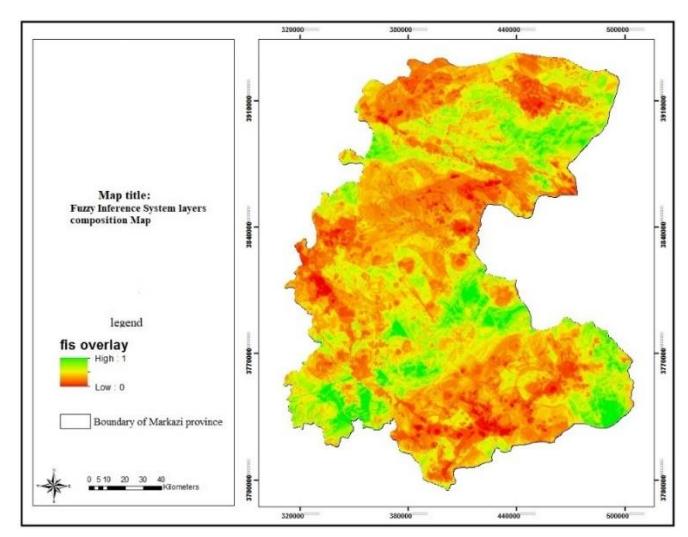
Figure 16. Combination of FIS layers. (Authors, 2020)
282 Hadi Aliverdilou, et al.
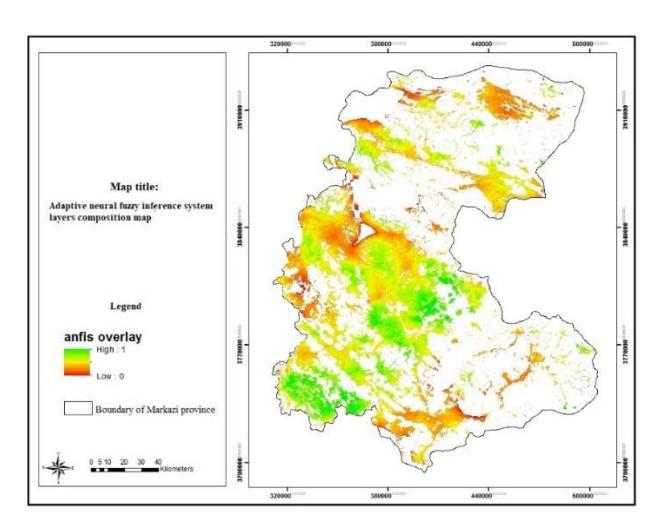
Figure 17. Combination of ANFIS layers. (Authors, 2020)
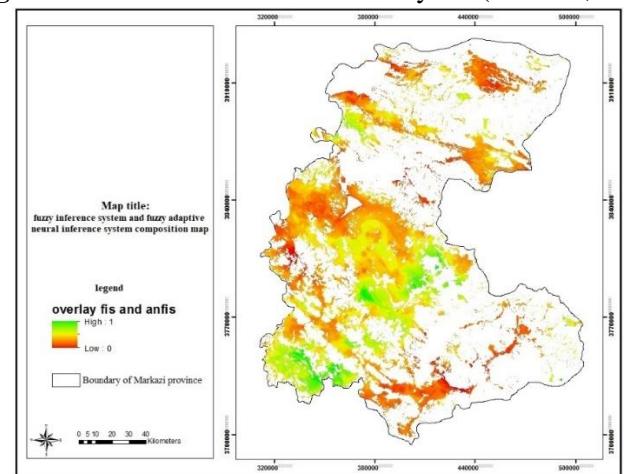
Figure 18. Combination of FIS and ANFIS layers. (Authors, 2020)
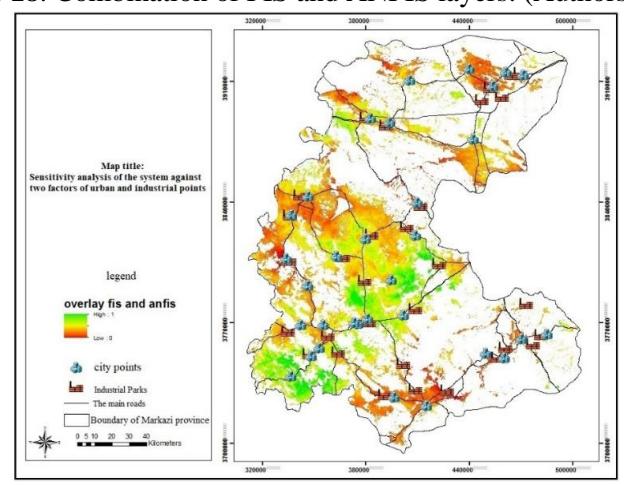
Figure 19. Sensitivity analysis of the system result compared to the indices of urban and industrial zones. (Authors, 2020)
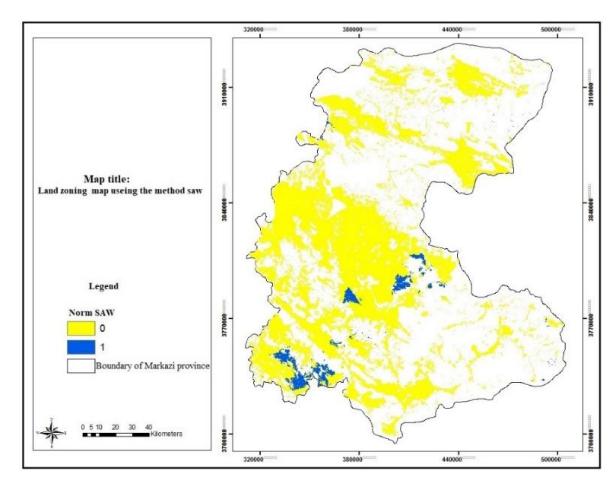
Figure 20. Industrial zones with a score of 0.7 and higher. (Authors, 2020)
In the maps generated by combining the output layers from the structures in the FIS and ANFIS methods, each participating in the combination process with a specific participation percentage, three levels (premium, medium, and weak) are extracted. After this stage, the output of the two models, which includes two maps (Fig. 16 and Fig. 15 with Cronbach's alpha of 0.7), are combined, as shown in Fig. 18. The results indicate that most of the industrial locations are situated in the southern part of the province. The results of the sensitivity analysis show that the index of cities, which has the largest effect on siting, is placed at a good distance from the industrial locations. This index is neither so far that services cannot be provided to the companies, nor is it so close that environmental pollution is caused (see Fig. 19). The index of industrial locations was also considered, because replacement and changes in function of protected areas are not possible owing to current conditions. Thus, we decided to consider this index as protected area, however, if we want to measure these locations and compare them to the results of the current paper, more than 90% of these areas do not conform with the results. In the final map, a total of about 42,968 hectares (1.48% of the province area) with a score of 0.7 and above, were extracted for building industrial settlements, mostly located in Shazand, Arak, Ashtian, Eastern Delijan, Western Saveh, and Eastern Zarandieh (see Fig. 20). After the evaluations and by the use of comparisons between the final maps, the input maps and the FIS maps it was revealed that FIS outperformed ANFIS since with FIS the operator has more control over the input, output, and the elements of the system.
Discussion and Conclusions
In land-use planning, the stages of decision-making, selection and allocation are highly important at the local and regional scales. Any error in these stages has negative consequences for socio-economic and ecological phenomena. The ultimate goal of land-use planning is to achieve sustainability and prepare desirable social and environmental outcomes as well as more efficient use of resources. For achieving these goals, the precise recognition of the current status and the existing natural and non-natural capabilities have to be taken into consideration. Considering four bases of land-use planning, i.e. land propriety or ecological capability, accessibility, vicinity, and limitation, it is necessary to create a balance between the three elements of human activity, natural bed, and the built environment. One of the important steps in land-use planning is the siting of human activities such as industry on a regional scale. Today, all human activities are either directly or indirectly dependent on industry. Industrial activities play a fundamental role in regional development but can cause also an outbreak of environmental issues.
The topic of industrial estate selection to maximize the profitability of activities while decreasing negative environmental effects is one of the most important issues in land-use studies on a regional scale. One of the objectives of the land-use policy in Markazi Province is the evaluation and determination of the location of industries in the region, using the affecting factors. Meanwhile, the mentioned policy seeks to serve interests at the regional level, which are related to the interests of the whole country. In this regard, when specifying the location for industries in a region, some conditions should be considered (economic, social, political, cultural, the type of the region's needs, the region capability, and others) to achieve stability of spatial relations of industries between the region in question and other regions in the country. This is expected to lead to relative economic and social improvements, a decrease in regional inequality, an increase in the quality of life of the people of the region in a material and spiritual sense, professionalism, a reduction of class inequality at the national level, non-polluting activities of the environment, etc., on a regional and a national scale. Therefore, the selection of appropriate areas for the establishment of industrial activities in a specific area through technical and accurate methods is one of the land-use policies in Markazi Province and Iran. Studying the related literature and the theoretical framework investigated in the current study revealed that the concepts and indices of siting have become more complicated over time and that modeling the resulted complexity requires a new methodology. Many existing location theories are based on factors such as closeness to the market, raw material, and transportation systems, where many of them are based on lowest costs and highest profit, while other affecting factors in industrial location are overlooked. However, after the 70s and 80s, with the outbreak of environmental issues, theorists were forced to rethink the factors that are effective in the siting of industries. Since then, natural and environmental factors play a more important role in industrial estate location.
After collecting the indices and conducting a review of the related literature and evaluations made by experts, FIS and ANFIS were selected as the methods to show uncertainties by the use of verbal variables. Then, after the determination of criteria with the help of references and experts, spatial modeling for industrial location in Markazi Province was conducted. After setting the criteria, the information is modeled in GIS using a series of available functions and tools in this system, categorizing the information into 6 main categories, i.e. energy, infrastructure, physiography, protected areas, residence, and water resources. Using FIS in MATLAB, these 6 main categories, each with 3 sub-categories, are constructed. For each structure, a database is generated in which the rules, functions, and the number of functions are verbally and numerically defined. The merit of the tools and methods used in this study is the use of computational power and information evaluation based on AI. Over 15 million pixels are analyzed for each measurement. Finally, the results from the FIS and ANFIS methods are inputted into GIS for demonstration and mapping. The advantage of information exchange between the two systems is that weaknesses and problems in the systems can be identified and solutions for them can be found. We used GIS because it shows the information in a specific spatial unit so that the operator can see changes in the spatial unit in the form of maps, and make conclusions based on these maps and provide solutions. By making a comparison between the maps obtained from both methods it was revealed that the results from FIS were closer to the reality than those from ANFIS, because the operator has more control over the system's input and output information with FIS. Other findings were related to the architecture and methodology of the research, where the processes effective on the selection were analyzed by the use of computational intelligence and a knowledge database. The limitations of this method are mainly related to access to real and up-to-date data. There are serious restrictions, especially related to security and military variables. In general, if there is free access to data, other
variables can be added to this model and more accurate and comprehensive results can be obtained. This limitation mainly occurs in underdeveloped countries, where either there is no relevant data or there is no transparency in data presentation.
Based on the findings, we propose the following directions for future research:
- 1. Applying this methodology to environmental and human studies in various fields.
- 2. Using the proposed methods in rural, urban, regional, and national studies.
- 3. If the proposed methods are used, it is be better to compress the knowledge base, since many analyses and calculations are affected by this section.
- 4. Applying more criteria to location or other applications.
- 5. Integrate and compare fuzzy and neural network methods with multi-criteria methods for better output.