
Introduction
Bandung City is the capital of West Java province, which is the second-most populous province in Indonesia after Jakarta. In 2020, the population of Bandung City was 2.4 million people with a density of almost 14,000 people per km2 (Bandung Statistics Agency, 2021). According to the National Spatial Plan, Bandung City is one of the National Activity Centers, serving international, national, and provincial scale activities (Indonesian Government Regulation No. 26/2008). Based on this function, the transportation infrastructure of Bandung City not only serves movement within Bandung City itself but also serves Bandung Metropolitan Area, which consists of Bandung City and several other cities and municipalities surrounding it.
In developing countries with lower living standards, poor public transportation service, cheap labor, etc., contribute to paratransit as public transportation (Li et al., 2011). The same image of public transportation can be found in Bandung City. The most dominant and widely available formal public transportation with the largest coverage in Bandung City is the angkot, a small four-wheeled vehicle (minibus) paratransit that has been modified for use as public transportation. As of 2020, the angkot system service area is covered by 5,521 cars on 39 routes (Bandung City Statistics, 2021). Compared to other kinds of public transportation currently available in the city (for example, the public bus system covers only 12 routes served by 142 buses and the local train covers only 1 route) it is clear that the angkot hugely dominates the public transportation sector in the city. However, the existence of the angkot as a means of public transportation poses a dilemma. On the one hand, this mode of public transportation is flexible as passengers can stop the angkot anytime and anywhere, without specific schedule or need to walk to a public transportation stop (Joewono & Kubota, 2005; Cervero & Golub, 2007; Li et al., 2011; Arifwidodo, 2012; Syabri, et al., 2013). On the other hand, the unorganized schedule makes the angkot unreliable in terms of travel time since they frequently make stops (Sutandi & Novaliya, 2009; Santoso et al., 2013). Apart from that, angkots are often accused of being the cause of traffic congestion (Tamin, 1996; Sutandi & Novaliya, 2009; Peranginangin et
al., 2018; Prasetiyowati et al., 2018; Wijaya & Imran, 2019). Their flexibility and the absence of fixed stops as well as the lack of management are factors that inhibit traffic flow. Considering that the existing road system serves mixed traffic, the slowdown caused by angkots often leads to traffic jams.
This unreliable angkot operation has created distrust and pushed people to find self-generated alternative solutions, mostly the use of private vehicles, thus creating more congestion. Given that the modal split between transport modes has remained relatively unaltered in recent decades, the levels of private car usage will lead to even greater levels of congestion and air pollution in urban areas (Batty et al., 2015). According to a research conducted by Susilo et al. (2007), 66.00% of private vehicle users in Bandung City do not use public transportation because they perceive public transportation as unreliable, overcrowded, inadequate with regard to operating hours, and insufficiently supportive. Moreover, Bandung's climate, with its relatively high rainfall, can make it uncomfortable to walk to public transport stops or transfer to another travel mode. According to the Bandung Statistics Agency, from 2016 to 2019 the average annual growth of private car and motorcycle ownership in Bandung City was 3.77% and 2.90% respectively. The increased use of private vehicles leads to even more congestion, especially when the growth of vehicle ownership is not balanced by the growth of transportation infrastructure. Current studies prove that with a high number of motorcycles and a large private car population, congestion in Bandung City is ever-growing (Farda & Balijjepalli, 2018). In other words, lack of adequate public transportation and the high number of personal vehicles is the root cause of traffic congestion (Pindarwati & Wijayanto, 2015).
To minimize the current congestion problems, according to the theory of transport demand management, ideally, there should be a modal shift from private vehicles to public transportation, which provides higher occupancy but uses less space (Ferguson, 2000). Even though the angkot is classified as paratransit, it has high capacity and is based on shared usage, hence it is perceived as more efficient than private vehicles. However, transportation mode choice highly depends on the preferences of the trip maker, not only influenced by rational factors but also by behavior and attitudes (Ortuzar, 2011; Abou-Zed et al., 2011; van Acker et al., 2010; Van der Waerden et al., 2008; Kingham et al., 2001). This means that in order to find a comprehensive alternative solution it is important to identify the mode choice pattern or the preference of people in selecting transportation mode concurrently with the willingness of the trip maker to switch modes.
Against this background, this research aimed to model the transportation mode preferences of Bandung City workers and combine it with their willingness to move out of their private vehicles and switch to the angkot. This issue emphasizes the angkot, because it currently has the biggest share in Bandung's transportation, while passengers increasingly leave this mode of transportation behind. Based on the fact that working people are the largest group that generates regular traffic, 47.78% of the total population in 2020 according to Bandung Statistic Agency's Data, this group is an important determinant in the transportation of Bandung City. Thus, interventions towards the mode choice of working people are assumed to have a significant impact. Therefore, the main question of this study was:
"What is the probability of working people using the angkot and what are the key factors that will increase the probability of workers in Bandung City to switch their mode of transportation from a private vehicle to the angkot?"
The angkot issue is not new. However, the problem persists and is still waiting for a resolution. The mode choice probability will change over time and may also be dynamic, depending on the situation or conditions of public transport at the time of study. This study provides a record of the mode choice situation in Bandung City, which is useful for policymakers in resolving transportation problems and for further studies. Different from previous studies that targeted public transportation in general, public transportation in this study was specific to the angkot, which is a very distinctive local attribute of Bandung City.
This paper is structured as follows. First, a theoretical review is provided that strengthens the argument that mode shifting from private vehicles is important in solving the traffic jam problem. In the second section, the methodology that was applied in this research is briefly explained. The third section provides an overview of the conditions related to the angkot and the current mode choice characteristics of workers in Bandung City. The fourth section describes the analysis result, which indicates the probability of working people using the angkot and what factors could be intervened in to increase the willingness of workers in Bandung City to switch their transport mode to the angkot. The last section is the conclusion, which confirms the possibility of the angkot operating in Bandung City. In this last section, recommendations are proposed to increase the mode shifting probability from private to public transportation to support the future development of Bandung City as well as recommendations for further study.
Theoretical Review: Why is mode shifting from private to public transportation the key to solving traffic jams?
Transportation is often defined as derived demand. Transportation is not a goal in and of itself but a way to reach a goal (Bouwman and Linden, 2004; Ortuzar & Willumsen, 2011; Tamin, 2000). Travel demand is not derived from the utility of the trip itself but rather originates from the need to reach a location, such as a residential area, a workplace, or a service location (Button, 2010 in van Wee et al., 2013). Mode shifting from private to public transport may be the key to solving traffic jams. To complement these insights and also to support the analysis, first the driving factors of high private vehicle usage will be explained. Secondly, the theory of transport demand management (TDM) will be described to show how this theory emphasizes demand management by increasing public transportation usage as one of the solutions. Finally, to provide a proper theoretical base for approaching the modal split, the theory regarding modal choice and willingness to switch transportation mode will also be reviewed.
Driving Factors of High Private Vehicle Usage
One approach that can be applied to define the transportation problem in an urban system is by comparing the gap between the demand and supply of transportation (Goodwin, 1969; Ortuzar & Willumsen, 2011; Tolley & Turton, 1995). Lack of transportation infrastructure supply, as well as unreliable public transportation, can induce private vehicle use. In turn, an increase in private vehicle use may generate larger transportation problems. Many experts illustrate the attraction between demand and supply as a circular loop in which the components are continuously interconnected and reinforcing each other. Even though Ortuzar & Willumsen (2011) and Goodwin (1969) have argued that the increasing use of private vehicles will generate transportation problems, Tolley & Turton (1995) in their analysis argue that transportation problems are not caused by the kind of vehicle used, but by economic factors when the price system fails to keep a balance between the demand for transport facilities and the cost of supplying them. Ortuzar & Willumsen (2011) assume that an increase in income will trigger people to use a private vehicle, even in when the supply of transportation infrastructure and its
facilities are unreliable. The increase in private vehicle use will reduce the demand for public transportation and at the same time will generate more congestion and travel time delay (Farda & Balijjepalli, 2018; Pindarwati & Wijayanto, 2015). On the one hand, a decrease in public transportation performance can be a driving factor for mode shifting from public transportation to private vehicles. The unreliability of public transportation makes it less preferred than private vehicles and only people who do not have alternative options ('captives') will still use public transportation (Marquez et al., 2019). On the other hand, to maintain its operation, public transport is forced to increase its fares as a consequence of increasing operation costs (more gasoline use due to congestion). At one moment this situation may become a factor that persuades public transportation users to start using a private car, and so the cycle continues, generating worse congestion.
Mode Shifting from the Transportation Demand Management (TDM) Perspective
Traffic congestion-related problems have always been associated with an imbalance between travel demand and the supply of facilities and infrastructure to accommodate it (Wei et al., 2017). Interventions toward infrastructure supply such as widening roads or constructing new roads are often considered obsolete. The current trend of transport management has shifted from managing the supply of transportation to managing the demand, which is widely known as the concept of transportation demand management (TDM). TDM is a set of policies whose objective is to influence travel behavior (Saleh & Sammer, 2009; Ison & Rye, 2008; Tamin, 2000). Transportation demand management can be conducted through increasing people's awareness to foster voluntary travel reduction or through a mechanism to restrict private vehicle use. Transportation demand management offers many different measures in many different sectors, including economic measures (public transport subsidies, fuel taxation, road user charging), land use (park-and-ride facilities), providing information for travelers (car-sharing), the substitution of travel with communication, and administrative measures (Ison & Rye, 2008). A policy that could be implemented in the TDM concept is mode shifting. Ideally, there should be a modal shift from private vehicle use to public transportation use, which has higher occupancy and uses less space (Ferguson, 2000). In line with this mode shifting, many countries in Europe (France, Germany, the Netherlands, Romania), Australia, and Asia have implemented policies attempting to restrict the use of private cars in favor of public transport (Nurden et al., 2007). Apart from minimizing congestion, other research has found that mode shifting from private to public transportation will also have a positive impact on human health and the environment (Rabl & de Nazelle, 2012). Even though this modal shift is perceived as an ideal strategy to minimize congestion and improve the environment, policies aimed at promoting the use of more sustainable modes should recognize that heterogeneity exists between travelers (Ettema et al., 2015). People's preference for a specific means of transportation over others is highly influenced by people's behavior and attitudes. Some studies indicate that private vehicle users can still prefer to use their own vehicles (Satiennam et al., 2016 and Dickinson & Dickinson, 2010). According to a study by Batty et al. (2015), measures to encourage modal shift from private to public transportation can be classified into two categories: 1) pull measures that persuade the traveler to use public transportation, such as improving individual quality attributes for the urban public transport system (safety and security, comfort, information, frequency and reliability, speed/journey time, multimodality/ease of use) and public transport quality rankings; and 2) push measures that dissuade the traveler from using a private car, such as congestion charging, parking regulation, and urban planning/form.
In the context of developing countries where the public transportation system is inadequate, the existence of paratransit is an alternative choice for people to meet their daily transport needs.
Paratransit modes in developing Asian cities are regarded as an indispensable form of public transport that fills the service gap between private modes and mass transit systems, offering a personalized, flexible, and convenient transport service to general citizens with a certain service quality and a reasonable fare (Phun et al., 2019). The gap between the high demand for public transportation and the low supply of mass public transportation by the government, encourages the private sector to compete in providing reliable paratransit services. The angkot is the most popular paratransit in Bandung, Indonesia (Syafriharti et al., 2018). In 2020, the angkot covered 39 routes, served by 5,521 cars (Bandung City Statistics, 2021). Entering the industry 4.0 era, the advancements in information technology have impacted the transportation market by introducing app-based paratransit. In 2018, approximately 69 brands of online transportation services were available in Indonesia (Riandiatmi & Joewono, 2018). App-based paratransit is a competitor to the angkot and has potency to take the angkot's passenger market. According to Yuana et al. (2019) there were five dominant frames that characterize app-based ridesharing in Indonesia and the Philippines: (1) commuter solution, (2) unregulated passenger transport service, (3) cooperative business, (4) non-conformity, and (5) informal livelihood. In spite of the emergence of app-based paratransit, the angkot still has its own market. From a legal perspective, angkot usage to support public transportation has been legalized for example in local regulation no. 4/2017. Considering it and its wide fixed route plan, which tends to be closer to the characteristic of public transportation compared to app-based paratransit, this study focused on angkot usage.
Mode choice is very dependent on the characteristics of the trip maker. In this research, mode shifting is focused only on the context of workers, considering that this group has high potential in generating travel. Transportation to the workplace is the biggest contributor to traffic volume (Hassan, 2016). The previous research by Susilo et al. (2007) indicated that from 1985 to 2000, the trip production rate of workers in Jakarta Metropolitan Area was 2.28 visits per day, which was twice more than for housewives or retirees. In the case of Bandung, around 53.7% of Bandung citizens mobilize on weekdays both to work and school (Triani 2019 in Afalia & Rachmat, 2020). These facts indicate that work trips greatly influence daily traffic. Moreover, the time-bound nature of work trips often implies heavy traffic during peak hours.
Mode Choice and Willingness as Driving Factors in Mode Switching
According to Ortuzar & Willumsen (2011), transportation mode choice is influenced by three kinds of characteristics, i.e. the characteristics of the trip maker, the characteristics of the journey, and the characteristics of the transport facility. Ortuzar and Willumsen break down these three characteristics as follows:
- 1. Characteristics of the trip maker: car availability and car ownership, possession of a driving license, household structure, income, and residential density.
- 2. Characteristics of the trip: trip purpose, time of day, whether the trip is undertaken alone or with others.
- 3. Characteristics of the transportation facility: a) quantitative factors, for example, components of travel time, components of monetary costs, availability and cost of parking, reliability of travel time and regularity of public transportation service; and b) qualitative factors, for example, comfort and convenience, the demand of the driving task and opportunities to undertake other activities during travel.
Several studies have deeply explored rational driving factors in mode shifting, for example, the research by Kingham, Dickinson, and Copsey on the commuting habits of working people in the United Kingdom. They found that significant improvement of public transportation and shortening the distance between residential areas and public transport stops will increase the willingness of working people to shift to public transport (Kingham et al., 2001). Abou-Zed and Ben-Akiva have conducted an experiment to investigate the effect of temporary use of public transportation by giving away free tickets to encourage the switch of transportation mode in two locations, Switzerland and MIT (Massachusetts Institute of Technology). Their analysis indicated that free public transport tickets seem effective in encouraging people to move from private cars to public transport (Abou-Zeid & Ben-Akiva, 2012). Looking back to the mode choice theory from Ortuzar and Willumsen, the driving factors in these two studies were analogous to the characteristics of the transport facilities, so that the characteristics of a transportation mode are assumed to mutually affect the willingness of people to switch their transportation mode.
Existing Condition of the Angkot
In the current situation, the internal movement in Bandung is served by three kinds of public transportation, which comprises the public bus, local train, and angkot. The angkot dominates with a total of 5,529 vehicle spread over 39 routes (Bandung City Statistics, 2021). In contrast, public bus only covers 12 routes served by 142 buses and local train only covers 1 route. The angkot is a paratransit minibus that has been converted for use as public transportation and has been legalized in Regional Regulation No. 4/2017, which states that a public motorized vehicle is any vehicle that is used for the transportation of goods and or people with a fee established in the regulation. What makes public transportation in Bandung different from that in other parts of the world is the presence of the angkot. According to the observation result, based on its capacity, one angkot can carry 14 passengers and 1 driver. However, there is usually an extra seat for two persons, which is far from meeting any safety standard. In fact, the extra seat being filled indicates over-capacity, which could harm the passengers. For illustration, below are some images of an angkot.
Figure 1. The exterior and interior of an angkot.
The picture on the left shows the exterior of the angkot. Its color indicates the route: cars with the same route have the same color pattern. In addition, passengers can also identify the route from the label attached to the front and back of the angkot (Wijaya & Imran, 2019). The picture on the right shows the interior of an angkot. Passengers sit side by side in rows without barriers. The angkot does not have a specific lane; it moves in the same road space as private vehicles. Since angkots often stop to drop off and pick up passengers, they are often accused of causing traffic congestion.
The pick-up and drop-off pattern of angkots is disorganized. If there is a passenger who wants to get off or if there is a potential passenger who wants to take an angkot, the driver will stop immediately at the place desired by the passenger. As mentioned before, there are no specific stop locations nor the rules about how long an angkot can stop at the roadside to load passengers (Joewono & Kubota, 2005; Cervero & Golub, 2007; Li et al., 2011; Arifwidodo, 2012; Syabri et al., 2013) and this often leads to traffic jam (Tamin, 1996; Sutandi & Novaliya, 2009; Peranginangin et al., 2018; Prasetiyowati et al., 2018; Wijaya & Imran, 2019). As for the payment method, the passengers pay the driver directly in cash. The price is adjusted to the distance covered by the passenger's ride. However, since passenger mileage is not measured precisely, the driver determines the price by estimates. Different drivers may charge different costs and so passengers are potentially disadvantaged by this uncertain rate system.
Research Methodology
Data Collection
The population in this research consisted of working people who were registered as residents of Bandung City, with a total of 1,167,849 people in 2020. Meanwhile, the number of samples was determined through a sampling technique. With a level of confidence of 90%, a sampling error of 5%, and assuming that population variance is 50% (p = 0.5), a total of 272 questionnaires were distributed. The questionnaires were distributed from April to May 2021 through an online survey. The criteria of respondents in this research were working people in Bandung City who have used the angkot before and regularly commuted to work before the pandemic.
The data to identify the mode shifting probability of workers from a private vehicle to the angkot in Bandung City was collected by distributing questionnaires. The questionnaire was divided into four sections. The first section of the questionnaire was about the characteristics of the trip maker. In this section respondents were asked about their age, education, occupation, monthly income, household structure including the number of family members who were employed and unemployed, car/motorcycle ownership, and driving license ownership. The second section of the questionnaire was about the characteristics of their transport facility. In this section, the respondents were asked about their mode of transportation, including their type of preferred vehicle, frequency of trips with the vehicle in a week, and their reason for preferring that specific vehicle before COVID-19 struck Indonesia in March 2019. In this section, the respondents were also asked about their transportation cost and their opinion on travel time efficiency, cost, comfort, and safety level of the current mode of transportation (angkot) in Bandung City before the pandemic. Apart from that, the participants were also asked about the distance from home to workplace, home to public transport stops, and from public transport stops to work along with the availability of paratransit (besides the angkot) that connect these nodes, and its fare. The third section of the questionnaire was about the characteristics of the journey. In this section, the respondents were asked whether they traveled along with other family members on their commute before the pandemic. The fourth section of the questionnaire was about the mode shifting and the willingness factors to move from a private vehicle to the angkot. In this section, the respondents were asked about the fuel price per liter that would stop respondents from using private vehicles. This question was asked based on the consideration that transportation cost is an important aspect that will influence people's preferences (Tu et al., 2016; Kumar & Ganguly, 2018). In addition, cheap fuel has also been alleged to be the main cause for the increased private vehicle use (Sopha & Pamungkas, 2016).
In this last section, respondents were asked about public transportation improvements that will make them stop using a private vehicle.
Data Analysis Methodology
To identify the mode choice probability of the angkot and the probability of mode shifting from a private vehicle to the angkot, two kinds of analyses were performed:
- 1 The characteristics of Bandung residents, including the characteristics of the trip maker, the characteristics of the journey, and transportation ownership, were analyzed through descriptive analysis.
- 2 Determination mode choice probability based on revealed preferences was conducted through logistic regression. The analysis was conducted with the SPSS (Statistical Package for Social Science) software. Meanwhile, the probability of working people switching to the angkot was obtained through stated preference.
- 3 To test the reliability of the generated model, some tests were conducted. These tests comprised testing of the feasibility of the regression model, the overall assessment of the regression model, and Test of Significance on the partial coefficient parameters.
Characteristics and Mode Choice of Working People in Bandung City: An Overview
Socio-Economic Characteristics of Working People in Bandung City
The questionnaire result revealed that around 83.09% of the working people who filled the research questionnaire possessed a private vehicle. These working people represent Bandung residents who actively work and routinely commute and have used the angkot before the pandemic. A trend in Bandung shows that there is a high increase in motorcycle ownership. The affordable price of motorcycles is the main reason for many people to prefer using a motorcycle instead of public transportation.
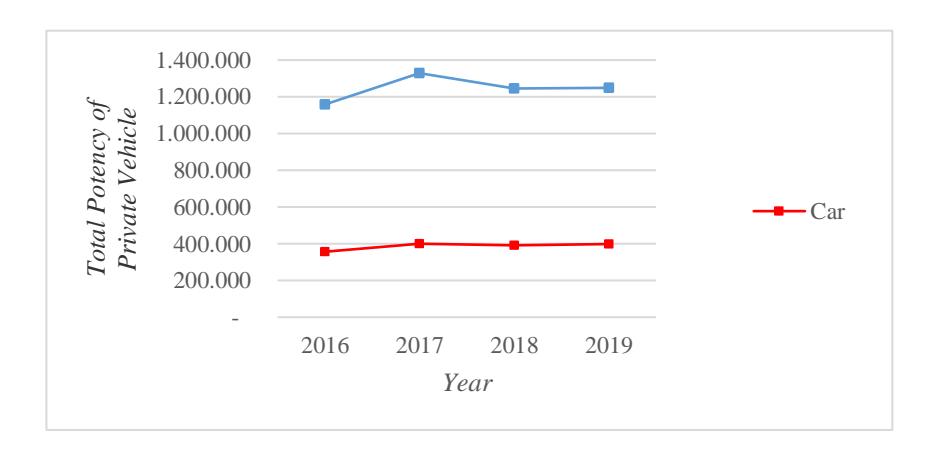
Figure 2. Private vehicle ownership in Bandung City 2016-2019. Source: Bandung Statistics Agency 2017-2020
The data obtained from the questionnaire survey indicates that in the current situation 83.09% of working people in Bandung City have a private vehicle. Of all the respondents who have a private vehicle, 96.46% had a motorcycle. To further analyze whether there was a relationship between the possession of a motorcycle and the income of the respondents, a cross tab analysis was applied to these variables. Based on this analysis, more than 60% of respondents in all income ranges owned a motorcycle. An interesting finding from the Bandung City case is that the percentage of motorcycles owned by working people with a monthly income lower than IDR 2.5 million was larger than the percentage of motorcycles owned by working people with a monthly income higher than IDR 10 million. This finding indicates that the motorcycle has become an affordable transportation mode that is accessible for all income groups.
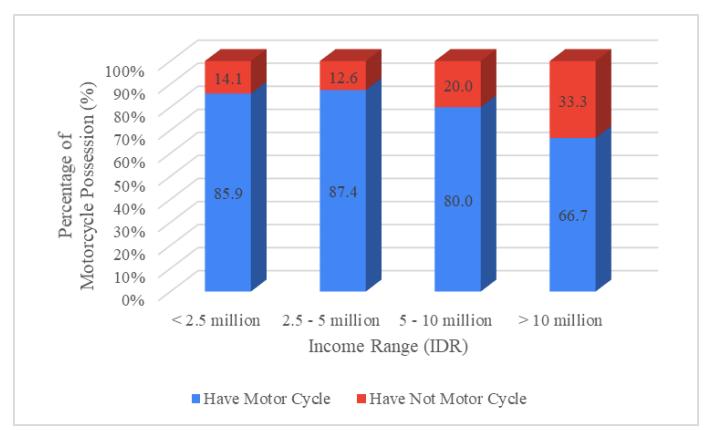
Figure 3. Relationship between income range and motor cycle ownership.
Characteristics of the Mode Choice and Transportation Facility
The second factor influencing transportation mode choice are the characteristics of the transportation facilities (Ortuzar & Wilumsen, 2011). This provides insight into people's preferences in choosing a certain mode for commuting as well as their considerations behind it. These considerations can be related to a variety of motivations, depending on the person. Based on the data obtained from the questionnaire survey, 72.79% of working people in Bandung prefer to use a private vehicle for their trips to and from work. Looking a little deeper into the kind of private vehicles used to support commutes, the data shows that 88.89% of private vehicle users prefer motorcycles as their transportation mode. This indicates that the use of motorbikes tends to dominate and that workers think the motorcycle has the best utility among the currently available modes of transportation. In the current condition, there is a tendency of a market-share shift after the entry of app-based paratransit in the transport services industry; 12% of workers in Bandung City prefer to use app-based motorcycles to support their daily work trip.
The motorcycle is the dominant mode for working people commuting to and from their workplace. Several factors cause working people to prefer motorcycles over other transportation modes. The main reason is its reliable speed and compact size, which makes it often faster than a car. This advantage increases in mixed traffic conditions with a high probability of traffic congestion. The fast speed and ability to avoid traffic jams are positively correlated and are the reason 52.84% of motorcycle users prefer motorcycles over other transportation modes.
Another factor that makes the motorcycle more preferred is because its transportation cost is lower compared to other transportation modes. From a total of 176 respondents who used private motorcycles to commute, 26.70% stated that the transportation cost of motorcycles is cheap and affordable. Apart from that, this mode was also rated as flexible by its users since –
unlike public transportation users – motorcycle users do not need to walk or take another form of paratransit to public transportation stops. Apart from that, motorcycle drivers can choose the shortest or the best route to get to their workplace on time. Different from trips for leisure or recreational purposes, commuters are tightly bound to a time frame. People have to arrive at work on time and as a consequence they tend to use the transportation mode that is considered the most effective and efficient. In line with this argument, approximately 30.11% of motorcycle users perceived the motorcycle as a flexible mode of transportation to support their commute. The detailed reasons for selecting transportation modes are provided in the figure below.
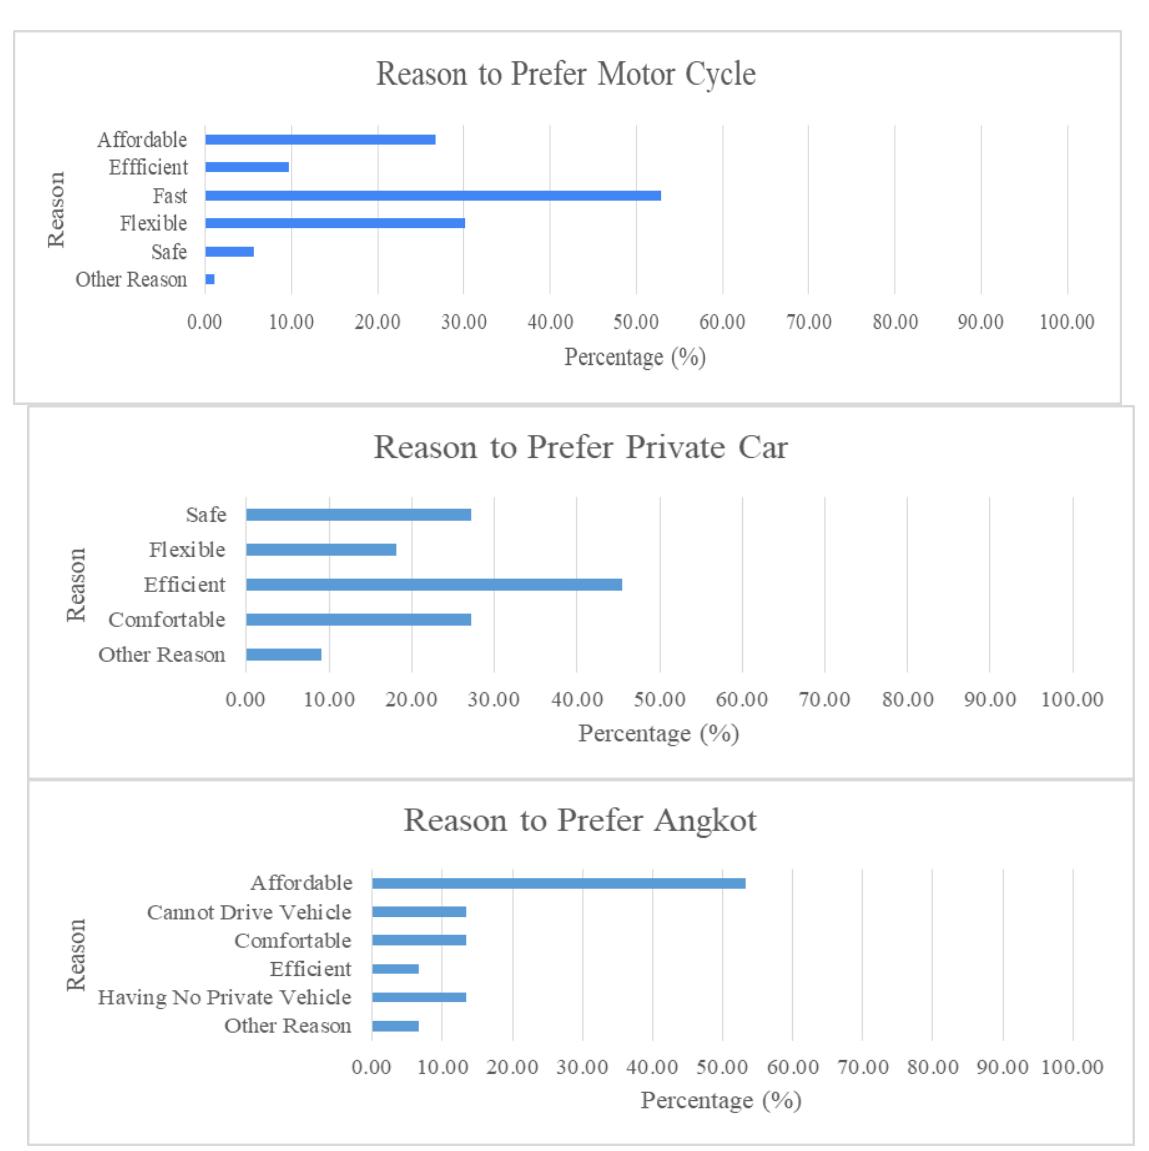
Figure 4. Reasons for selecting modes.
Many studies have proved that the consideration of transportation mode choice cannot be separated from the cost factor. Tu et al. (2016) identified there is a great impact of travel cost/fare for travelers in Beijing. The study by Kumar & Ganguly (2018) found that commuters in developed countries prefer safety and reliability, while commuters in developing countries
consider price/fare over other factors. To provide a clear image about the comparison of transportation expenses spent by workers in Bandung City, the costs that the respondents spent for their commutes were compared between those who use private vehicles and those who use public transportation. The comparison showed that the transportation cost for private vehicle users was almost double that for public transportation users. Based on the data obtained from the questionnaire survey, the average monthly transportation expenditure of the angkot and motorcycle users was IDR 186,333 and IDR 266,022 respectively. Thus, the current angkot tariff can provide cheaper transportation than private vehicles or motorcycles.
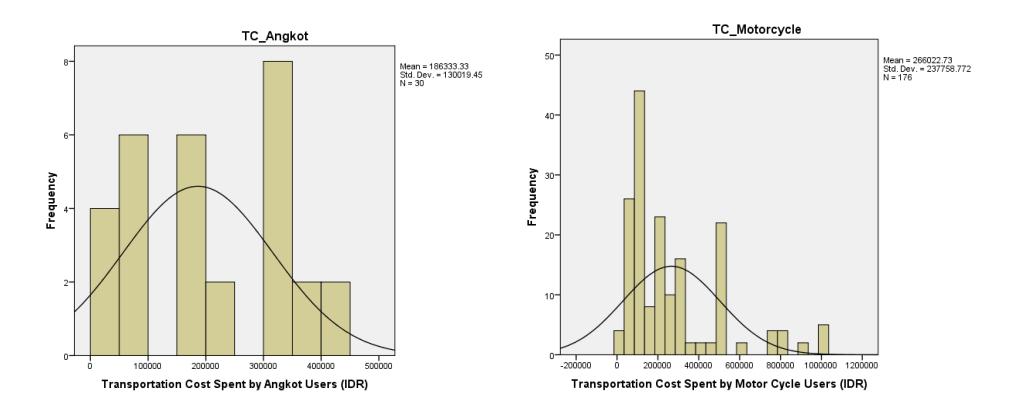
Figure 5. Comparison of transportation cost (per month) spent by angkot and motor cycle users (IDR).
To find a solution to increase public transportation use, especially for working people, it is also necessary to look at the current network connecting public transportation stops with both residential areas and workplaces. Public transportation service areas generally have an AWD (average walking distance). Wibowo et al., in 2015, determined AWD as 5 minutes to 10 minutes walking from the transportation terminal, or around 400 to 800 meters. In the current situation, the average distance between area of residence and angkot stop and between angkot stop and office were respectively 716 meters and 482 meters. This distance is still within 2 AWD, yet regardless of that the angkot is still not preferred.
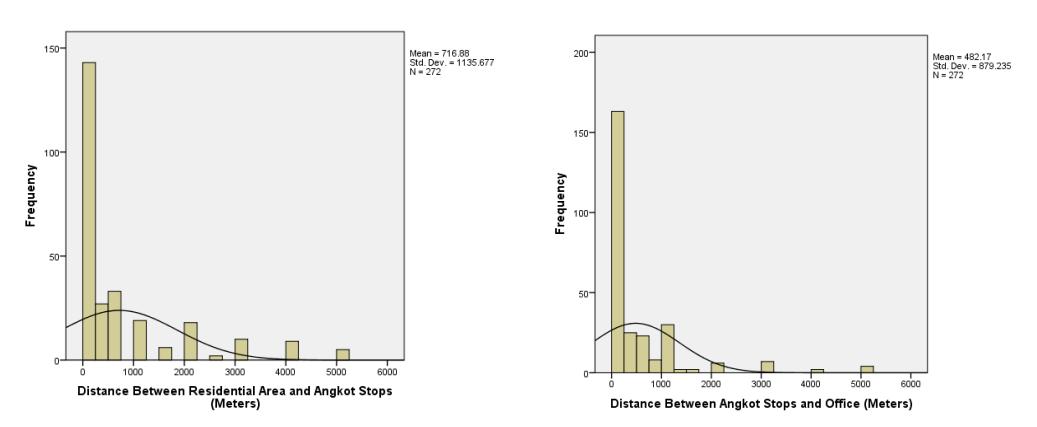
Figure 6. Distance from public transport stops to area of residence and work location.
Characteristics of the Worker's Trip
The third factor influencing mode preference is the characteristics of the trip (Ortuzar & Willumsen, 2011). This is related to people using a private car together with other family members or driving alone. This information is useful to determine the level of efficiency of the transport activity. Car sharing means higher vehicle occupancy, which means more efficient road space use. Driving a private vehicle alone means low occupancy and inefficient road space use. Of all respondents who use a private vehicle as their transport mode, only 23.12% use their vehicle together with one or more family members. This low percentage indicates the low efficiency of this transport activity.
Mode Shifting Probability to Angkot: Key Influencing Factors to Increase its Shift and its Significance
To identify the factors that most influence the probability of a transportation mode choice, logistic regression was applied. Since the aim of this modeling was to identify the probability of transportation mode choices, the respondents' preferences toward the type of transportation mode (angkot or other vehicles) were set as a dependent variable. Meanwhile, the other variables considered that will influence people's decision in choosing a transportation mode were set as independent variables. If the respondents use the angkot then it was given code 1, conversely if the respondents use other transportation modes it was given code 0.
In this case, 16 variables were selected as independent variables. This selection was based on the factors influencing mode choice from Ortuzar & Willumsen (2011) and based on individual quality attributes for an urban public transport system that become pull measures that encourage modal shift to use public transport (Batty et al., 2015). The 16 variables used in this modeling represent the characteristics of the trip maker, the characteristics of the trip, and the characteristics of the transport facility. These variables were: 1) private vehicle ownership (have/do not have), 2) driving license ownership (have/do not have), 3) marital status (married/single), 4) family members (have family members/no family members), 5) transportation cost, 6) location of work (Bandung City or surrounding cities and regencies), 7) distance between home and the nearest public transport stop (within average walking distance or not), 8) distance between the nearest public transportation stop to location of work (within average walking distance or not), 9) perception of angkot efficiency (high category, yes/no), 10) perception of angkot efficiency (medium category, yes/no), 11) perception of angkot tariff (affordable, yes/no), 12) perception of angkot tariff (medium category, yes/no), 13) perception of angkot comfort (high category, yes/no), 14) perception of angkot comfort (medium category, yes/no), 15) perception of angkot safety (high category, yes/no), and 16) perception of angkot safety (medium category, yes/no).
The Nagelkerke R square of this model is 0.688, which indicates that the independent variables used in this model are able to explain the variance and value of the dependent variable around 68.8%. Meanwhile, the rest is defined by other variables that are not captured by the model.
The omnibus test of the model coefficients indicated that the significance value of the model was 5.61E-17. Since this significance value was lower than α (0.05) it could be inferred that from the 16 independent variables used in this research there is at least one that influences the mode choice probability of working people in Bandung, which means that the resulted model was feasible and could be used for further analysis.
Similar to the overall test, the significance value was also assessed in the partial test. The difference is that in the partial test, the assessment was applied to the significance of every variable. The significance of every independent variable based on the logistic regression result is presented in the table below.
Table 1. Omnibus Tests, Independent Variables' Coefficient, and Partial Hypothesis Testing
| Omnibus Tests of Model Coefficients | |||||||
|---|---|---|---|---|---|---|---|
| Chi-square | df | Sig. | |||||
| Step 1 | Step | 114.736 | 16 | 5.61E-17 | |||
| Block | 114.736 | 16 | 5.61E-17 | ||||
| Model | 114.736 | 16 | 5.61E-17 | ||||
| Estimation of Independent Variables' Coefficient and Partial Hypothesis Testing | |||||||
| B | S.E. | Wald | df | Sig. | Exp(B) | ||
| Step | Income | .000 | .000 | 1.111 | 1 | .292 | 1.000 |
| a 1 | Marital_Status | -5.118 | 3.543 | 2.087 | 1 | .149 | .006 |
| Family_Member | 4.551 | 3.442 | 1.748 | 1 | .186 | 94.691 | |
| Vehicle_Ownership | -3.155 | .864 | 13.341 | 1 | .000 | .043 | |
| Driving_License_Ownership | -2.822 | .925 | 9.304 | 1 | .002 | .060 | |
| Distance_Res_angkot Stops | 3.673 | 3.459 | 1.127 | 1 | .288 | 39.365 | |
| Distance_angkot | 981 | 1.119 | .769 | 1 | .381 | .375 | |
| Stops_Office | |||||||
| Location of Work | 1.623 | 1.196 | 1.841 | 1 | .175 | 5.067 | |
| Safety_High | - | 9221.512 | .000 | 1 | .998 | .000 | |
| 22.620 | |||||||
| Safety_Mid | 669 | .787 | .722 | 1 | .395 | .512 | |
| Comfort_High | - | 17647.769 | .000 | 1 | .999 | .000 | |
| 14.899 | |||||||
| Comfort_Mid | 2.412 | 1.195 | 4.073 | 1 | .044 | 11.154 | |
| Efficiency_High | 36.187 | 19911.806 | .000 | 1 | .999 | 5196569527000000.000 | |
| Efficiency_Mid | .197 | .939 | .044 | 1 | .834 | 1.217 | |
| Cost_Affordable | 3.087 | 1.318 | 5.483 | 1 | .019 | 21.912 | |
| Cost_Mid | 3.054 | 1.019 | 8.980 | 1 | .003 | 21.198 | |
| Constant | -5.952 | 3.825 | 2.421 | 1 | .120 | .003 | |
The significance value in the sixth column indicates the significance of the influence of the independent variable toward the transportation mode choice. When the significance value is smaller than α (0.05) it means that the independent variable significantly influences the mode choice probability. Conversely, if the significance value is larger than α, then the independent variable does not significantly influence the mode choice probability. In short, all independent variables will influence the mode choice and the significance value generated from the regression process merely indicates how strong or how significant their influence on the mode choice probability is.
From the table above it can be seen that there were 4 independent variables with a significance value of less than 0.05. Those variables were: vehicle_ownership (significance value = 0.000260), driving license ownership (significance value = 0.002), perception of angkot comfort with medium category (significance value = 0.044), perception of angkot tariff in the affordable category (significance value = 0.019), and perception of angkot tariff in the medium category (significance value = 0.003). This result indicates that from 16 variables influencing mode choice from Ortuzar & Willumsen (2011) and Batty et al. (2015) that were tested in the modeling process, only 4 variables were correlated with the mode preference of working people in Bandung City.
This result provides important information on what action should be taken to increase or decrease the probability of working people choosing the angkot. Since interventions toward these variables will have a significant effect on public transportation preferences, this result may be used as the basis for transportation policymaking. The first variable with a significant influence is private vehicle ownership. In the logistic regression process, this variable was coded with the value 0 (= has no private vehicle) or 1 (= has private vehicle). From this table, it can be seen that the odds value for the variable of private vehicle ownership was 0.043, which means that those working people who have a private vehicle have 0.043 times smaller probability to use public transportation than those who do not have a private vehicle if the values of the other variables are the same or do not change. Similar to the process of determining private vehicle ownership, for driving license ownership, coded 0 (= has no driving license) or 1 (= has a driving license), the odds value for this variable was 0.060, which indicates that those who have a driving license have 0.060 times smaller probability to use public transportation than those who do not have a driving license if the values of the other variables are the same or do not change.
Another variable that significantly influences mode choice is the perception of angkot comfort, especially in the medium category. This category is a dummy variable since this perception was measured with an ordinal measurement scale. Based on the result of the logistic regression, the odds value obtained for this variable was 11.15. This odds value indicates that if the current angkot is improved, working people who perceive the level of comfort of the angkot to be in the medium category are 11 times more likely to use the angkot compared to those who perceive the angkot as uncomfortable. Similarly, if the current angkot condition can be improved so people perceive that it is affordable and medium/not too expensive, working people are 21 to 22 times more likely to use the angkot compared to those who perceive angkot tariff as expensive. Based on these findings, it can be concluded that to increase the probability of working people shifting their current mode to the angkot, improvements should take place, especially in the level of comfort and cost affordability, so it can exceed the comfort and affordability of other transportation modes.
By entering the average or mode value of every variable into the equation, the probability of angkot choice can be defined. Calculating it with a multinomial logit equation will allow us to identify the current probability of mode choice of angkot and other transportation modes. Based on the analysis, if the situation persists like in the current condition, the probability of working people using the angkot is only 0.001%, while the probability of working people using other transportation modes is 99.999%. If in the future, comfort is optimized and the tariff is more affordable, the probability of working people using the angkot will only increase to 3.31%. So, if we come back to the question of whether there is hope for the angkot in the future if other situations are assumed to be the same and only the level of comfort and tariff are intervened in, then it is certain that in the future the angkot will remain low-preference. From this result, it can be concluded that if the government wants to reduce private vehicles and move them to public vehicles, then the angkot must be transformed.
Conclusion and Recommendations
In line with the determinants of choice mode from Ortuzar & Willumsen (2011) and Batty et al. (2015), several variables tested in this research are tightly correlated with worker's mode choice. However, in the context of Bandung City, not all variables were significant; only 4 variables were correlated with the mode choice of working people, which comprises perception of medium angkot comfort, perception of the medium-to-affordable angkot cost, private vehicle ownership, and driving license ownership.
Based on the logistic regression model, it can be inferred that in the existing situation, the mode choice probability of working people to choose the angkot is only 0.001%. If in the future the government improves the comfort and decreases the tariff to make it more affordable, with the assumption that other conditions that are not identified in the model remain the same, then the probability of working people choosing the angkot will increase only to become 3.31%. This very low probability indicates that the expectation for the angkot to survive in the future is very low. If the Bandung Government wishes to shift working people from private vehicles to public transportation, it can be ascertained that the current angkot is not attractive to workers, and it should be transformed into another type of public transportation that has higher utility than a private vehicle.
Besides intervening in the comfort and tarrif of the angkot, the government actually still has the possibility to increase the probability of the angkot to be a choice of workers by intervening private vehicle ownership and driving licence ownership. The logistic regression model indicated that these two variables also have a tight correlation with workers' mode choice. However, since private vehicle and driving license ownership are rights of the people, what the government can do is tighten up the ownership regulation of vehicles and driving license, which can only be implemented when the angkot is transformed to become adequate and reliable.
This study tried to contribute to the study on the survival probability of the angkot in the future and the important variables that determine the mode choice of workers in Bandung City. In addition, the model was able to explain the potential of mode shifting from private vehicles to future public transportation, to give a more realistic picture of the characteristics of public transportation that should be provided in the future in comparison to the current condition of the angkot to increase mode switching. Apart from that, the mode choice probability provided in this study also indicates the precise probability of mode shifting from private vehicles to the angkot once the improvements are applied. Mode shifting depends on the willingness of the trip maker. This probability will probably change over time and will also probably remain dynamic, depending on the situation or condition of public transportation at the time of the study. However, this study provides a record of the situation of public transportation in Bandung City, which will be useful for further transportation studies.
This study represents the mode shifting probability of Bandung workers only, not all Bandung people in general. Since this group only represents 47.78% of the total population of Bandung City, there is still a possibility that the angkot is used by other groups of people, for example
students and non-working women. Therefore, for a future study it is recommended to consider a more comprehensive sample group by taking all categories of users in order to represent the mode choice of all population categories in Bandung City more accurately.
Acknowledgement
This paper is an update of the author's master thesis entitled Mode Shift Probability from Private to Public Transportation (Case Study: Bandung, Indonesia) at the University of Groningen. The Author wishes to express her gratitude to Dr. Tim Busscher from the University of Groningen for his valuable comments and suggestions in the development of the conceptual framework of this research. Author would also like to thank all the respondents involved in this research. This work was presented at PlanoCosmo5.