
Introduction
The construction of massive infrastructure provides an opportunity to increase the social cohesion between regions, thereby accelerating economic growth in the hinterlands to reach equitable growth (Swyngedouw et al. (2002), Vickerman (2007), and Lopez et al. (2008)). Banister and Lichfield (1995) state the importance of large-scale projects for developing regional potential to stimulate regions to rise from underdevelopment. This was confirmed by Alonso (1968), Cheshire
1Research Centre for Infrastructure and Regional Development and School of Architecture, Planning and Policy Development, Institut Teknologi Bandung, Indonesia, Email: wsalim@pl.itb.ac.id, and Malecki (2004), and Kessides (1993), who found that a lack of infrastructure is one of the problems of uneven development. The development of large-scale infrastructure will increase accessibility and mobility and facilitate widening of the region's market.
The implications of infrastructure development have been described in various studies, such as Verzosa and Gonzales (2010), Weber and Puissant (2003), Yang and Lo (2003) as well as Masek, Lindsay, and Goward (2000). These studies state that infrastructure development not only causes changes in regional structure but also leads to changes in land use around infrastructure development sites, both planned and unplanned. Land-use changes caused by infrastructure development will further increase the size of urban areas until they exceed administrative boundaries. The studies conducted by Moulaert, Salin, and Werquin (2001), and Dodson (2009) state that the implications of changes in land use due to infrastructure developement will stimulate the formation of metropolitan areas, regions with a large population concentration and an economic and social unity characterized by urban activities. Infrastructure development not only accelerates urbanization but also stimulates the growth of megaregions (Florida, Gulden, and Mellander, 2008).
West Java Province in Indonesia plays a strategic role in both the regional and the national context. In the regional context, West Java has 40 watersheds with a surface water discharge of 81 billion m3 and 150 million m3 of groundwater discharge per year (West Java Provincial Government, 2016). This contributes hugely to the provision of clean water, both to meet the internal needs of the region and those of surrounding areas, especially Jakarta. Fertile soil conditions make the area very suitable for growing crops, making West Java one of the primary food producers in Java. The region also provides the main route for the flow of goods and people between Sumatra and Java-Bali that connects production areas to markets in Java.
Meanwhile, in the national context, West Java contributes 13.22% to the national GDP, and the province contributes 27.28% to the GDP of the manufacturing sector at the national level (Badan Pusat Statistik, 2020). West Java is also the province with the largest population in Indonesia, amounting to 49.32 million people in 2019 (Badan Pusat Statistik, 2020). Another reason why the region has strategic economic importance is because it contains three National Activity Centers (Jabodetabek, Greater Bandung Urban Area, and Cirebon), seven National Strategic Areas, and is currently the center of the manufacturing industry in Indonesia (Indonesian Government, 2008).
The role of West Java in supporting Indonesia's economic growth is estimated to remain high. This is in line with the development of the Jabodetabek megapolitan area. This region is predicted to become the second-largest megapolitan area in the world. This megapolis will be integrated with the Bandung Basin and Cirebon Metropolitan areas. Besides, the development of West Java is predicted to continue rapidly in line with the growth of investment, both foreign and domestic, which continues to increase. Based on data from Badan Pusat Statistik (2020), in 2019, West Java was the province with the highest realization of foreign investment in Indonesia (5.88 billion USD) and the second-highest in domestic investment (49,284 trillion IDR). The rapid regional development in West Java, on the one hand, will stimulate rapid economic growth. On the other hand, it is a challenge to create ideal conditions such that the development opportunities of the economy and the region have a positive impact on West Java and Indonesia in general.
Large-scale infrastructure development in West Java was first initiated in 1991 when the Cikampek Toll Road was constructed to improve the connectivity between Jakarta and Bandung and boost economic growth in the city of Bandung. Furthermore, the Cipularang Toll Road was built in 2002 with a budget of around Rp 2.4 trillion and inaugurated in 2005. Ten years later, the Indonesian Government issued a list of National Strategic Projects, i.e., projects that are considered strategic and have a high urgency to be accelerated in their implementation (Salim and Negara, 2018). The list of projects was ratified in Presidential Regulation No. 3 of 2016, which was subsequently replaced by Presidential Regulation No. 58 of 2017, on Amendment of Presidential Regulation No. 3 of 2016 on Acceleration of the Implementation of National Strategic Projects. National Strategic Projects in West Java include a large-scale infrastructure project that connects not only the province internally but also connects it with Jakarta. This project is the controversial high-speed railway (HSR) megaproject, stretching 142.3 km from Jakarta to Bandung, which is estimated to cost USD 5.5 billion (Salim and Negara, 2016). This megaproject will not only have a significant impact on accessibility and mobility but is also expected to drive economic development at the transport nodes, resulting in massive land-use changes around these nodes.
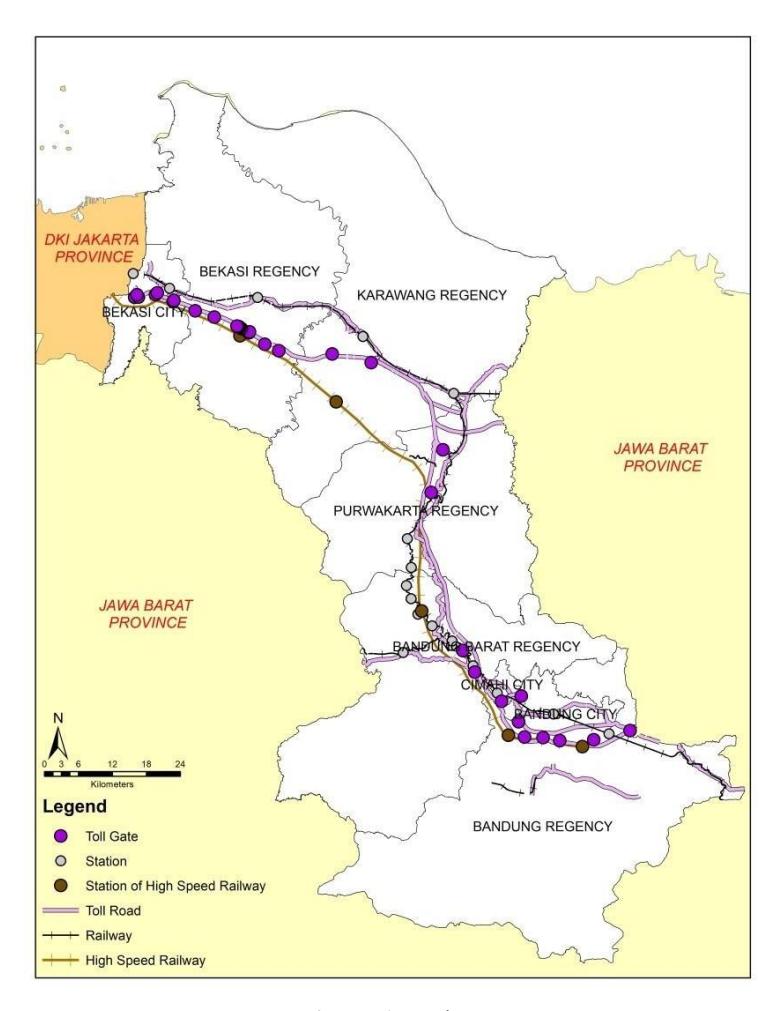
Figure 1 Study area.
West Java has drafted a Provincial Spatial Plan, which was enacted through Regional Regulation No. 22/2010 on Spatial Plan of West Java Province 2009-2029. This regulation guides policy directions, strategies, and planning structures, patterns, and strategic areas for West Java. Although the spatial plan has later been revised, it still does not cover infrastructure developments such as the Jakarta-Bandung HSR, so it is unlikely to represent future conditions accurately. This will cause the spatial plan to be insufficiently effective in encouraging areas that are directed to develop and will hamper growth in regions that already experience fast development. Therefore, this study aimed to identify the effect of toll road and HSR development on land-use changes in
West Java. Besides contributing to the literature of the process of mega urbanization (Florida, Gulden, and Mellander 2008), the results of this study can also serve as input for regional governments, especially the West Java provincial government, in anticipating the spatial impact of infrastructure development.
Land-use Change and Its Influencing Factors
Changes in land use and land cover are essential to study in the current era of globalization because of the impact of land conversion on humans. Studies conducted by Xiao et al. (2006), Kalnay and Cai (2003), and Lopez et al. (2001) found that changes in land use have a significant impact on global warming based on its interaction with climate, ecosystem processes, biogeochemical cycles, and biodiversity. Besides, land-use changes in built-up areas also affect human life, as described by Agarwal et al. (2002); Klein Goldewijk et al. (2011); and Meyer and Turner (1992). Changes in land use will alter patterns of human mobility from initially being concentrated in urban areas to spreading to cities' hinterlands. This will lead to an increased demand for better transportation, supporting infrastructure, and environmental quality. Consumption patterns will also change along with urban development. Changes that lead to urban expansion will lead to a decrease of farming area (Verburg and Bouma, 1999). Therefore, research related to land-use change is needed to anticipate externalities that may occur and serve as input for policy formulation and the development of better infrastructure.
In general, research on changes in land use/land cover can be divided into two perspectives: micro and macro (Agarwal et al. 2002; Bella and Irwin 2002; J. Liu et al. 2003; Verburg et al. 2004). The micro perspective emphasizes simulations based on the behavior and interaction between individuals in determining land-use changes in the region. In this case, individuals have a preference to convert the existing land use to the most beneficial land use. Thus, the analysis of land-use change from a micro perspective can help develop theories that link individual behavior with the collective behavior of a region. Nevertheless, micro analysis is not appropriate to apply to extensive areas, considering the number of individuals or groups of people that must be surveyed.
Meanwhile, the macro perspective emphasizes assessments based on the interaction between socio-economic and biophysical variables that stimulate changes in land use. Thus, the results cannot describe individual behavior encouraging land-use change. Nonetheless, the macro perspective can be used in areas with a broad scope because it only considers factors that have effects on the macro scale. The present research used the macro view to describe the phenomenon of land-use change resulting from large-scale infrastructure developments. The use of the macro level is based on the vast area of 769,337 hectares of West Java with highly complex problems and a tremendous impact of infrastructure developments on not only one but seven regencies/cities in West Java.
The factors that influence land-use change can be classified into two main groups of factors: nonspatial and spatial factors. Non-spatial elements were developed by von Thünen and relate to a land-use pattern that is described by the bid rent model, which states that the distance and accessibility of the market is the main factor that determines land use (Verburg et al. 2004). Other studies (Meyer and Turner 1992; Verburg and Bouma 1999) have added non-spatial factors, which relate to the elements of population growth and economic growth, which are often difficult to arrange spatially. Meanwhile, spatial factors describe the location of land-use change as a function of behavior or rules in simulation models (Seto and Fragkias 2005; Seto and Kaufmann 2003). Several studies, such as Verburg et al. (1999), have added that spatial factors are often associated with the element of spatial distance, which is one of the driving factors that most
influence changes in land use. In the context of this study, the drivers of land-use change are limited only to spatial factors, particularly concerning proximity:
1. Proximity to urban centers
Land-use change cannot be considered separate from proximity to urban centers. Deng et al. (2009) explain that cities have a great attraction for investors and migrants. Thus, proximity to metropolitan areas will stimulate land-use change to meet the settlement needs of migrants who work in the city center and the development needs of industries as well as trade and services related to the access provided by urban areas. This insight was reinforced by the study of Verburg (2000), which showed that proximity to metropolitan areas offers excellent opportunities to convert agricultural land (especially horticulture) in its surroundings.
2. Proximity to transport networks
Several studies have explained that changes in land use are affected by infrastructure development (J. Liu et al. 2003; Seto and Kaufmann 2003; Verburg et al. 2004). Infrastructure development, particularly transport infrastructure, will increase the accessibility and mobility of people to surrounding areas and facilitates reaching areas of resource production and marketing at commodity markets. This convenience will stimulate development around transport infrastructure networks, either in the development of settlements or trade and service facilities.
3. Proximity to existing land uses
Verburg (2000) explain that proximity to existing land uses, especially in built-up areas, is one of the main factors that drive land-use change. Besides easy access, proximity to existing land uses also causes an increase in regional specialization. For example, the development of industries tends to occur around existing industries because of easy access to the provision of industrial support facilities. Additionally, it increases the concentration of productive activities in a compact area.
4. Distance to disaster-prone areas
Shodi et al. (2004) and Yang et al. (2003) state that disaster-prone areas affect land-use changes. Ideally, the development of disaster-prone areas, especially high-risk ones, is restricted because it will lead to increasing vulnerability, not only in the areas themselves but also in their vicinity. However, in developing countries, high disaster-prone areas are still used for built-up land use, such as resorts and settlements. This study assumed that the closer the distance to disaster-prone areas, the lower the opportunity to change land use into built-up area.
Methodology
This study analyzed land-use changes due to transport infrastructure development using cellular automata. This method was selected because it can show relationships between the factors influencing land-use changes and changes in the land-use system. Furthermore, it can simulate the dynamics of urban development and can help understand the spatial-temporal changes in a development activity. Another reason is that this model is suitable to visualize the simulation results of land-use changes. Cellular automata (CA) is a method that can be used to describe the development of urban areas with complex systems. The results of simulations using the CA method can help understand past trends as well as trends in the development of land use. Thus, it can provide input for better land-use policies (stimulating/slowing down developments) and formulate future infrastructure development needs, and implications of developments in land use on the socio-economic conditions and the surrounding environment. The software used for the simulation was LanduseSim 2.3.1.
CA is a discrete dynamical system in which space is divided into regular spatial cells with a different processing time at each stage (White and Engelen 1993; Wolfram 1994). The changes are based on probability or determination rules that set changes in cells and neighboring cells. The conditions in the cells are updated according to the values in neighboring cells at different time periods. Some studies (Batty 2007; J. Liu et al. 2003; Y. Liu and Phinn 2003; Wolfram 1994) state that CA has five elements that must be present in every simulation of land-use change, i.e., the cells, conditions, neighborhood, transition rules, and time step.
In this study, these five elements are explained as follows:
- 1. The cell is the basic spatial unit of a cellular space ordered in spatial tessellation, which is a two-dimensional grid of cells that are used for modeling urban growth and land conversion. This study used a cell size of 100 x 100 m, or 1 ha. The study area was limited to the regencies/cities that are traversed by large-scale infrastructure (Cipularang Toll Road and the Jakarta-Bandung HSR), i.e., the Bekasi-Karawang-Purwakarta-Cimahi-Bandung corridor (Bekasi City, Bekasi Regency, Karawang Regency, Purwakarta Regency, Bandung Barat Regency, Bandung Regency, Cimahi City, and Bandung City). The number of cells used was equal to the area of the regencies/cities in hectares, i.e. 769,337 ha or 769,337 cells.
- 2. The state defines the attributes of a system that represents a type of land use. The simulation used 11 types of land use, i.e., Primary Forest (L1), Secondary Forest (L2), Plantation (L3), Fields (L4), Shrubs/Grass (L5), Paddy Fields (L6), River/Water Body/ Lake/Reservoir (L7), Fish Ponds (L8), Open Land (L9), Settlements (L10), and Industrial Zones (L11). The types of land use are used as benchmark for land-use change. The elasticity, i.e. the possibility of a certain land use being converted to another land use, is adjusted to changing land-use trends. However, in the explanation of the simulation results, only two types of land use are shown, i.e., Settlements (L10) and Industrial Zones (L11). For example, in 2000-2010, from 100 ha of plantation land 40 ha was changed into settlements, while from 200 ha of paddy fields, 20 ha was converted to settlements. Thus, the elasticity of plantation land and rice fields to settlements was 0.4 and 0.1, respectively. This shows that plantation land is easier converted to settlements by four times than rice fields, so that changes to residential land in the simulation prioritize plantation land over rice fields.
- 3. A neighborhood is defined as a series of mutually interacting cells. The calculation of neighborhoods is based on a 3 x 3 grid system. This means that the value of one cell is affected by the other eight cells. The operating mechanism of the neighborhood is mean operation, i.e., the average of the multiplication of the weight value.
- 4. The response of a cell's change in response to current changes and neighboring conditions is defined by a transitional rule. Several factors that influence land-use change are identified as transition rules, i.e., the distance to existing settlements (F1), to existing industrial zones (F2), to the provincial road network (F3), to the regency road network (F4), to the collector road network (F5), to other road networks (F6), to a toll gate (F7), to a train station (F8), to the nearest city (F9), to large disaster-prone areas (F10), and to a HSR station (F11). While existing trains stations are located in regencies/cities of the study area, the proposed HSR stations are located only in Bekasi Regency, Karawang Regency, West Bandung Regency, Bandung Regency, and Bandung City. In addition to factors used in the simulation, two scenarios were applied: (1) the development of the Cipularang Toll Road, and (2) the development of the Cipularang Toll Road and the Jakarta-Bandung HSR. The use of these factors is adjusted to the each scenario.
- 5. Time step. Time is a dimension used in the calculation process. The iteration period is twice for each scenario.
The scenarios used in this study are shown in Table 1.
| Scenario | Factor | Simulation 1 Period | Simulation 1 Result | Simulation 2 Period | Simulation 2 Result |
|---|---|---|---|---|---|
| Scenario 1 Cipularang Toll Road | F1, F2, F3, F4, F5, F6, F7, F8, F9, and F10 | 2005–2014 | Comparison between 2014 simulation result with actual condition of 2014 Impact of Cipularang Toll Road 10 years after operation started | 2014-2025 | Prediction of land use in 2025 as a result of Cipularang Toll Road construction Impact of Cipularang Toll Road after 20 years of operation |
| Scenario 2 Cipularang Toll Road and Jakarta- Bandung HSR | F1, F2, F3, F4, F5, F6, F7, F8, F9, F10, and F11 | 2014-2022 | Impact of Cipularang Toll Road 17 years after operation started | 2023-2025 |
|
Table 1 Scenario for the Simulation of Land-use Change due to Large-Scale Infrastructure Development
The Baseline: Development of Land-use 1994-2014
The available land-use maps (1994, 2005 and 2014) of the Bekasi-Karawang-Purwakarta-Cimahi-Bandung corridor show significant development of urban areas in this period of twenty years. In 1994, the percentage of settlements in the corridor was only 7.39%, which increased to 8.99% in 2005. Later, in the year 2014, residential areas more than doubled to 18.79% (see Figure 2). Nevertheless, the development of built-up area was not followed by the development of industrial zones, which only increased by 1.29% in 20 years, from 1.24% to 2.53% from 1994 to 2014. This indicates that the land-use developments in the Bekasi-Karawang-Purwakarta-Cimahi-Bandung corridor were the result of a shift in the development of settlements away from urban areas (Jakarta and Bandung) to their hinterlands. However, the developments were not able to stimulate the expansion of industrial activities from the city centers. Firman (2009) notes that in this period, the rapid development of settlements was caused by the construction of housing for the uppermiddle class (which is often followed by the construction of new towns) to meet the housing needs of people who work in city centers (Jakarta and Bandung). Besides, people want an exclusive neighborhood with a high level of security, considering the densely populated residential areas in city centers.
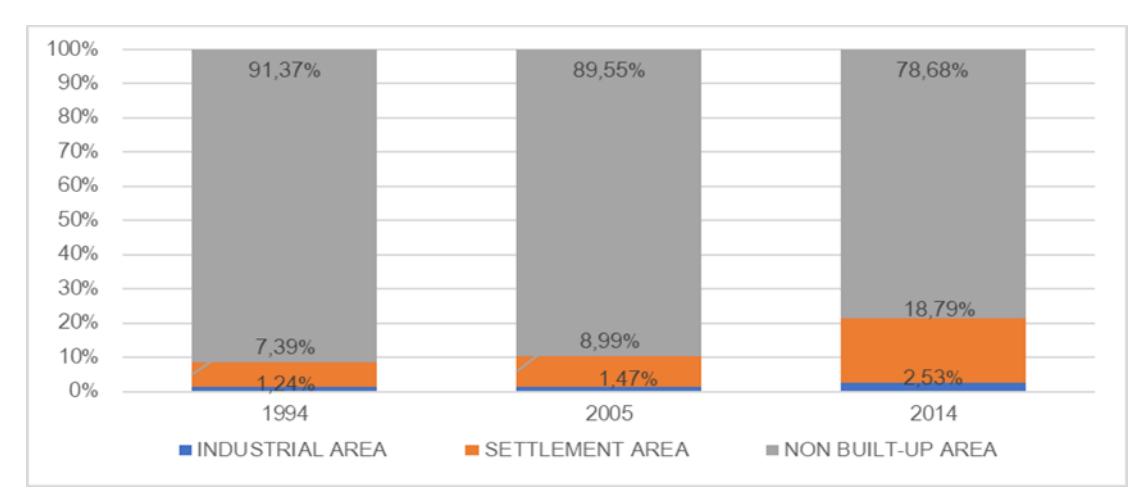
Figure 2 Land-use percentages in the Bekasi-Karawang-Purwakarta-Cimahi-Bandung corridor Source: Data processing from Bappeda West Java Province, 2017
The largest settlement areas in 1994 were located in Bekasi and Bandung with areas of 131.05 km2 and 120.03 km2 , respectively. In the following years, development of settlement areas occurred in the outskirts of the city. The highest growth occurred in Bandung Barat Regency and Karawang Regency, with 90.64% and 53.82%, respectively. The development of settlement areas in the hinterlands accelerated in the following years, in line with the opening of the Cipularang Toll Road, connecting Jakarta and Bandung. The growth in the corridor traversed by the toll road was almost 300%. Bekasi Regency experienced a very rapid increase in settlement areas, from 82.68 km2 to 313.65 km2 , i.e. almost tripling. This rapid growth also occurred in Bandung Barat Regency and Purwakarta, with growth rates of more than 200%. In 2014, the average percentage of settlements in the area of regencies/cities reached 36.08%.
The concentration of industrial zones only occured in areas around cities, except in the regencies of Bekasi and Karawang, with an area of 29.95 km2 and 36.58 km2 , respectively. Meanwhile, in the Greater Bandung area, industries were concentrated in Bandung Regency, with an area of 9.39 km2 . Afterwards, from 1994 to 2005, the growth of industrial zones accounted for only 19%, with the most considerable increase in Bandung City and Purwakarta Regency (over 190%). The rapid growth of industries was marked by a rise in the extent of industrial zones of 81.03 km2 (72%). The highest growth rate was in the regencies of Karawang and West Bandung, which experienced the greatest impact from the construction of the Cipularang Toll Road (see Table 2).
Table 2 Land-use Growth in the Study Areas 1994-2014
| Regency/ | Area (km2 ) | Land-use Proportion (%) | ||||||
|---|---|---|---|---|---|---|---|---|
| No | City | Land-use | 1994 | 2005 | 2014 | 1994 | 2005 | 2014 |
| 1 | Industrial Area | 4.76 | 3.75 | 8.63 | 2.19 | 1.73 | 3.97 | |
| Bekasi City | Settlement Area | 131.05 | 131.12 | 161.55 | 60.32 | 60.35 | 74.36 | |
| Non Built-Up Area | 81.45 | 82.39 | 47.08 | 37.49 | 37.92 | 21.67 | ||
| 2 | Industrial Area | 29.95 | 31.24 | 42.99 | 2.36 | 2.46 | 3.39 | |
| Bekasi | Settlement Area | 61.15 | 82.43 | 313.65 | 4.82 | 6.50 | 24.75 | |
| Regency | Non Built-Up Area | 1,176.27 | 1,153.70 | 910.73 | 92.81 | 91.03 | 71.86 | |
| 3 | Industrial Area | 36.58 | 39.21 | 82.98 | 1.91 | 2.05 | 4.33 | |
| Karawang | Settlement Area | 69.15 | 106.36 | 279.12 | 3.61 | 5.55 | 14.57 | |
| Regency | Non Built-Up Area | 1,809.59 | 1,769.75 | 1,553.22 | 94.48 | 92.40 | 81.09 | |
| Industrial Area | 3.09 | 9.13 | 10.48 | 0.31 | 0.92 | 1.05 | ||
| 4 | Purwakarta | Settlement Area | 28.06 | 40.91 | 134.64 | 2.82 | 4.11 | 13.52 |
| Regency | Non Built-Up Area | 964.64 | 945.75 | 850.66 | 96.87 | 94.97 | 85.43 | |
| Bandung | Industrial Area | 4.30 | 2.94 | 6.62 | 0.33 | 0.23 | 0.51 | |
| 5 | Barat | Settlement Area | 25.90 | 49.37 | 187.46 | 1.99 | 3.79 | 14.39 |
| Regency | Non Built-Up Area | 1,272.22 | 1,250.11 | 1,108.34 | 97.68 | 95.98 | 85.10 | |
| Industrial Area | 9.39 | 10.13 | 17.58 | 0.54 | 0.58 | 1.00 | ||
| 6 | Bandung Regency | Settlement Area | 106.93 | 134.08 | 218.19 | 6.10 | 7.65 | 12.44 |
| Non Built-Up Area | 1,637.51 | 1,609.61 | 1,518.05 | 93.37 | 91.78 | 86.56 | ||
| Cimahi City | Industrial Area | 3.62 | 3.62 | 4.60 | 8.88 | 8.88 | 11.30 | |
| 7 | Settlement Area | 24.05 | 23.91 | 25.99 | 59.00 | 58.64 | 63.76 | |
| Non Built-Up Area | 13.09 | 13.24 | 10.17 | 32.11 | 32.47 | 24.95 | ||
| 8 | Bandung City | Industrial Area | 3.17 | 12.56 | 19.73 | 1.88 | 7.46 | 11.72 |
| Settlement Area | 120.03 | 120.18 | 119.20 | 71.32 | 71.41 | 70.83 | ||
| Non Built-Up Area | 45.10 | 35.56 | 29.37 | 26.80 | 21.13 | 17.45 | ||
| Industrial Area | 94.86 | 112.58 | 193.61 | 1.24 | 1.47 | 2.53 | ||
| Total | Settlement Area | 566.31 | 688.36 | 1,439.80 | 7.39 | 8.99 | 18.79 | |
| Non Built-Up Area | 6,999.88 | 6,860.11 | 6,027.63 | 91.37 | 89.55 | 78.68 | ||
Source: Data processing of Bappeda West Java Province, 2017
In terms of the distribution of space in the Bekasi-Karawang-Purwakarta-Cimahi-Bandung corridor, in 1994, built-up land was concentrated in urban areas, i.e., Bekasi City, which is directly
adjacent to Jakarta, and Bandung City and Cimahi City, the core of the Greater Bandung Metropolitan Area. Other areas were still dominated by non-built-up areas in the form of paddy fields, plantations as well as fields with a sprawling pattern that followed the road network. The development of industries, besides being concentrated in Bekasi Regency, was also scattered randomly in Karawang Regency. Meanwhile in 2005, there was no significant development of built-up areas, where these were still concentrated in the hinterland of the cities. Additionally, growth also occurred along the main road network that connects the regencies in the corridor. Industries that multiplied in the south of Bandung City, Purwakarta Regency and Karawang Regency, were randomly distributed.
The increase in built-up area occurred very rapidly until the year 2014 due to the opening of the Cipularang Toll Road in 2005 (see Figure 3). The toll road stimulated the flow of mobility of people in Jakarta and its surroundings, especially the upper-middle class, to travel to Bandung over the weekend, prompting an increase in trade and services, such as hotels, restaurants, and so forth. Tamin (2005) adds that the toll road stimulated rapid industrial growth, especially around the transport nodes, given the ease of accessing markets and raw materials for production. This is supported by the explanation of Firman (1997) that land use around Jakarta is dominated by lowintensity activities that are not compact, thereby stimulating changes in agricultural land around the metropolitan area into industry and service activities.
The rapid growth in built-up area relates to the economic dominance of Jakarta within Indonesia's economy, thereby providing a multiplier effect in surrounding areas in the form of the provision of settlements and industries that stimulate economic growth in these areas. In the regencies located between Bekasi and Bandung, the development of built-up area happened very rapidly as a result of the increased accessibility of the region. Land prices were still low, which also stimulated the growth of settlement and industrial areas in the region. Meanwhile, in Bandung, the expansion of built-up area was not as intensive as in Bekasi. It mainly followed the development of the road network in the region.
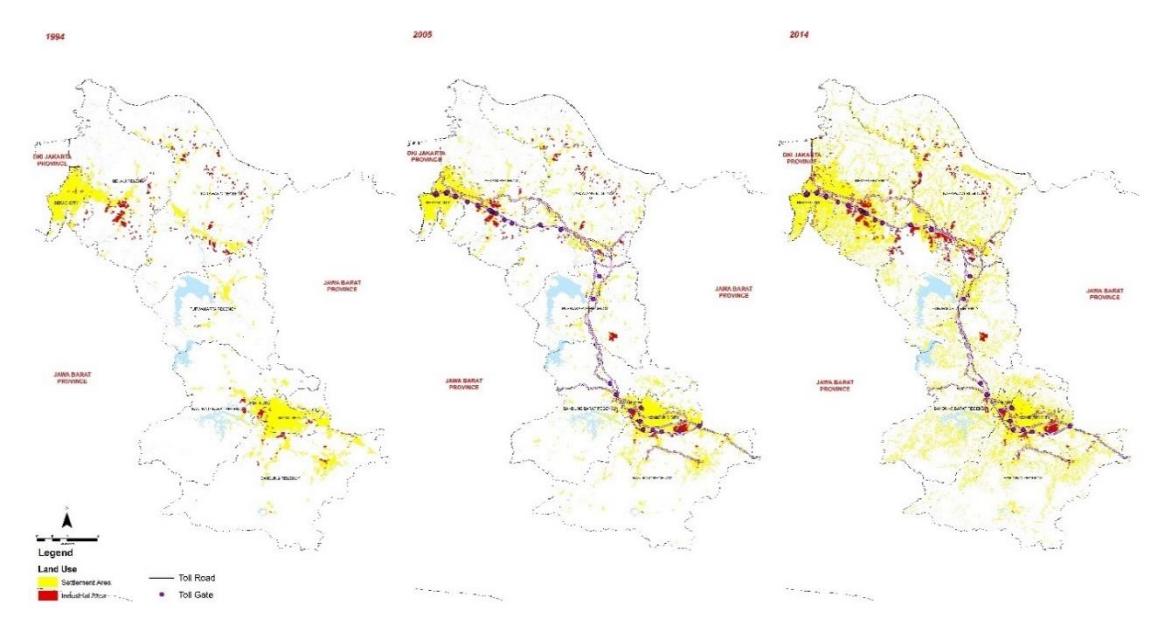
Figure 3 The development of built-up land cover in the study area in 1994, 2005, and 2014. Source: Authors
In general, the development of built-up area in the Bekasi-Karawang-Purwakarta-Cimahi-Bandung corridor reflects the growth of a mega-urban region characterized by the mixing of built-up and non-builtup areas, leading to blurred boundaries between urban and rural areas. The growth of this mega-urban region was driven by large-scale settlement development, the construction of new towns, the development of industrial zones, and the construction of the toll road network. Rimmer (1992) in Firman and Dharmapatni (1994, 1995) calls the characteristics of rapid development a form of integration between metropolitan areas, in this context, the Jabodetabek Metropolitan Area and the Greater Bandung Metropolitan Area. On the one hand, integration among the metropolitan areas will stimulate high agglomeration economies, offering chances of even higher economic development. On the other hand, it has an impact on land-use changes that result in a decrease in resilience and food security as well as environmental damage.
Analysis: Simulation of Land-use Change
In the first analysis we sought to compare existing land use in 2014 with simulation results for the same year to find out the level of validity of the model. In general, the increase of actual builtup area was more significant than in the simulation. However, in total, the level of conformity between the simulation and the actual data for housing and industrial areas was 98.09% and 102.64%, respectively, i.e., entirely accurate with less than 5% error. Thus, the model used in this study can correctly represent changes in existing conditions. In a spatial context, both the existing conditions and the simulation results for 2014 suggest an increase in built-up area concentrated around the urban core. In the Jabodetabek Metropolitan Area, growth is focused on the area immediately adjacent to Jakarta. In contrast, in the Greater Bandung Metropolitan Area, growth is concentrated in Bandung City and in the areas immediately adjacent to Bandung City. This strengthens the argument of Deng et al. (2009) and Verburg (2000) that proximity to a city is positively correlated with an increase in built-up area.
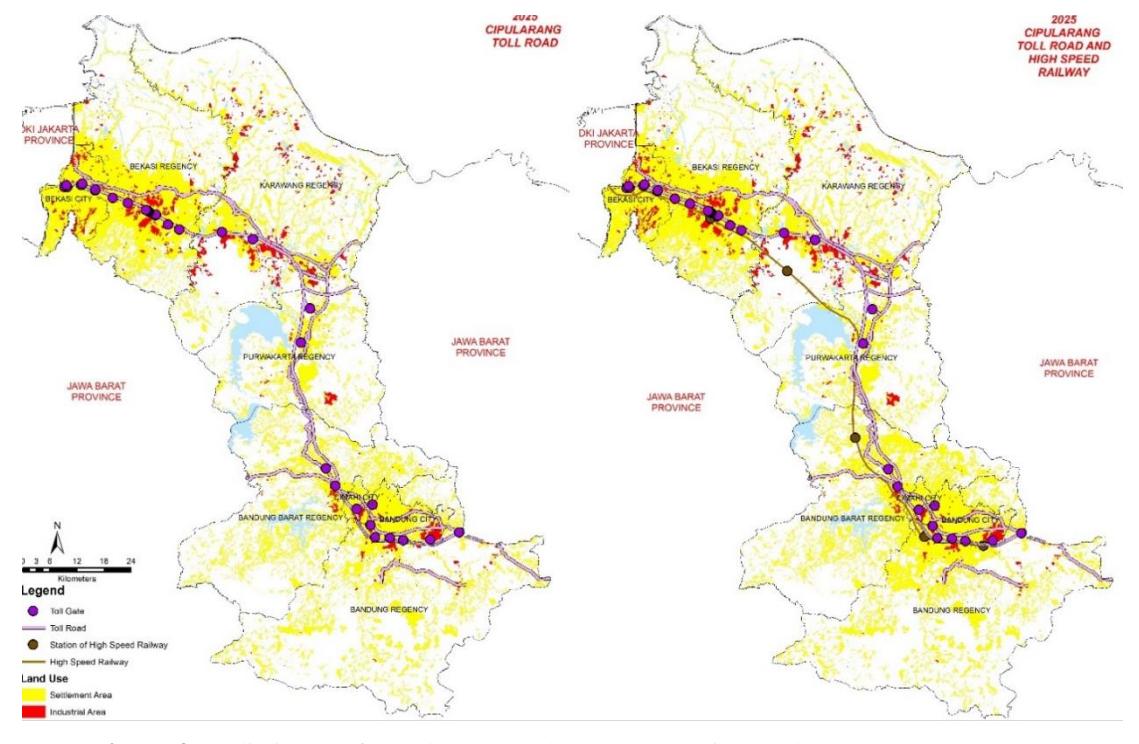
Figure 4 Predictions of land cover developments in study areas, 2025. Source: Authors' simulation
In addition, the increase in built-up area also tends to concentrate around main roads, which have better accessibility than areas far from the main road network. In regions traversed by the toll road network, the development of built-up areas is concentrated around tollgates. This applies not only to the expansion of settlements but also to industrial zones. From 2005 to 2014 (after the Cipularang Toll Road opened), many settlement areas for the upper-middle class were constructed, both horizontal and vertical housing. This development trend is predicted to continue to increase in line with the plans for increasing road capacity (including toll roads), which will facilitate the mobility of goods and passengers in the corridor. Besides the development of infrastructure, the region also stimulates easy access to a broader market, especially in Jakarta.
The following result presents the simulation of land use in 2025 using two scenarios, i.e., (1) Cipularang Toll Road (Figure 4, left) and (2) Cipularang Toll Road plus Jakarta-Bandung HSR (Figure 4, right). In the first scenario, land use for industrial zones increases by 6.06% to 205.34 km2, while land use for settlements increase by 36.10% from 519.71 km2 to 1959.52 km2. However, the simulation shows a decrease in industrial zones in some areas, i.e., in Bandung Regency, Bandung Barat Regency, Karawang Regency, and Purwakarta Regency. This decrease could be caused by the saturation of industry in these areas as well as inadequate access. Hence, industry moves to areas with adequate accessibility and closer to tollgates. As in Bekasi Regency and Bekasi City, industrial development is concentrated around tollgates. This is reinforced by the plan to open eight new industrial zones in the sub-districts Tarumajaya and Babelan of Bekasi Regency in strategic locations, not only because of their proximity to the toll road but also to a port (Okezone 2017).
Land use in the form of settlement area experiences an increase of 5 to 66% in all regencies/cities in the Bekasi-Karawang-Purwakarta-Cimahi-Bandung corridor. The highest growth in settlement area occurs around the Greater Bandung Metropolitan Area, in Bandung Barat Regency, Bandung Regency, and Cimahi City. This could be caused by the rapid development of economic activities in Bandung, which is not followed by the availability of sufficient land for settlement development. Meanwhile, the high land prices result in a tendency for people to move to the outskirts of Bandung. This area still has enough land at relatively low prices with quite good accessibility to Bandung City. This is supported by the development of housing by developers, both for the lower middle class and the upper-middle class, which rapidly grow in the outskirts of Bandung City. Increased ease of access as a result of the construction of the toll road is also expected to occur in Bekasi Regency through the rise of settlement area by 49.12% (154.06 km2) of settlement area in 2014. Like what happens in Bandung Regency, Bandung Barat Regency, and Cimahi City, Bekasi Regency as hinterland of Jakarta also receives an abundance of urban workers who commute daily. Apart from that, the rapid growth of settlement area in Bekasi is also due to the rapid industrial development in the region.
Meanwhile, the second scenario assumes that the HSR has been completed and is operational in 2022. Thus, this scenario illustrates the impact of 20 years after the Cipularang Toll Road opened and three years after the Jakarta-Bandung HSR has been completed. Scenario 2 shows an increase in industrial zones of 5.65 km2 and an increase in settlement area of 149.50 km2 compared to Scenario 1 (see Table 3). This indicates that the HSR has a significant impact on increasing builtup area in the Bekasi-Karawang-Purwakarta-Cimahi-Bandung corridor. However, the impacts are not seen in the entire region, but are only apparent in Bandung Regency, Bandung Barat Regency, Bandung City, and Cimahi City, with an increase in built-up area of 175.68 km2. This suggests that the shorter the travel time between Jakarta and Bandung (estimated to only take one hour by HSR), the commuter flow, which was initially only around the city of Jakarta, will extend to the Greater Bandung Metropolitan Area. It is expected that a significant move of people will occur in the areas around the HSR stations, especially at stations located in urban areas. This will result in a considerable increase in property values in these areas.
Table 3 Existing Land-use and Simulation Results (Scenario 1 Toll Road and Scenario 2 Toll Road with HSR) in the Study Areas of 2025
| Regency/ City | Area (km2 | ) | Land-use Proportion (%) | ||||
|---|---|---|---|---|---|---|---|
| No | Land-use | Scenario 1 | Scenario 2 | Scenario 1 | Scenario 2 | ||
| 1 | Industrial Area | 17.87 | 22.55 | 8.23 | 10.38 | ||
| Bekasi City | Settlement Area | 187.47 | 179.62 | 86.29 | 82.67 | ||
| Non Built-Up Area | 11.92 | 15.10 | 5.48 | 6.95 | |||
| Industrial Area | 45.96 | 46.83 | 3.63 | 3.69 | |||
| 2 | Bekasi Regency | Settlement Area | 467.71 | 456.08 | 36.90 | 35.99 | |
| Non Built-Up Area | 753.70 | 764.46 | 59.47 | 60.32 | |||
| 3 | Karawang Regency | Industrial Area | 82.71 | 82.70 | 4.32 | 4.32 | |
| Settlement Area | 309.46 | 303.12 | 16.16 | 15.83 | |||
| Non Built-Up Area | 1,523.15 | 1,529.50 | 79.52 | 79.86 | |||
| 4 | Purwakarta Regency | Industrial Area | 10.48 | 10.46 | 1.05 | 1.05 | |
| Settlement Area | 182.40 | 182.19 | 18.32 | 18.30 | |||
| Non Built-Up Area | 802.91 | 803.14 | 80.63 | 80.65 | |||
| Industrial Area | 6.50 | 6.50 | 0.50 | 0.50 | |||
| 5 | Bandung Barat | Settlement Area | 312.16 | 385.09 | 23.97 | 29.57 | |
| Regency | Non Built-Up Area | 983.76 | 910.83 | 75.53 | 69.93 | ||
| 6 | Bandung Regency | Industrial Area | 17.34 | 17.40 | 0.99 | 0.99 | |
| Settlement Area | 342.90 | 435.14 | 19.55 | 24.81 | |||
| Non Built-Up Area | 1,393.59 | 1,301.29 | 79.46 | 74.20 | |||
| 7 | Cimahi City | Industrial Area | 4.65 | 4.69 | 11.41 | 11.51 | |
| Settlement Area | 31.84 | 32.66 | 78.11 | 80.11 | |||
| Non Built-Up Area | 4.27 | 3.42 | 10.49 | 8.39 | |||
| 8 | Bandung City | Industrial Area | 19.84 | 19.87 | 11.79 | 11.81 | |
| Settlement Area | 125.57 | 135.12 | 74.61 | 80.29 | |||
| Non Built-Up Area | 22.89 | 13.30 | 13.60 | 7.91 | |||
| Total | Industrial Area | 205.34 | 210.99 | 2.68 | 2.75 | ||
| Settlement Area | 1,959.52 | 2,109.02 | 25.58 | 27.53 | |||
| Non Built-Up Area | 5,496.19 | 5,341.04 | 71.74 | 69.72 | |||
Source: Authors' simulation
In terms of spatial distribution, the first scenario shows an enormous increase in built-up area in Bekasi City and Bekasi Regency. The growth pattern of industrial zones tends to approach the market and growth center (Jakarta) with its adequate regional accessibility (traversed by the main road network or close to a toll gate, mainly). Similarly, the settlement development prioritizes accessibility and proximity to urban areas. The construction of the toll road network has helped stimulate equitable growth in the Jakarta-Bandung corridor, especially in the regencies of Karawang and Purwakarta. Before the Cipularang Toll Road was inaugurated, the built-up area in these two regencies amounted to 7.60% and 3.13% in 2005. Then, ten years after the toll road opened, the amount of built-up area rose to 18.91% and 14.58%, respectively. Twenty years after the toll road opened, the amount of built-up area increased to 20% of the total area. This development shows that, in addition to increasing access, the development of the toll road network also opened economic opportunities for these areas. Previously, these regencies were considered less favorable for developing industries due to limited access. Since the opening of the Cipularang Toll Road, industrial zones have increased by more than 50% and stimulated the development of settlements around these industrial zones.
The second scenario shows an increase in built-up area, particularly of settlements located near the HSR stations in urban areas. In Bekasi Regency, an increase of approximately 5% in built-up
area occurs around the stations. Rapid growth occurs at locations around the HSR stations in Walini (Bandung Barat Regency), South Bandung (Bandung Regency), and Gedebage Station (Bandung City). These locations are currently planned and developed as new urban areas. Therefore, the development of the HSR will support the development of new urban areas around the stations. On the other hand, the impact of the development of the HSR will only be evident if its growth is integrated with the development of road networks in the surrounding areas. For example, around the HSR station in Karawang Regency, the impact on the development of nonbuilt-up area due to the location of the HSR station is still small. It is relatively far from urban areas, with a limited road network. Nonetheless, in the long term, the area around the HSR station in Karawang Regency is expected to develop along with an increase in urban activity caused by the HSR station.
Another finding is that the impact of the development of the HSR cannot be viewed partially or by only relying on the train station as the main driving factor of the growth of urban activities. In areas with urban characteristics that are supported by other infrastructure such as roads and utility facilities, the HSR will hugely accelerate urban development in Bekasi Regency, Bandung Barat Regency, Bandung Regency, and Bandung City. However, if these developments are not integrated with other infrastructure development, the impact will only be small. An example is the area around the HSR station in Karawang Regency, which is located quite far from the urban center of Karawang Regency. The simulation shows a small impact of the HSR stations on the growth of new urban centers. Still, if it is not carried out in synergy with other drivers of infrastructure development, the development will be slow and often problematic in the provision of supporting infrastructure for settlement areas.
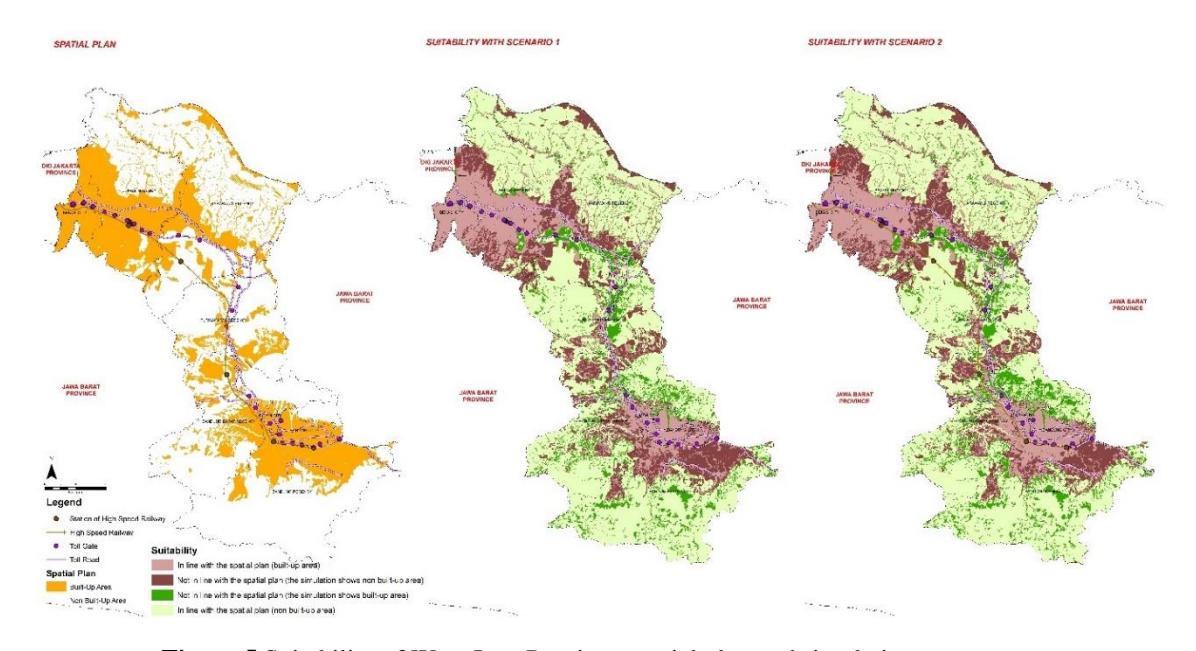
Figure 5 Suitability of West Java Province spatial plan and simulation. Source: Authors' simulation
In general, the development of land cover in the Bekasi-Karawang-Purwakarta-Cimahi-Bandung corridor tends to follow a ribbon development pattern following the transportation network. Large-scale infrastructure developments are not only concentrated around transport nodes (tollgates and HSR stations) but also develop the road network near transport nodes, thereby forming a large urban area. In the long run, this will lead to the formation of a mega-urban region in the Jakarta-Bandung corridor. Meanwhile, in regions that are not traversed by transport
infrastructure and its nodes, the development is not much different, following the patterns of the current transport networks. What distinguishes it is that urban development here tends to sprawl out and not concentrate in one particular growth center. This in contrast with areas traversed by large-scale infrastructure and its nodes, which leads to the formation of new growth centers.
The simulation results in the previous section were verified with the West Java Province Spatial Plan (in the Bekasi-Karawang-Purwakarta-Cimahi-Bandung area) in order to analyze what differences exist between the planned built-up areas and the simulated urban areas in the year 2025. In general, the West Java Province Spatial Plan accommodates the development of builtup areas around the cities, indicated by planned built-up areas around the metropolitan centers. This is demonstrated by the conformity between the planned built-up areas and the simulation of around 64% for both scenarios (See Figure 5). However, the Spatial Plan does not consider the impact of increasing built-up area due to megaproject infrastructure development. When the Spatial Plan was passed in 2009, there was no discussion on the construction of the Jakarta-Bandung HSR, as it was not planned yet by the Ministry of Transportation (Salim and Negara, 2016). This condition conforms with the results of Scenario 2 in the simulation, which shows that areas around train stations, especially stations that are quite far from a metropolitan center, such as in Walini, are planned as non built-up areas.
Table 4 Suitability of West Java Province Spatial Plan and Simulation
| Suitability with Sc. 1 | Suitability with Sc. 2 | |||||||
|---|---|---|---|---|---|---|---|---|
| No | Regency/ City | Land-use | Spatial | (km2 ) | (km2 ) | |||
| Plan (km2 ) | Built-Up | Non Built | Built-Up | Non Built | ||||
| Area | Up Area | Area | Up Area | |||||
| 1 | Bekasi City | Built-Up Area | 215.87 | 204.24 | 11.63 | 201.10 | 14.77 | |
| Non Built-Up Area | 1.39 | 1.11 | 0.29 | 1.07 | 0.32 | |||
| Built-Up Area | 724.68 | 470.13 | 254.55 | 462.35 | 262.33 | |||
| 2 | Bekasi Regency | Non Built-Up Area | 542.69 | 43.53 | 499.15 | 40.55 | 502.13 | |
| Built-Up Area | 525.65 | 212.83 | 313.05 | 208.23 | 317.42 | |||
| 3 | Karawang Regency | Non Built-Up Area | 1,389.67 | 179.34 | 1,210.10 | 177.58 | 1,212.09 | |
| Built-Up Area | 202.62 | 58.72 | 143.92 | 59.22 | 143.40 | |||
| 4 | Purwakarta Regency | Non Built-Up Area | 793.16 | 134.16 | 658.99 | 133.42 | 659.74 | |
| Built-Up Area | 337.14 | 124.72 | 212.43 | 153.67 | 183.48 | |||
| 5 | Bandung Barat Regency | Non Built-Up Area | 965.27 | 193.94 | 771.34 | 237.92 | 727.35 | |
| Built-Up Area | 478.95 | 156.44 | 322.46 | 219.48 | 259.48 | |||
| 6 | Bandung Regency | Non Built-Up Area | 1,274.87 | 203.80 | 1,071.13 | 233.06 | 1,041.81 | |
| Built-Up Area | 38.13 | 34.93 | 3.17 | 35.56 | 2.57 | |||
| 7 | Cimahi City | Non Built-Up Area | 2.64 | 1.56 | 1.10 | 1.79 | 0.85 | |
| Bandung City | Built-Up Area | 156.10 | 136.98 | 19.12 | 145.91 | 10.18 | ||
| 8 | Non Built-Up Area | 12.20 | 8.43 | 3.77 | 9.08 | 3.12 | ||
| Built-Up Area | 2,679.14 | 1,399.00 | 1,280.32 | 1,485.52 | 1,193.62 | |||
| Total | Non Built-Up Area | 4,981.90 | 765.86 | 4,215.87 | 834.48 | 4,147.42 | ||
| Percentage of Suitability (%) | 64.62 | 76.71 | 64.03 | 77.65 | ||||
Source: Authors' own simulation
This raises the concern that West Java Province will not be able to maintain two-thirds of its area as non built-up areas as stipulated in the Provincial Spatial Plan. The Spatial Plan allocates 4,981.90 km2 (65%) of West Java's total area as non built-up areas. Meanwhile, the land-use map analysis shows a trend of decreasing non built-up area from 91.37% in 1994 to 78.68% in 2014, or about 12.70% in twenty years. On the other hand, both simulations showed that the increase in built-up area encroaching into non built-up area in the future due to both infrastructure developments is massive, i.e., 765.86 km2 in Scenario 1 and 834.48 km2 in Scenario 2 (see Table 4). This encroachment may occur on land that is not suitable for urban development, either for residential or industrial areas. There is also a plan for a center of new growth in Walini that will attract a large amount of development for both settlement and trade and services areas. With the addition of an HSR station in the area, the expansion of built-up areas into non built-up areas may turn out to be even greater. Therefore, the existence of unplanned built-up areas should be included in the revision of the provincial spatial plan, so that externalities, both positive and negative, can be well anticipated.
Conclusion
It can be concluded that transport infrastructure development, both of toll roads and high-speed railways, has a significant impact on the development of built-up areas around transport nodes. It leads to the creation of growth centers/new urban centers. Nevertheless, the extent of the development of built-up areas must not only be seen as a consequence of the development of infrastructure but also as a system that is interrelated with other infrastructure development (including small-scale infrastructure). The findings of this study show that the impact of infrastructure development is more evident in areas with relatively more adequate supporting infrastructure located around urban areas compared to areas with little supporting infrastructure. Thus, the factors of proximity to transport networks and urban centers as drivers of land-use change work together, which can take place anywhere, not only in Indonesia.
The rapid increase in built-up area in the Bekasi-Karawang-Purwakarta-Cimahi-Bandung corridor as a result of megaproject infrastructure development emphasizes the need to provide adequate infrastructure. Moreover, this increase in built-up area is expected to convert productive large amounts of agricultural land. This gives a considerable risk of reducing agrarian productivity and threatening food security, not only in the corridors but also in the whole of West Java. In this regard, the West Java Provincial Government should anticipate trade-offs and negate externalities caused by the rapid development of built-up area. Further study is needed to see the impact of land-use change on regional food security in order to identify these trade-offs. In the meantime, some policies that can be implemented are the development of an integrated infrastructure master plan for West Java as well as increased intensification of agricultural land. Another approach is to revise the West Java Provincial Spatial Plan to prepare a strategy for structuring land use of areas affected by the megaproject infrastructure development.
Acknowledgments
This research was funded by Institut Teknologi Bandung through Riset Unggulan scheme of the Research Centre for Infrastructure and Regional Development.