
Introduction
Demand- and supply-side factors of trip consumer capability show that urban public infrastructure with a high density has an effect on trip consumer behavior at the city scale (Bell and Greene, 1978), as shown in Figure 1. Most cities are now aware of the environmental harm scenario and are focusing on reducing private car use and encouraging people to use public transportation more. In this regard, several modes of public transportation (including trams, BRTs, and street buses) have been proven to be successful strategies (Tolley, 1997). However, public transportation accessibility in relation to the urban morphology clearly determines public transportation capability. In Japan, urban concentrations are supported by well-developed train networks that rapidly spread from central areas (Department of Urban Engineering, 1994). More accessible transportation modes can be proposed to address poorly planned and unbalanced route expansion. Specifically, passengers are affected in different ways according to where they expect bus stops to be (Akgol et al., 2020). Where demand density is low or roads cannot support relatively large fixed-route buses, a flexible-route bus system will inevitably be desired to serve people at their locations (Kima et al., 2019). The following factors have been identified as critical to the implementation of public transport networks: 1) timing; 2) network; 3) budget; 4) political championing; and 5) transportation emission reduction (Attard, 2012). This study utilized a multimodal transportation investigation, which included the modes walk (Roy and Basu, 2020), bus (conventional and reformed) (Birungi, 2017; Kim and Dickey, 2006), and train. The findings are presented as an accessibility index focused on the feeder function.
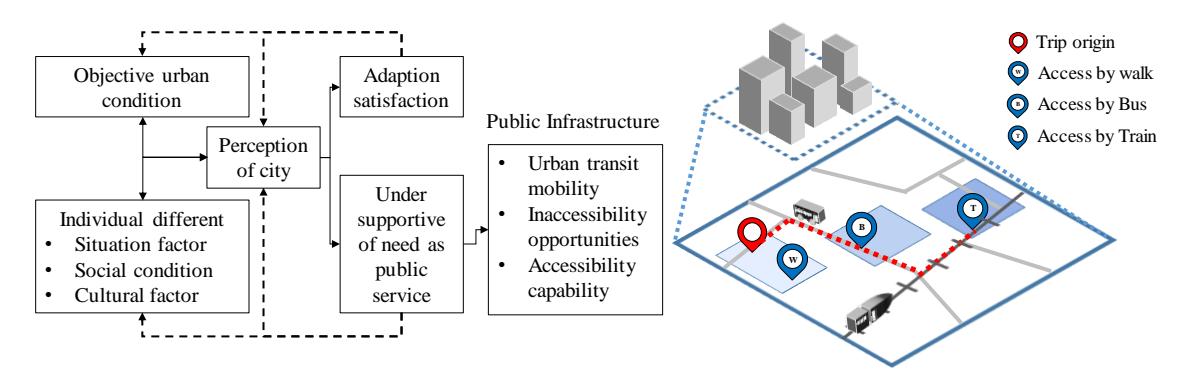
Figure 1. Eclectic model applied to an urban environment (Bell and Greene, 1978) Catchment area and isochrones (Huang et al., 2020; Nigro et al., 2019)
In most cities, problematic rail networks and conventional bus network layouts seem to be closely related to the service level called redundancy (Sun et al., 2013). Meanwhile, transport assessment analyzes public transportation based on trip generation, trip distribution, and traffic assignment to address the development and calibration of mathematical models (Potts and Oliver, 1972). However, accessibility is likely a challenge for stakeholders in effective feeder implementation to upgrade the feeder network with a more favorable design. In Israel, the average cost per vehicle kilometer, degree of service, transport fares, and the number of passengers have been proven to be the key factors in transport reformation ability (Ida and Talit, 2017), whereas in Canada it was the interface between different modes of transportation, such as bus and light rail (Guillot, 1984).
Literature review
Multimodal Transportation
In transportation planning, household concentration and nondrivers completely represent the demand for public transit services to satisfy trip proposals (Litman, 2013). A static simulation of developing cities has been performed by Azucena et al. (2021), where the incorporated data were derived from the investigation of the impact of a new project on a multimodal transportation system. Generally, multimodal transportation is an assembly of different modes of transportation within a road transportation chain (Elbert et al., 2020) that traces the passenger's transportation from a point within the coverage area to a designated point. Six methods for measuring transport accessibility are commonly applied: 1) graph theory and spatial separation measurement; 2) cumulative opportunity modeling; 3) gravity type modeling; 4) log sum utility modeling; 5) time-space measurement; and 6) comparison of empirical accessibility measurements (Bhat et al., 2000). A schematic chart of multimodal transportation is shown in Figure 2.
Figure 2. Schematic chart of multimodal transportation.
Feeder Function
Realizing the vision of policymakers in urban mobility improvement areas involves multidimensional cooperation from different groups of people (Rees et al., 2020); in the interim, rail transit primarily supports long trips. The first priority is to enhance passenger flow by supporting travel distances greater than marginal trips, despite the fact that a rail feeder bus costs more than a direct bus, both in primary and secondary attractive areas (Hu et al., 2012). An effective solution can be achieved by 1) vertical urban development (Wahyudi, 2018), and 2) feeder reformation based on the demand-responsive connection (DRC) approach (Costa et al., 2021; Martínez and Eiró, 2012). An overview of DRC research is shown in Table 1.
Author (year) Case DRC Transport mode Model assessment Mageean and Nelson (2003) Europe √ - Telematics-based DRT Brake et al. (2004) UK √ Bus Survey Quadrifoglio and Li (2009) USA √ Bus Costs and service quality Martínez and Eiró (2012) Portugal √ Bus, Train Vehicle Routing Problem formulation Sun et al. (2013) China √ Bus, Train Multi-objective model Deng et al. (2013) China √ Bus Generation algorithm Chandra and Quadrifoglio (2013) USA √ Link-node connectivity Connectivity index Jiang and Guo (2014) China √ Bus Customer Satisfaction Calabrò et al. (2020) Italy √ Bus Ant-colony optimization Giansoldati et al. (2021) Italy √ Walk, Bus, Train Discrete choice model Sala et al. (2021) Spain √ Bus Social network analysis Costa et al. (2021) Brazil √ Bus, Train Simulation-optimization model Vansteenwegen et al. (2022) Belgium √ Bus Optimization problem modeled with DON-PBS
Gkiotsalitis (2022) Singapore √ Bus, Train Convex optimization Present research Thailand √ Walk, Bus, Train Accessibility index
Table 1. Overview of Feeder Bus and DRC Research
Data and methods
Study Area, Demographics, Public Transport, and Representative Trips
According to the compact city principles, urban land density commonly begins to decrease from the urban center outward, following an inverted S-shape rule (Jiao, 2015). Initially, the densely inhabited district (DID) criteria were designated to basic census blocks as units, where any district consisting of these blocks with a population of 5,000 people was designated as a 'quasidensely inhabited district' (Statistics Bureau of Japan, 2020) by DID parameter (inhabitants/ha). Similarly, Indonesia has proposed different densities for station areas, ranging from 10 to 85 inhabitants/ha (Ramadhan and Pigawati, 2019).
The present research used Khon Kaen, Thailand, a city in the northeast of Thailand, as the study area. It has a population ranging from 380,577 to 571,703 people (Provincial Statistics Office, 2020). An urban rail public transportation project in Khon Kaen has been planned following the 12<sup>th</sup> National Economic and Social Development Plan (Office of the National Economic and Social Development Council, 2017). Urban public transportation in Khon Kaen currently consists of four modes of transportation: 1) minibus; 2) bus; 3) taxi; and 4) motorcycle (PCBK and Thammasat University, 2011). The bus network includes 19 routes denoted by bus numbers (2, 3, 4, 5, 6, 8, 9, 10, 11, 12, 13, 14, 16, 17, 19, 20, 21, 22, and 23). These modes of transportation can be classified according to user ratio into 53.6% motorcycles, 32.1% private cars, and 14.3% public transport. This study used transport demand based on population allocation to residential buildings (National Statistical Office, 2020) adopted for the trip origin. In Khon Kaen, transport is expected to increase rapidly from a total of 656,500 trips per day in 2018 to 1,146,400 trips per day in 2036 (Office of Transport and Traffic Policy and Planning, 2016). Rail transport has been proven to be a cheap, safe, and equally accessible option (Elkhoury et al., 2018). The urban rail investment plan for 2036 covers five major routes, which are expected to be completed within three separate time frames: 1) North-South line (known as the Red Line) with a completion date of 2021; 2) East-West line (known as the Yellow Line and Pink Line) with a completion date of 2026; and 3) East–West line (known as the Blue Line) and Northeast to Southwest (known as the Green Line) with a completion date of 2036. As a result, a total of 31 stations should be allocated to these routes along a 122-km road, as shown in Table 2 and Figure 3.
Table 2. Public Transport Information
| No. | Mode | Number | Total length | Speed (km/hr) | Number of stations | Year |
| of Routes | (km) | (stations) | (A.D.) | |||
| 1 | Walk | - | - | Desired walk speed | - | - |
| 4.8 km/hr | ||||||
| 2 | Bus | 19 | 294.39 | Desired bus speed 15 | 314 | 2020 |
| km/hr | ||||||
| 2.1 | Train | 1 | 22.68 | Desired rail speed 60 | 16 | 2021 |
| 2.2 | (project) | 3 | 46.38 | km/hr | up to | 2026 |
| 2.3 | _ | 5 | 73.13 | - | 31 | 2036 |
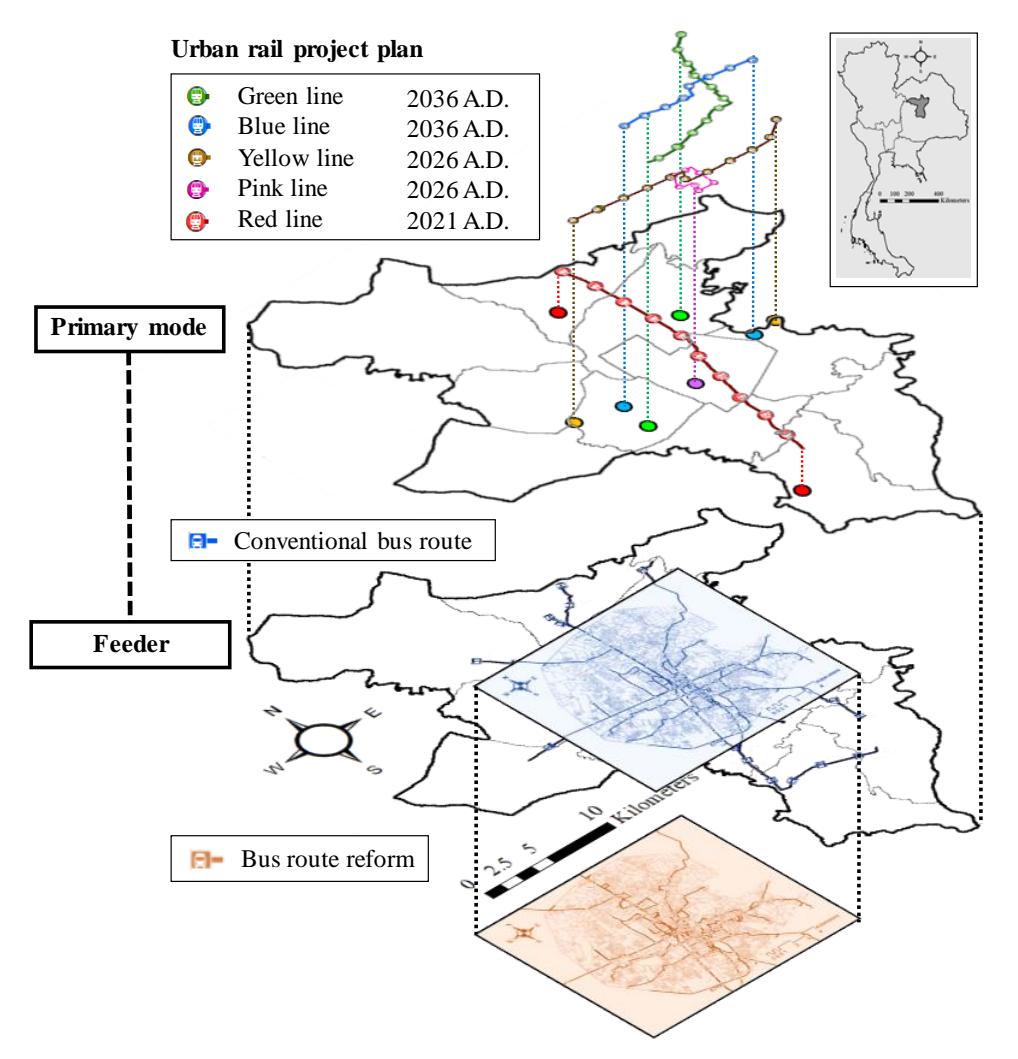
Figure 3. Urban rail investment plan, conventional and reformed bus network, Khon Kaen, Thailand.
The concept of transportation accessibility is based on human characteristics such as education, culture, recreational facilities, industrial and communal facilities, and social welfare. This study primarily focused on trip access based on three major types of building uses (square meter/unit): 1) commercial use – shopping malls and retail shops; 2) mixed use – buildings with more than two functional modes; and 3) public facilities – utility units for public service provided by the government (Department of Public Works and Town & Country Planning: Thailand, 1979) (Munier, 2006). The data in this study was processed by the Geo-Information System and interpreted into polygonal data based on the number of building units in 2018, as shown in Table 3 and Figure 4.
Table 3. Types of Buildings (Trip Proposals) in Khon Kaen, Thailand
| No. | Mode of building | Unit | Area (km2 ) | Unit | Area (km2 ) | |
|---|---|---|---|---|---|---|
| Total | Urbanization | |||||
| 1 | Public facilities | 4,570 | 1.38 | 2,886 (63.2%) | 0.95 (68.5%) | |
| 2 | Mixed use | 1,848 | 1.68 | 770 (41.7%) | 0.62 (36.8%) | |
| 3 | Commercial | 10,615 | 3.68 | 8,082 (76.1%) | 2.59 (70.3%) | |
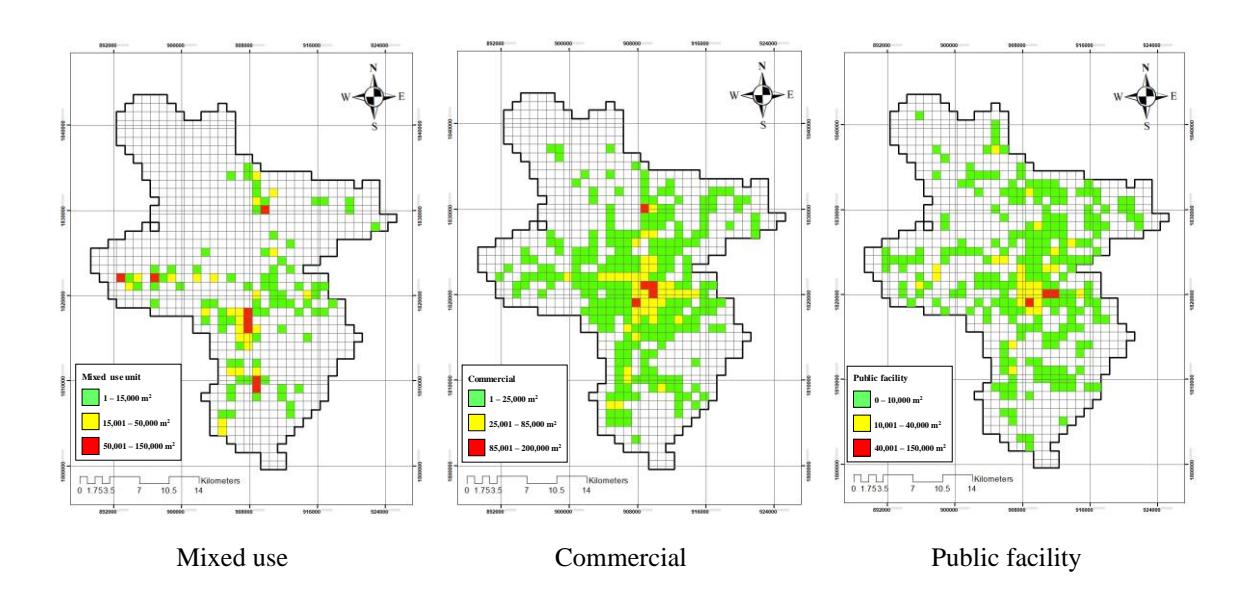
Figure 4. Trip proposals presented by grid index \((1 \times 1 \text{ km}^2)\), Khon Kaen, Thailand.
Accessibility Measurement
Accessibility measurement is a fundamental aspect of assessing transport accessibility. In most cases, cumulative trip opportunities are useful for measuring accessibility. This study presents accessibility refinement among the spatial separation measurement, cumulative opportunity model, time-space measurement, and utility model concepts. Transport accessibility levels have a relationship with urban mobility levels (Lessa et al., 2019), with significant differences between many urban planning cases, mobility patterns, points of service, and availability of public transportation (Moura et al., 2017). The final decision on the enhancement of public transport accessibility has to be made in mutual agreement by authorities from several sectors. Urban network analysis is conducted to quantify the network enumeration used to reach facilities (Morimoto, 2015). Eleven different key factors influence urban transport accessibility according to Litman (2021).
In this study, the measure of transport accessibility was the cumulative number of trip opportunities available in the network (i) up to time limit (k), while accessibility is defined as the walking distance to a bus stop in the service area. Transport accessibility was categorized and demonstrated via four basic perspectives (Geurs and Wee, 2004; Geurs, 2018; Bhat et al., 2000), representing the common concept of transport accessibility (Litman, 2013) as the transportation path between mobility and associability. After this effective measurement was used to define the general notions from graph theory and spatial separation, the weighted average of travel time for all zones of consideration could be obtained from an equation with \(d_{ij}\) as the distance between i and j, and b as general parameter, as expressed in Eq. (1)
\[Ai = \sum_{n=0}^{\infty} \frac{dij}{b_n} = \frac{\text{(Zone x Weight average)}}{\text{sample size (n)}}\] (1)
From the assessment result accessibility indexes were derived based on which the three different transport modes were compared: 1) walk; 2) bus; and 3) urban rail, while multimodal transportation consisted of: 1) walk; 2) walk-bus-walk; and 3) walk-bus-train-walk taking 10 to 40 minutes; a schematic flow diagram is shown in Figure 5. Equations (2)-(6) describe trip consumer demand perceived by quantifying employment in order to analytically interpret human activities into five accessibility indexes (AC), namely: \(AC_1 = a\) total walk time of 10 minutes, as expressed in Eq. (2); \(AC_2\) and \(AC_3 = a\) total walk and bus time of 30 minutes, as represented by conventional bus routes and reformed bus routes and expressed in Eqs. (3) and (4), respectively; and \(AC_4\) and \(AC_5 = a\) total bus, train, and walk time of 40 minutes, as represented by conventional bus routes and reformed bus routes and expressed in Eqs. (5) and (6), respectively. Remarkably, the results were consistent with a previous study, which suggested that the total time for consideration should be shorter than 60 minutes (Pulido et al., 2018). However, trip-cost constraints and waiting time were not addressed in this study and should be addressed in a different context.
\[AC_{1} = \sum_{k=10 \, \text{min}}^{SA} (P_{n} x T_{n}) / \sum_{k=10 \, \text{min}}^{SA} (P_{n})\] (2)
\[_{\text{AC}_{2}} = \left(\sum_{k=10\,\text{min}}^{\text{CFbus}} \left(\sum_{k=10\,\text{min}}^{\text{SA}} \left(P_{n}\right)\right)\right) x \left(\sum_{k=10\,\text{min}}^{\text{SA}} \left(T_{n}\right)\right) / \sum_{k=10\,\text{min}}^{\text{SA}} \left(P_{n}\right)\right)\](3)
\[_{\text{AC}_{3}} = \left(\sum_{k=10\,\text{min}}^{\text{CFbus reform}} \left(\sum_{k=10\,\text{min}}^{\text{SA}} \left(P_{n}\right)\right)\right) x \left(\sum_{k=10\,\text{min}}^{\text{SA}} \left(T_{n}\right)\right) / \sum_{k=10\,\text{min}}^{\text{SA}} \left(P_{n}\right)\] \[\tag{4}\]
\[_{\text{AC}_{4}} = \left( \sum_{k=10\,\text{min}}^{\text{CF train}} \left( \sum_{k=10\,\text{min}}^{\text{CF bus}} (\sum_{k=10\,\text{min}}^{\text{SA}} (P_{n}))) \right) x \left( \sum_{k=10\,\text{min}}^{\text{SA}} \left( T_{n} \right) \right) / \sum_{k=10\,\text{min}}^{\text{SA}} (P_{n}) \right)\] (5)
\[_{\text{AC}_{5}} = \left(\sum_{\substack{k=10 \text{ min}}}^{\text{CFtrain}} \left(\sum_{\substack{k=10 \text{ min}}}^{\text{CFbusreform}} \left(\sum_{\substack{k=10 \text{ min}}}^{\text{SA}} \left(P_{n}\right)\right)\right)\right) x \left(\sum_{\substack{k=10 \text{ min}}}^{\text{SA}} \left(T_{n}\right)\right) / \sum_{\substack{k=10 \text{ min}}}^{\text{SA}} \left(P_{n}\right)\right)\](6)
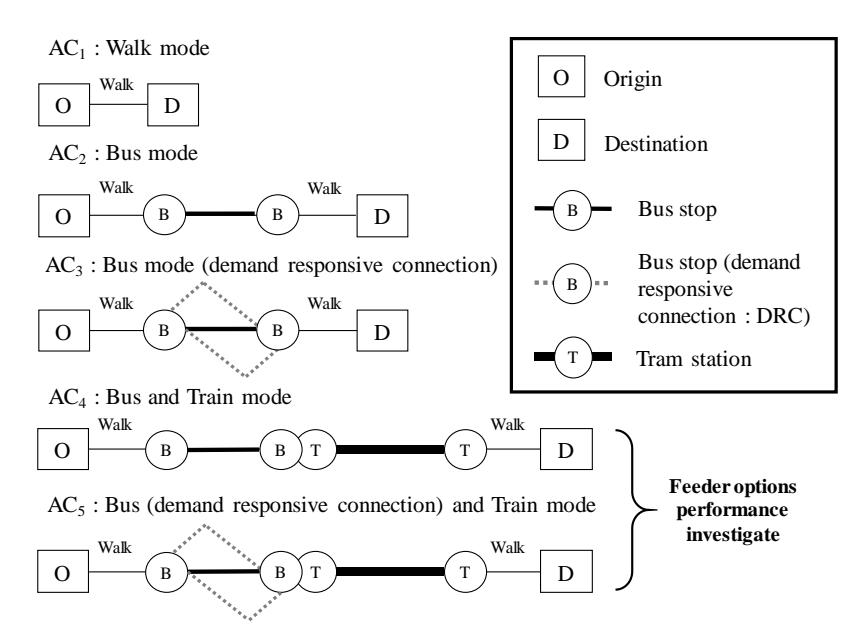
Figure 5. Schematic flow diagram of transport accessibility (AC<sub>1</sub>, AC<sub>2</sub> AC<sub>3</sub>, AC<sub>4</sub>, and AC<sub>5</sub>).
- Population (P<sub>n</sub>): buildings classified by ArcGIS execution, allocated according to residential units (persons).
- Trip proposals \((T_n)\): destinations classified by building function \((m^2/unit,\) calculated in logarithmic form). The destination perception was executed by the Grid Index Features tool with grid size \(100 \times 100 \text{ m}^2\).
- Service area: area of execution of mobility function within the network.
- Closest facility: route execution by network with unit transmission (bus stops and rail stations).
Bus Route Reformation by Demand-Responsive Connection
The findings suggest that the redesign of the feeder bus routes should be based on: 1) survey and investigation of the physical possibility of route reformation; and 2) stakeholder impact measurement for the following three cases under consideration: 2.1) separate individual lines for bus routes; 2.2) both forms of feeder bus network; and 2.3) integrated multimodal transportation network, including walk, bus, and train, as shown in Figure 6. Additionally, critical consumer demand density is an important factor in relation to urban cognition toward demand-responsive connection service (Li and Quadrifoglio, 2010; Delmelle et al., 2012). Network-based metrics can be used to systematically describe and reveal network capacity (Xu et al., 2015), which is a primary consideration for feeder bus performance. Metro line redundancy has been studied in the case of China's metro network by Jing et al. (2019).
The present study determined the existing condition with conventional bus routes. Primary route reformation typically focuses on the redundancy rate (Jing et al., 2020; Jenelius, 2010; El-Rashidy and Grant-Muller, 2016). More than 50% redundancy was found for 12 out of 19 routes, while keeping the origins and destinations of the bus routes, as shown in Figure 7. The reformed route was designed considering route connectivity, road authority acceptance, road width, turning points, and bus stop locations. The nodes are mutually connected by tracks perpendicular to the rail line within a 300-meter buffer zone from a rail station (the average distance between rail stations is 800 meters).
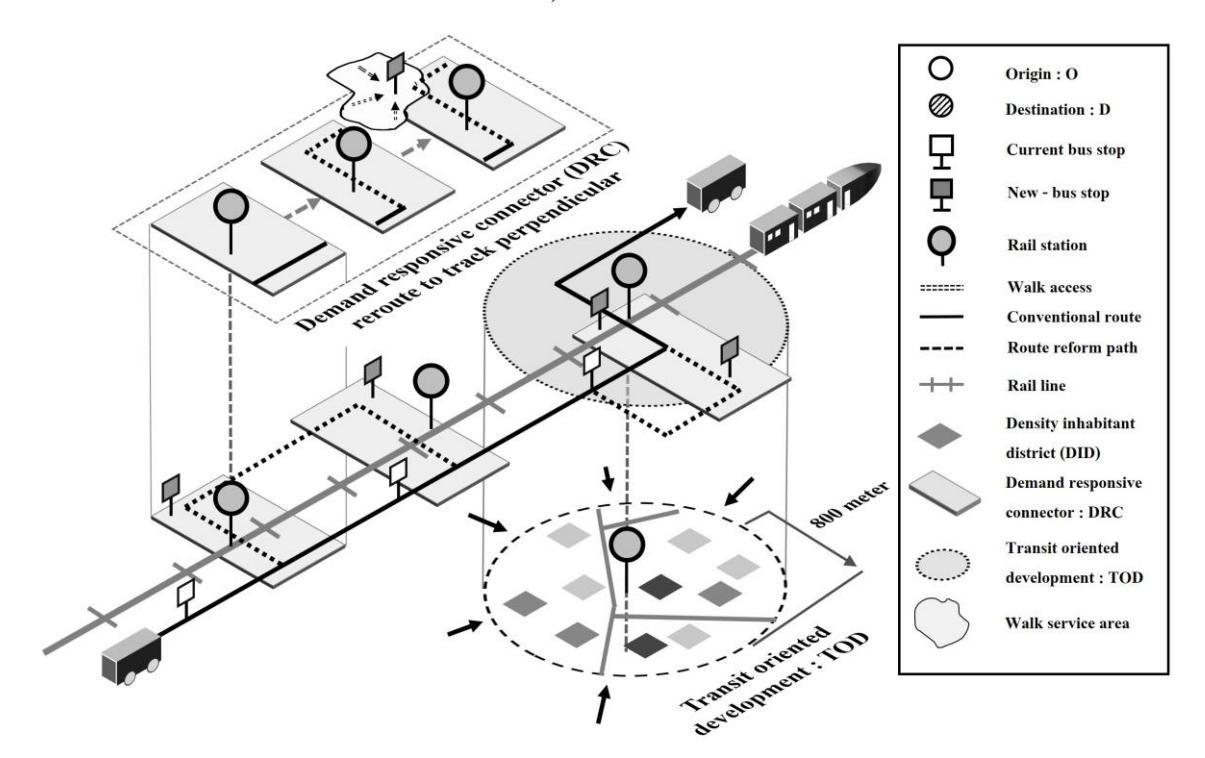
Figure 6. Schematic chart of bus route reformation by DRC.
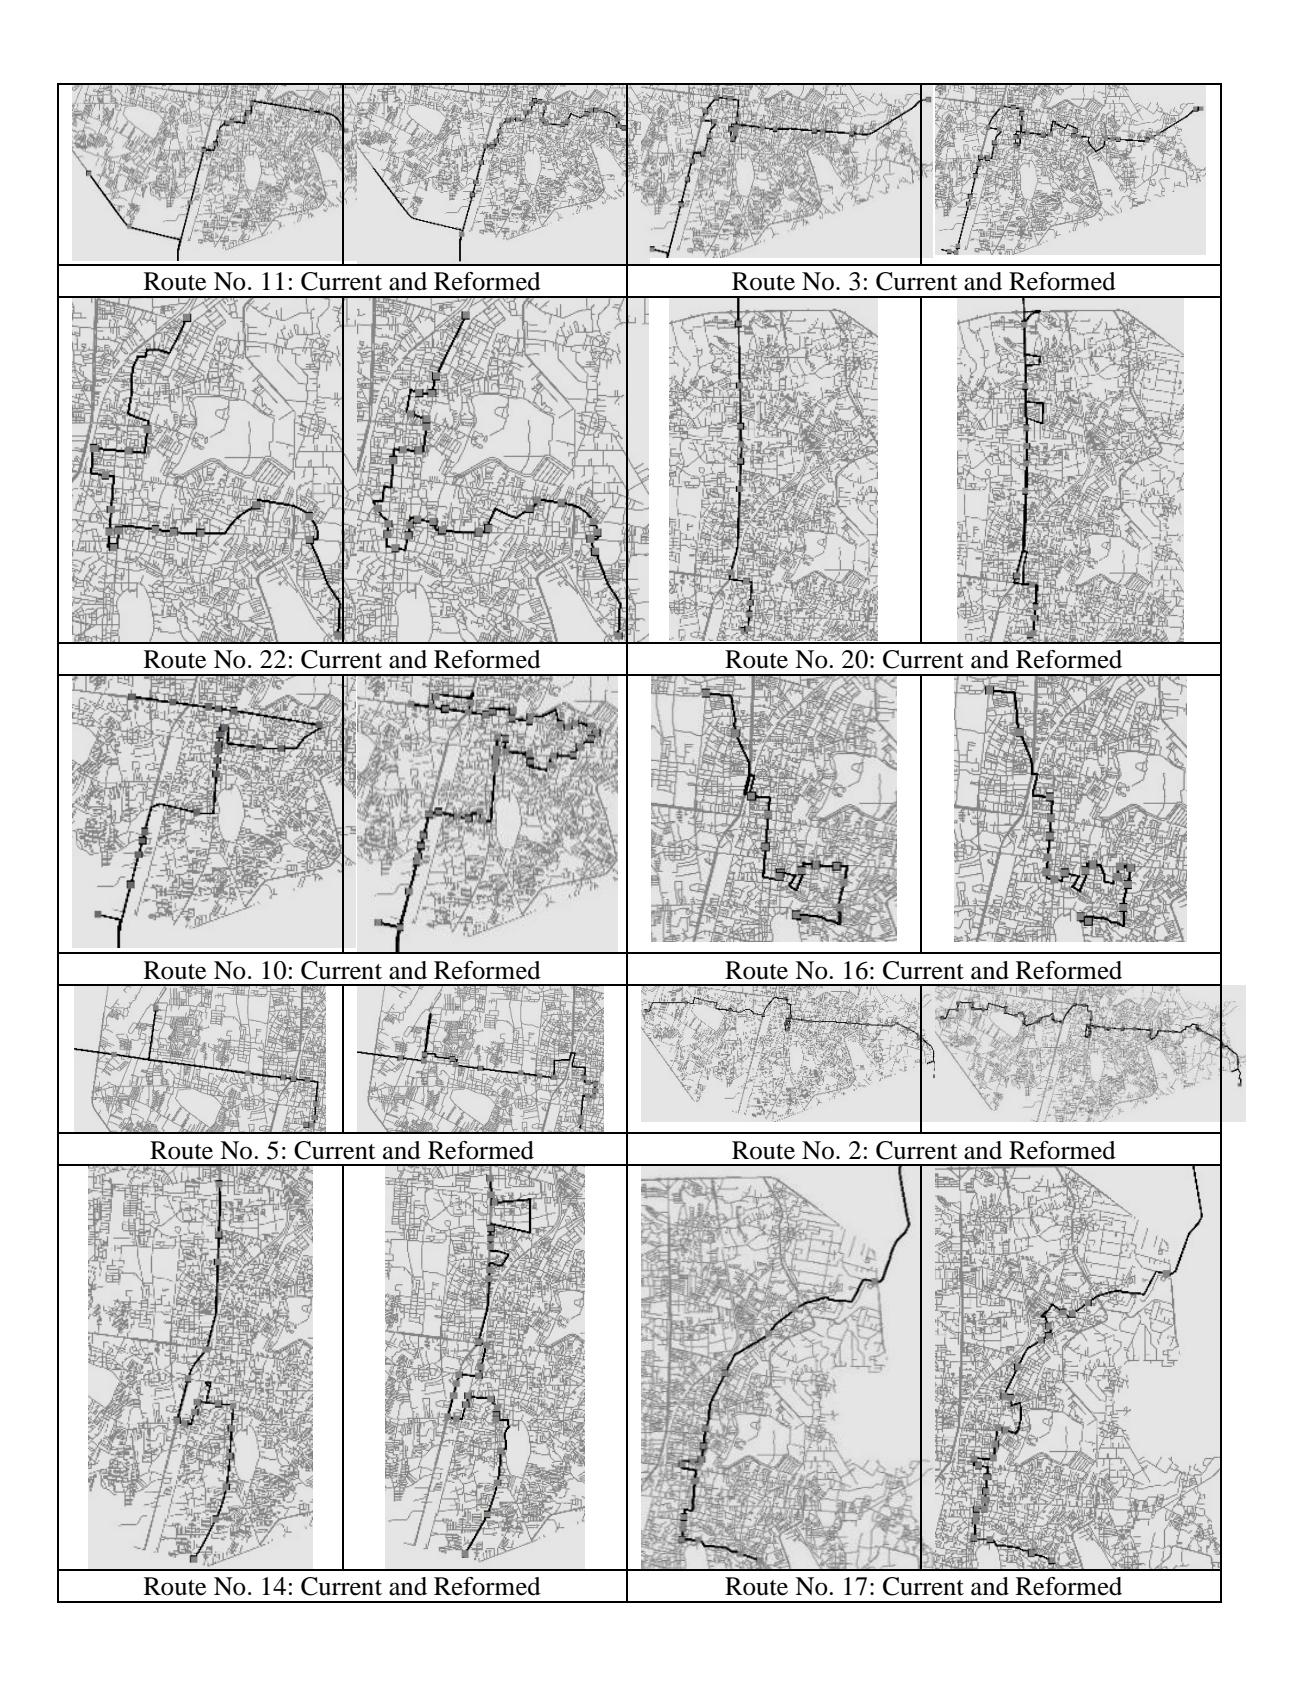
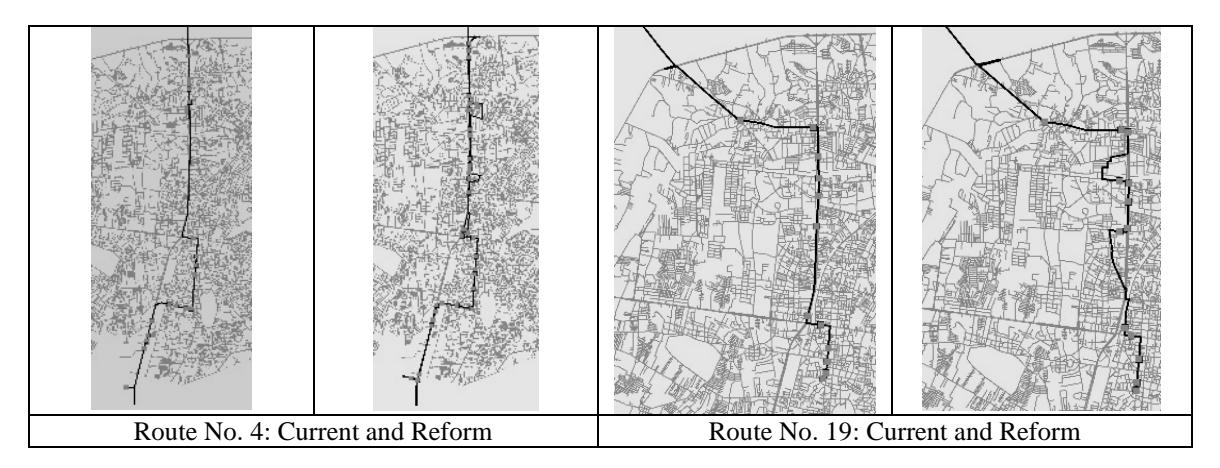
Figures 7. Bus network comparison of 12 conventional and reformed routes.
Results/discussion
The route reform consideration framework is shown in Table 4. Implementation of route reform was hampered by: 1) the performance of the routes depending on the authorities responsible for the different road networks; 2) the physical infrastructure not always allowing for new bus stops; and 3) existing bus route returning points being located outside the 300-meter buffer zone from a rail station.
| No. | Network | Assessment | Concept reform | Impact |
|---|---|---|---|---|
| 1 | Bus Network: | Accessibility | 1. Gentrification | • Urban Transit |
| Primary Mode | Index per Individual Route | 1.1 Perpendicular Tracks 1.2 Rail Station Buffer Zone | Mobility | |
| 2. Physical Route and Regulations | • Inaccessibility Opportunities | |||
| 2 | Bus and Train Network: | Accessibility Index for the | 2.1 Route Connectivity 2.2 Route Authority | • Accessibility |
| Feeder and | Whole Network | 2.3 Physical Infrastructure | Capability | |
| Primary Mode | 2.4 Redundancy Rate | |||
| 3. Social contribution | ||||
| 3.1 Fixed Origin and Destination |
Table 4. Route Reform Consideration Framework
Secondly, the data analysis focused on the distinct and fundamental prospect of route reformation. The ideal distance within the buffer zone from rail stations led to the generation of 169 new bus stops. The accessibility index of the reformed routes was significantly lower than that of the conventional routes, with 4 out of 6 route trips for the mixed-use units, 6 out of 12 route trips for the public-facility units, and 6 out of 12 route trips for the commercial-use units. In the case of individual route consideration, the side effects from both cases were revealed by the accessibility values in the 30-minute evaluation, as shown in Figure 8. However, the average length of time spent on the reformed routes increased by 11% compared to the conventional routes, with some impact on the time consumed for the whole network.
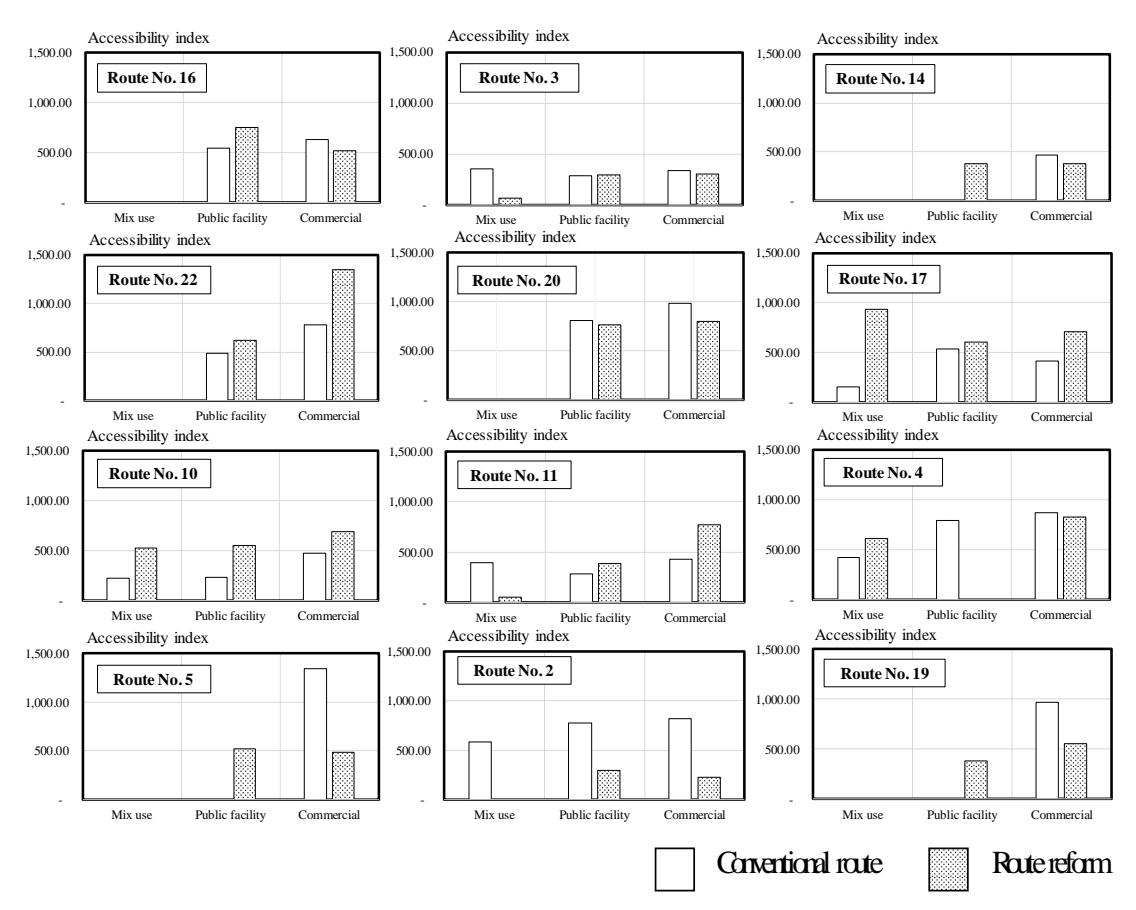
Figure 8. Bus network presented by accessibility index comparison between conventional routes and reformed routes.
Finally, the data analysis specifically compared both forms of feeder network (conventional and reformed) within the multimodal transportation system by a fixed 40-minute consideration time. Walkability increased for the 12 reformed routes, supporting 18,523 people with 483 bus stops, which is more than the 13,729 people with 314 bus stops for the conventional routes. Demographically, the population's capability to walk to bus stops and rail stations increased by 102.5%. Within the bus network, the reformed routes had a population reachability of 20,872 people, whereas the conventional routes had a population reachability of 10,307 people. Even though the multimodal transportation assessment revealed a slight decrease in bus network accessibility of public-facility units and commercial-use units for the reformed routes (for a fixed 30-minute consideration time), the feeder reform was highly effective for all designated multimodal trips, as shown in Table 5 and Figure 9.
Table 5. Accessibility Index for Multimodal Transportation.
| Multimodal | Accessibility index | ||||||
|---|---|---|---|---|---|---|---|
| Time use | transportation | Mix use | use Public facility | cility | Commercial | ||
| (minute) | Reform | Current | Reform | Current | Reform | Current | |
| 10 | Walk | 85.05 | 85.05 | 143.20 | 143.20 | 184.77 | 184.77 |
| 30 | Walk-Bus-Walk | 323.14 | 279.26 | 541.99 | 498.02 | 638.31 | 697.62 |
| 40 | Walk-Bus-Train-Walk | 1,443.03 | 465.43 | 1,420.43 | 740.04 | 1,748.78 | 984.91 |
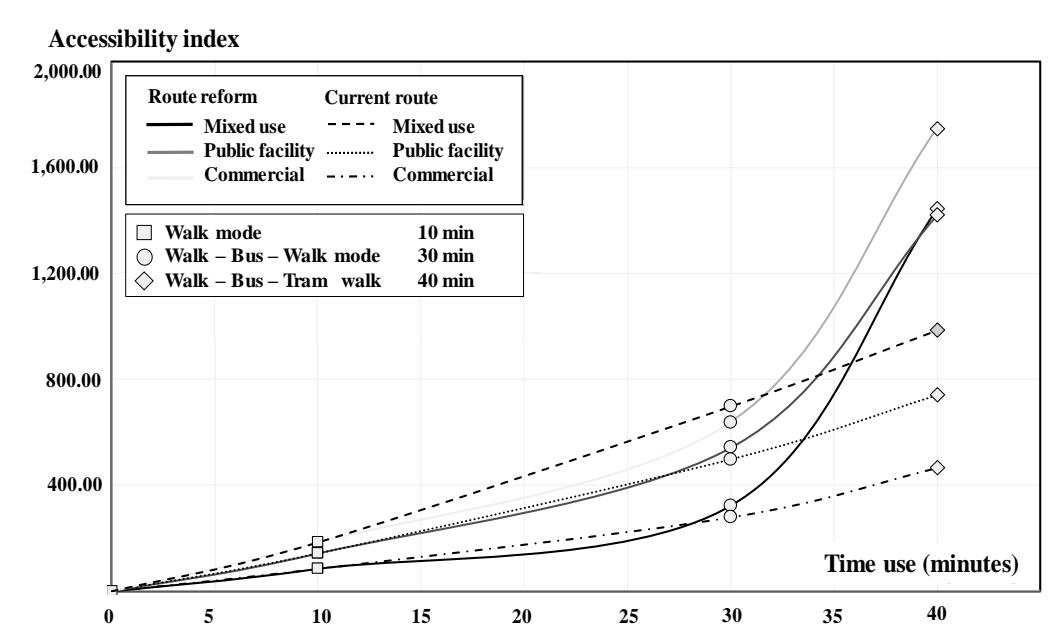
Figure 9. Multimodal transportation represented by accessibility index of three integrated transport modes.
The multimodal transportation assessment used a well-studied travel model based on urban transit without the use of private vehicles, where urban rail system was assigned as the primary mode of urban transit and the bus network as feeder. The data analysis cases were specifically related to the predicted situation in 2036, where the assessment model provides an overview of the urban morphology and transportation system based on integration of public transit modes (walk, bus, train). Furthermore, urban design as well as land use type (Liu et al., 2021) have been proven to be effective factors in Transit-Oriented Development (Yildirim and Arefi, 2020). The primary objective of this study was to reveal the public transportation mechanism, with an emphasis on the feeder bus network in relation to urban demographics. It is noted that the bus route reformation policy aimed to preserve the proposed routes (fixed origin and destination nodes) and route development perpendicular to train tracks attempted to encourage effective opportunity acknowledgment of innovative feeder policies.
Conclusion
The demand-responsive connection approach efficiently analyzes urban development related to urban morphology, where the points of interest (bus stops) are extended in route reformation to promote rail transit attractiveness in response to horizontal urban sprawl along a primary road. The examination of a cognition-based urban infrastructure firmly demonstrated its capability. When presenting urban rail as a primary mode of transportation, a city has to address critical issues related to both the underlying compact city concept and feeder bus performance. Reformation of conventional bus routes is an alternative approach to complementarily supporting an effective feeder bus network. Thus, the development of a public transit network as a secondary layer, for example by adopting the demand-responsive connection approach, is becoming increasingly crucial, particularly within sprawling residential areas.