
Introduction
The inequality between rural and urban areas has resulted in the emergence of poor and underdeveloped areas. The development of an area within a region cannot take place uniformly, which is due to many factors, both natural (geography, human resources, natural resources) and artificial (including infrastructure and social resources), that are not evenly distributed throughout the region (Otok et al., 2021). Apart from causing inequalities in development, this condition can also be one of the causes of the emergence of underdeveloped areas. In Indonesia, as a developing country, the problem of development inequalities is one of the government's work priorities, as regulated in Presidential Regulation (Perpres) Nr. 131 of 2015 and the National Development Plan Medium Term 2015-2019 (RPJMN), which states that there are 122 backward regions in Indonesia, six of which are in Java (Al Azies, 2021).
The Ministry of Villages, Development of Disadvantaged Regions, and Transmigration (KNPDT) categorizes underdeveloped areas in four groups, namely, slightly underdeveloped; underdeveloped; very underdeveloped; and severely underdeveloped; The grouping is based on the weighted average of six measured indicators: community economy, human resources, infrastructure, local financial capacity (budget gap), accessibility, and regional characteristics. One of the weaknesses of the weighted average is the subjective determination of the weight assigned to each indicator (Al Azies, 2022). In addition, the KNPDT data having many outliers affects the grouping results, and a large amount of data also affects the grouping results.
The presentstudy used cluster analysis to identify, classify and map underdeveloped areas on the island of Java. To overcome large datasets ('big data'), they can be analyzed with various techniques, one of which is unsupervised learning using a clustering algorithm (Sidey-Gibbons, 2019). Therefore, in this study, clustering was used, specifically partition clustering. The method used makes an initial partition k at the beginning, where the parameter k is the number of partitions to be made. Several popular partitioning clustering methods were compared in this research, i.e., K-Means, K-Medoids, and CLARA.
Several other studies related to the comparison of partitional clustering methods have been conducted. For example, the research of Gupta (2019), who compared K-Means clustering and CLARA clustering on the Iris Dataset. The conclusion was that the CLARA method had better clustering results because it is sensitive to outliers. In addition, Arorra (2016) found that the time required to select the cluster centroid point and the complexity of the overlapping cluster space is much shorter using K-Medoids compared to K-Means in big data analysis. Martin (2015) studied the performance of GMM compared to other methods, which resulted in the conclusion that a mixed growth model has better performance than simple clustering to study longitudinal heterogeneity. Otok et al. (2021) conducted research related to underdeveloped areas by modeling factors that affect infrastructure in Java using Meta-Analysis Structural Equation Modeling
(MASEM) (Cheung, 2013) with three indicators, namely accessibility, regional characteristics, and economy. Therefore, using an unsupervised learning approach with partitional clustering for the problem of identifying underdeveloped areas in Indonesia is suitable. In addition, Otok et al. (2020) used the meta-CFA approach to investigate factors that affect underdeveloped areas on the island of Java.
A novelty in this study consisted of grouping the identified underdeveloped areas of all regencies/cities on Java based on several infrastructure indicators. The reason for using a partitional (non-hierarchical) clustering method was that it deals better with large data sets compared to hierarchical clustering methods (Nakayama, 2020). Another advantage is that it can perform analyses of larger samples more efficiently (Govender, 2020). However, it has some weaknesses related to outliers (Violán et al., 2018), the distance measure used (Park et al., 2018), and irrelevant or inappropriate variables (Violán et al., 2018).
The objectives of this study were: (1) to evaluate the clustering performance of three unsupervised learning methods, (2) to know the characteristics of each region on Java Island identified as underdeveloped based on several basic infrastructure indicators, (3) to map the clustering results so that they can be used as a reference for the government in determining policy directions to overcome the problems of these underdeveloped areas, which should be the main priorities for infrastructure development.
The rest of this paper is divided into the following parts. Section 2 describes the methodology used, including a description of the concept of the clustering algorithm as well as the data sources and research variables used in the study. Section 3 explains the experiment that was carried out and the results that were obtained. Finally, Section 4 concludes the study.
Material and Method
Data Sources and Research Variables
This study used a data set derived from the Statistics Indonesia database. Two data sets, were used, both of which contained secondary data: (1) a dataset collected from the 2014 edition of the Village Potential Data Collection (PODES), which is data and information related to the existence of infrastructure and the potential possessed by each village-level administrative area in Indonesia, and (2) a data set collected from the 2014 edition of the National Socio-Economic Survey (SUSENAS), which is data on various socio-economic aspects and the fulfillment of life needs such as clothing, food, housing, education, health, security, and employment. The results of the aggregation of these two data sets consisted of 119 observations representing the number of regencies/cities on the island of Java, where each regency/city had nine features or variables to represent the infrastructure conditions.
| Variable | Unit |
|---|---|
| Asphalt/concrete roads (X1) | Number of villages |
| Paved roads (X2) | Number of villages |
| Dirt roads (X3) | Number of villages |
| Other roads (X4) | Number of villages |
| Markets without building (X5) | Number of villages |
| Health facilities (X6) | Number of units |
| Health workers (X7) | Number of persons |
| Basic education facilities (X8) | Number of units |
| Telephone user households (X9) | Number of households |
Table 1. Research Variables
The distribution of regencies/cities in each province on the island of Java is as follows: Capital Special Region of Jakarta Province (6 cities), West Java Province (27 regencies/cities), Central Java Province (35 regencies/cities), Special Region of Yogyakarta Province (5 regencies/cities), East Java (38 regencies/cities), cities) and Banten (8 regencies/cities). Figure 1 below visualizes the study area in this research, namely the Island of Java, Indonesia, which consists of six provinces, where each province consists of several regencies/cities as described in the previous explanation.
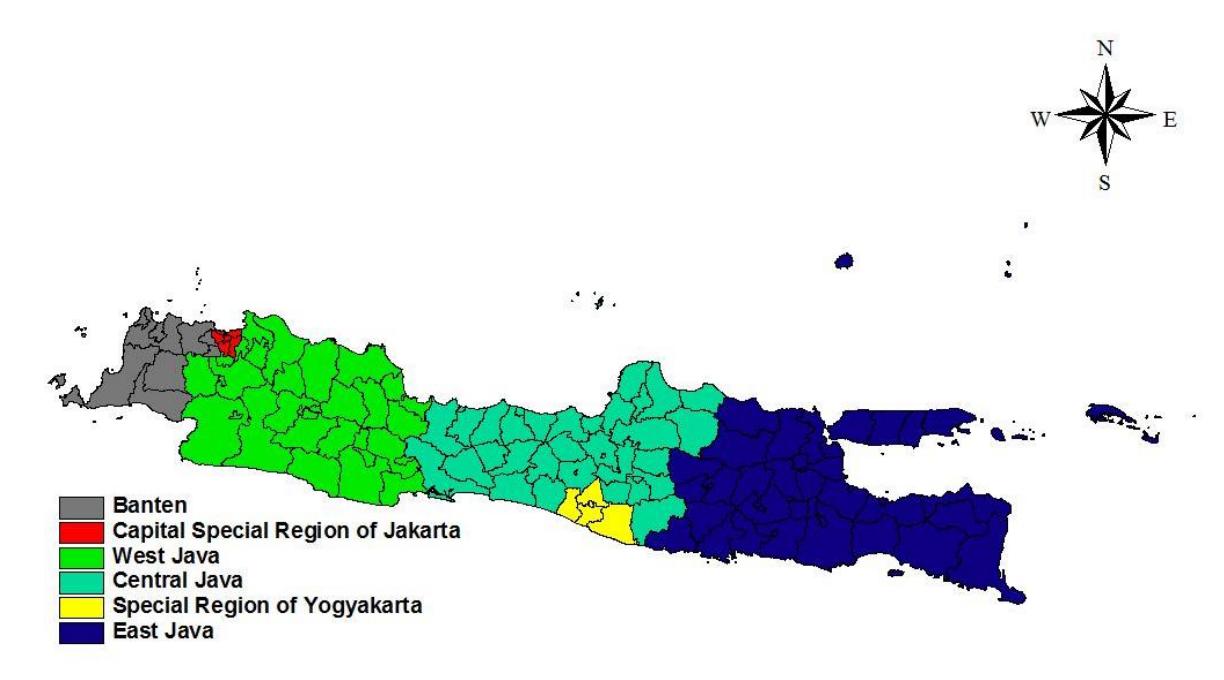
Figure 1. Java Island study area. (Source: authors, 2022)
As mentioned above, the level of development of regions is assessed by the Indonesian government using five dimensions, namely, economy, human resources, infrastructure/infrastructure, accessibility, and regional characteristics. This study focused on the infrastructure dimension using nine constituent indicators, as described in Table 1. These nine indicators were based on the indicators used by the Ministry of Villages, Development of Disadvantaged Regions, and Transmigration (KNPDT) to determine the underdeveloped status of a region.
Unsupervised learning and clustering algorithms
Supervised learning and unsupervised learning are the two main types of machine learning techniques. Supervised learning uses a known data set (training data set) to make predictions (Trishnanti and Al Azies, 2019). This research used unsupervised learning, which uses a machine learning algorithm to analyze data sets made up of labeled responses of input data. The most common unsupervised learning method is cluster analysis. Clustering algorithms can be broadly divided into two groups, namely hierarchical and partitional (non-hierarchical). The partition method first sets the variable k, where k is the number of partitions to be formed. Then, it iteratively uses relocation techniques, repeatedly trying to move objects from one group to another, to achieve the optimal partitioning. Examples of this type of method are K-Means, K-Medoids, and CLARA (Han et al., 2011).
K-Means clustering
The K-means algorithm aims to divide data into several clusters. This algorithm accepts data without class labels as input (unsupervised learning). The algorithm for performing K-Means clustering is (Likas et al., 2003):
- 1. Determine the value of k as the number of clusters to be formed.
- 2. Determine the initial value of the centroid, or the center point, of the cluster. At this point, the centroid value is randomly determined for the next step, using the following equation:
\[\overline{V}_{ij} = \frac{1}{N_i} \sum_{k=0}^{N_i} X_{kj} \tag{1}\]
\(\overline{V}_{ii}\): i-th centroid cluster for the j-th variable
\(N_i\): number of data in the i-th cluster
i, k: cluster index
j: index of the j-th variable
\(X_{ki}\): value of the k-th data in the cluster for the j-th variable 3. The calculation of the distance between the centroid and the point of each object can be done using the Euclidean distance with the following equation:
\[d_{e(x,y)} = \sqrt{\sum_{i=1}^{n} (x_{ik} - x_{jk})^2}\] (2)
\(d_{e(x,y)}\): the distance between the i-th and j-th objects.
n : number of data in the i-th cluster \(x_{ik}\) : the i-th data object out of k data.
\(x_{jk}\): the j-th data object in the k-th data, or what is often called the centroid
(value of the midpoint) cluster for the number of data n
- 4. Group the data to form k clusters with the centroid point of each cluster being the closest centroid point. The determination of the cluster members must consider the minimum distance from the object.
- 5. Update the centroid value of each cluster.
- 6. Repeat Step 2 to the end until the centroid value no longer changes.
K-Medoid clustering
The K-Medoid method is similar to the K-Means method. Both include a partitioning method, which is a method of grouping data into multiple clusters without any hierarchical structure between them. The K-Means algorithm and the K-Medoids algorithm determine the center of the cluster in a different way. The K-Means algorithm uses the mean value (means) in each cluster, while K-Medoids uses data objects as representations (medoids) (Kaur et al., 2014). K-Medoids has the advantage of being more robust against outliers compared to K-Means, which is not robust against outliers because these are usually far/very far from the majority of the other data of the cluster's mean (Han, 2006). The K-Medoids algorithm is executed using the following steps:
- 1. Initialize k cluster centers (k = number of clusters).
- 2. Calculate the nearest cluster for each object using the Euclidean distance with Equation (2).
- 3. After calculating the Euclidean distance, initialize new random cluster centers for each object as non-medoid candidates.
- 4. Calculate the distance of each object that is in each group with the non-medoid candidates.
- 5. Calculate the total deviation (S) by subtracting the old total distance from the new total distance. If S < 0, swap the objects with non-medoid cluster data to form a new set of k objects as medoids.
- 6. Repeat Steps 3 through 5 until there is no change in the medoids so that the clusters and their respective cluster members can be obtained.
Clustering Large Applications (CLARA) Clustering
Clustering Large Applications (CLARA) is a clustering method that is a development of the working method of K-Medoids and uses sampling to manage large data sets combined with the PAM method developed by Kaufman and Rousseeuw (Schubert and Rousseeuw, 2021). Unlike other medoid methods such as PAM, CLARA is resistant to outliers and can be used on large amounts of data. CLARA is more efficient in terms of computation time and storage when handling large data sets. The CLARA algorithm is executed using the following steps:
- 1. Determine the number of clusters (k), then randomly divide the data set into several subsets of fixed size.
- 2. Determine the initial medoid.
- 3. Calculate the distance of non-medoid objects to the medoid of each cluster.
- 4. Place objects according to the distance closest to the medoid.
- 5. Calculate the total distance obtained.
- 6. Randomly select non-medoid objects in each cluster as new medoid candidates.
- 7. Calculate the distance of each non-medoid object to the new medoid candidates and place the objects based on the distance closest to the new medoid.
- 8. Calculate the difference between the medoid candidate's total distance for the new medoid and the total distance for the old medoid. If the total distance of each object to the new candidate medoid is smaller than the total distance of each object to the old medoid, then the candidate medoid becomes the new medoid.
- 9. Repeat Steps 6 to 8.
- 10. Calculate the distance between all non-medoid objects and objects are medoids until the subset with the smallest number is selected.
Gap Statistics
One method to determine the optimal number of clusters in the clustering process is the gap statistics method (Clayman et al., 2020). This method displays a graph to determine the optimal number of clusters. The gap statistics is the most consistent measure for determining the number of clusters relative to other measures (Yang et al., 2019). The distance between paired objects in a cluster is defined as:
\[D_r = \sum_{i,i'} d_{ii'} \tag{3}\] where d is the square of the Euclidean distance. The number of squares in a cluster is formulated as follows:
\[W_k = \sum_{r=1}^k \frac{1}{2n_r} D_r \tag{4}\]
The gap value is obtained by estimating the optimum number of clusters in the Wk standardization approach:
\[Gap_n(k) = E_n^* \{ \log(W_k) \} - \log(W_k)\] \[(5)\] where \(E_n^*\) is the expected value of the distribution of the number of samples. The criterion of the optimal number of clusters is given by the gap statistics value (k), which is the highest or the first to indicate a minimal gap increase when the gap is still increasing (Yang et al., 2019).
Cluster evaluation
Evaluation of the clusters consists of external and internal evaluations, where external evaluation can be done when the cluster has a label (supervised). However, the present study used only internal evaluation because the data used were not labeled. Internal evaluation uses internal information on the data to assess the clustering results, such as the density, relationship, and separation of the clusters. The internal evaluation criteria used here were the silhouette coefficient, Dunn's index, and the connectivity coefficient (Brock et al., 2008):
- a. The silhouette coefficient is a measure of the degree of confidence in grouping an observation with a cluster. The formed cluster will be classified as 'good' if the resulting coefficient is close to 1 and as 'bad' if the coefficient is close to -1 (Monica et al., 2021).
- b. Dunn's index is a validation measure of clustering results obtained by measuring the distance between two clusters and the diameter of the cluster. Dunn's index is the ratio between the greatest distance between two clusters and the smallest distance in a cluster. A formed cluster is better when the Dunn's index value is higher (Brock et al., 2008).
- c. The connectivity coefficient is related to the cluster homogeneity, typically assessed using intra-cluster variance. This relationship shows the position of the observational data, called the nearest neighbor, in a cluster. The connectivity coefficient is used to measure the density value. The connectivity value is between zero and ∞. A formed cluster is better when the value of the connectivity coefficient is lower (Brock et al., 2008).
Results and Discussion
Descriptive Statistics
In general, the data distribution of the nine indicators showed many outliers. Figure 2 presents a grid diagram of the infrastructure indicators consisting of the nine research variables. All nine variables had extreme outliers. These outliers show that infrastructure indicators in some regions are still important. In the regional characteristics indicator, the diversity of each variable was roughly the same, except for the variables X4(number of villages with 'other' roads) and X9 (number of telephone user households), whose diversity was slightly narrower than the other variables. In this case, the outliers were always included in the next analysis because the clustering method used (CLARA) is robust against outliers, so the presence of outliers will not affect the result.
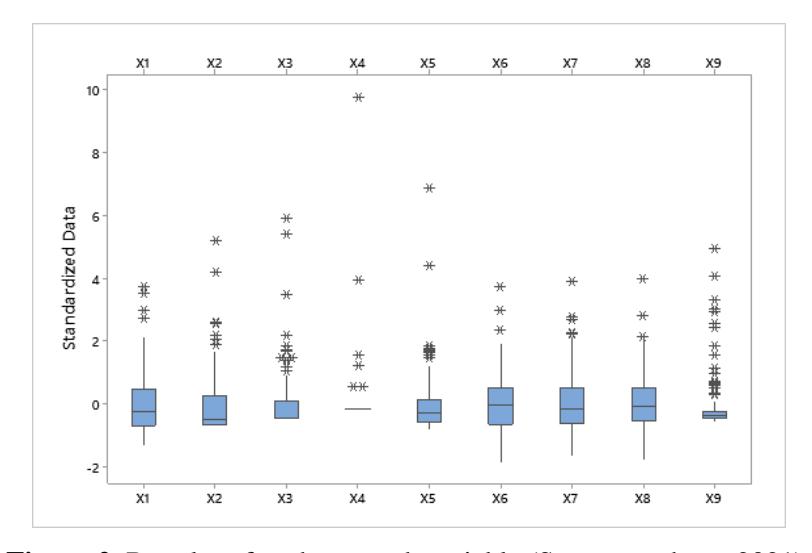
Figure 2. Boxplot of each research variable (Source: authors, 2021).
In addition, Table 2 provides descriptive statistics on the varying state of road infrastructure (X1-X4) in Java, Indoesia.
Table 2. Descriptive Statistics of Road Infrastructure Condition Variables (X1-X4)
| Minimum | Maximum | ||||||
|---|---|---|---|---|---|---|---|
| Variable | Mean | Variance | Value | Regency/City | Value | Regency/City | |
| Asphalt/ concrete roads (X1) | 3,326.50 | 6,715,380.66 | 12,950 | Semarang City | 0 | Kep. Seribu Regency | |
| Paved roads (X2) | 257.64 | 150,868.16 | 2,268 | Ngawi Regency | 0 | 34 area | |
| Dirt roads (X3) | 13.01 | 885.03 | 189 | Ngawi Regency | 0 | 77 area | |
| Other roads (X4) | 0.45 | 8.56 | 29 | Sumenep Regency | 0 | 113 area | |
Based on Table 2, the following is an explanation of each of these variables:
- a. Descriptive statistics of the Asphalt/concrete roads variable (X1) The average value of the Asphalt/concrete roads variable (X1) was 3,326.504, or 3,327 villages had asphalt or concrete roads with a variance of 6,715.381. The area of Semarang City in Central Java Province had the highest number of villages with paved roads, i.e., 12,950 villages. Meanwhile, Kepulauan Seribu Regency in the Capital Special Region of Jakarta Province had no villages with asphalt/concrete roads.
- b. Descriptive statistics of the Paved roads variable (X2) The average value of the Paved roads indicator (X2) was 257.638, or 258 villages had paved roads. Ngawi Regency in East Java Province had the highest number of villages with paved roads, while 34 regencies/cities had no villages with paved roads.
- c. Descriptive statistics of the Dirt roads variable (X3) Ngawi Regency also had the highest number of villages with dirt roads (X3). Meanwhile, 77 regencies/cities had no villages with dirt roads.
- d. Descriptive statistics of the Other roads variable (X4) Sumenep Regency in East Java Province had the highest number of villages with 'Other' roads (X4), namely 29 villages. The remaining 113 regencies/cities out of 119 regencies/cities did not have villages with 'other' roads.
In addition to the descriptive statistics on road conditions in areas on Java Island, Table 3 presents descriptive statistics on other infrastructure conditions, such as infrastructure for the education, health, technology, and economic sectors (X5-X9).
| Variable | Maan Vanianaa | Minimum | Maximum | |||
|---|---|---|---|---|---|---|
| Variable | Mean | Variance | Value | Regency/City | Value | Regency/City |
| Markets without building (X5) | 40.39 | 2810.39 | 404 | Tangrang Regency | 0 | Banjar City |
| Health facilities (X6) | 2,308.06 | 1,554,035.85 | 6,932 | Bogor Regency | 47 | Kep. Seribu Regency |
| Health workers (X7) | 694.57 | 166,560.82 | 2,288 | Surabaya City | 44 | Kep. Seribu Regency |
| Basic education facilities (X8) | 715.03 | 162,403.08 | 2,310 | Bogor Regency | 15 | Kep. Seribu Regency |
| Telephone\nuser households (X9) | 24,022.49 | 2,162,469,751.12 | 253,308 | North Jakarta City | 0 | Kep. Seribu Regency |
Table 3. Descriptive Statistics of Each Research Variable on Infrastructure Conditions of Various Sectors
The following is an explanation of Table 3, which contains descriptive statistics of each variable that reflects the state of the infrastructure for various sectors on Java \((X_5-X_9)\).
- a. Descriptive statistics of the Markets without buildings variable (X<sub>5</sub>) Tangerang Regency, Banten Province, had the largest number of villages with markets without buildings (X<sub>5</sub>), namely, 404 villages in Tangerang Regency. Meanwhile, the town of Banjar in the province of West Java is an area that has no markets without building.
- b. Descriptive statistics of the Health facilities variable (X<sub>6</sub>) The sixth indicator is Health facilities (X<sub>6</sub>). The average number of health facilities in Java was 2,308,058, or 2,309 units, with the Bogor Regency in West Java Province had the most health facilities in Java, i.e., 6,932 units. The regency of Kepulauan Seribu had the fewest health establishments, i.e., only 47 health facilities.
- c. Descriptive statistics of the Health workers variable (X<sub>7</sub>) The average number of health workers (X<sub>7</sub>) in Java was 694.57, or 695 people. Surabaya City in East Java province had the highest number of health workers, i.e., 2,288, while Kepulauan Seribu Regency had the lowest number of health workers, i.e., only 44, which is logical given that this region also had the fewest health facilities.
- d. Descriptive statistics of the Basic education facilities variable \((X_8)\) Bogor Regency had the largest number of basic education institutions \((X_8)\), namely 2,310 units.
- e. Descriptive statistics of the Telephone user households variable (X<sub>9</sub>) In terms of the indicator of households using a telephone (X<sub>9</sub>), two areas of the Capital Special Region of Jakarta Province stood out. The city of North Jakarta had the highest number of households using the telephone in Java. Meanwhile, another area in the Capital Special Region of Jakarta Province had the lowest number of households using
Gap Statistics Value Validation
The purpose of gap statistics is to determine the number of clusters, i.e., to determine the optimal value of k. The criterion of the optimal number of clusters is given by the statistical deviation value that is the highest or the first to indicate a minimal increase in deviation while the deviation is still increasing (Yang et al., 2019). The results of the validation are shown in Figure 3.
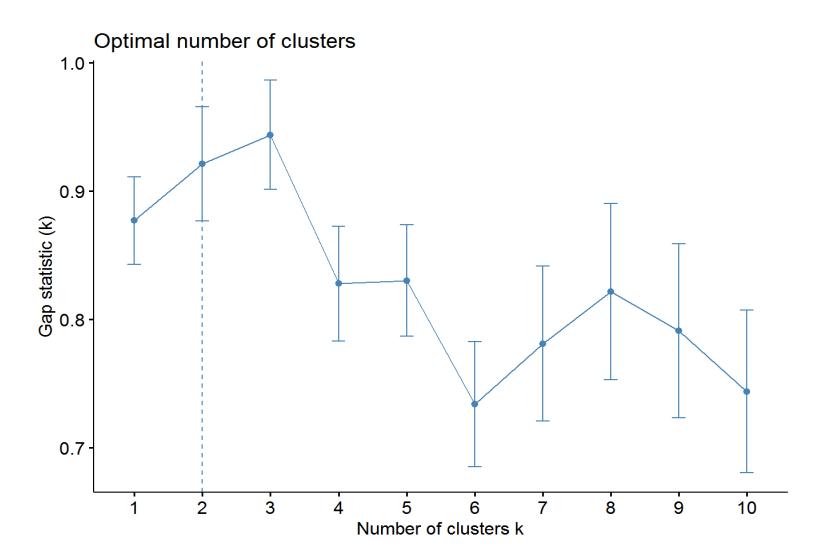
Figure 3. Graph of gap statistics value for number of clusters k (Source: authors, 2021)
Figure 3 shows an example of finding the optimal value of k with a statistical deviation approach. From these results, the recommended value of k is k = 3, which has the highest deviation value compared to the other cluster points. Therefore, the recommended number of clusters from both methods is 3.
Selecting the best clustering method
Before determining the most optimal cluster method, the next step in this research consisted of clustering with the K-Means, K-Medoids, and CLARA methods using the optimal value of k based on the statistical validation of the gap statistics. The results of clustering for each method with k = 3 are shown in Figure 4 below.
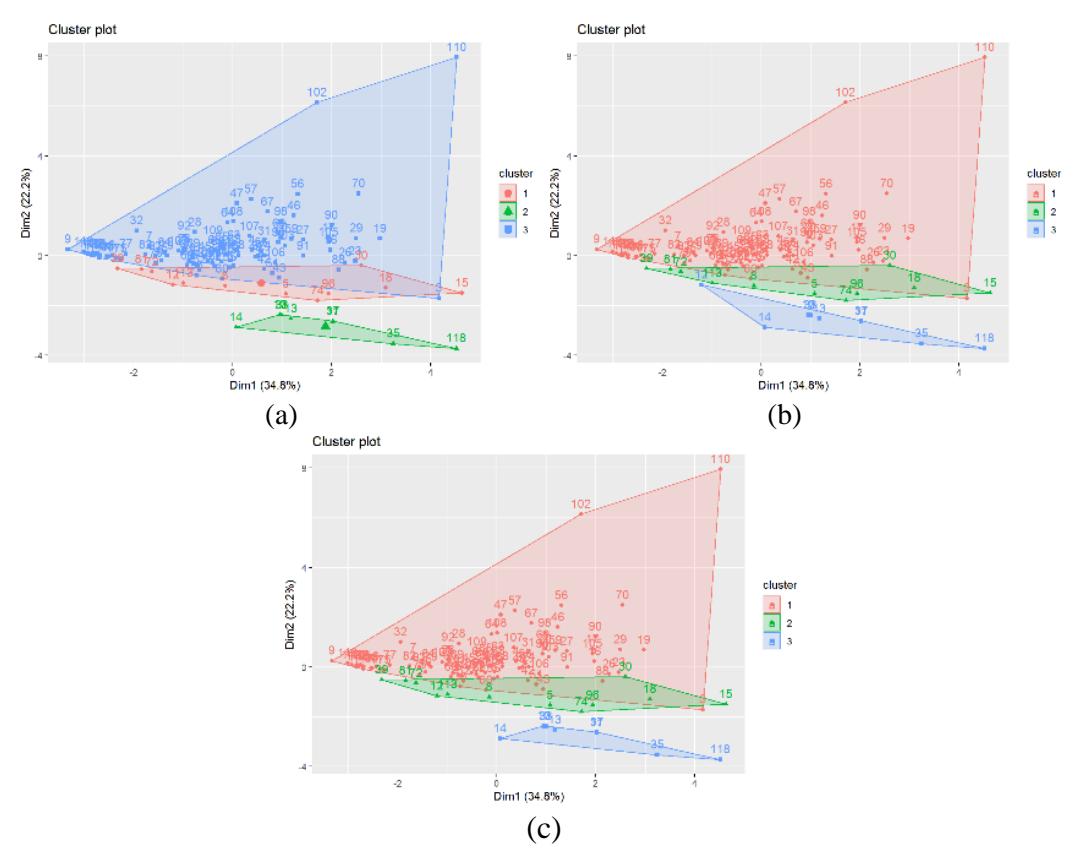
Figure 4. Cluster plot using the K-Means (a) K-Medoids (b) and CLARA methods (c) (Source: authors, 2021)
Based on the three graphs in Figure 4, the results of K-Means clustering led to twelve regencies/cities as members of cluster 1, while eight regencies and cities were members of cluster 2, and 99 regencies/cities were members of cluster 3. Meanwhile, the results of K-medoids clustering showed that 99 regencies/cities were members of the first cluster, the second cluster had 11 regencies/cities as members, and nine regencies/cities were members of the third cluster. The results of clustering using CLARA clustering resulted in 99 regencies/cities that were members of cluster one, while 12 regencies/cities were members of cluster two, and eight regencies/cities were members of cluster three.
After clustering with the K-Means, K-Medoids, and CLARA methods, the next step was to determine the best clustering method by performing a validation test, or cluster evaluation. This study used internal cluster evaluation because the data used was unlabeled, where the quality of a cluster is determined based on internal information in the data. Three evaluation indicators were used, namely the connectivity coefficient, Dunn's index, and the silhouette coefficient (Manchanda et al., 2020). The three indicators respectively reflect the cohesion, connectivity, and separation of the clusters to determine the best clustering method (Ohan Uba et al., 2021). Each evaluation indicator has a threshold value. A formed cluster will be classified as 'good' if the resulting value of the silhouette coefficient is close to 1 (Al Azzie's, 2021). Meanwhile, for the value of Dunn's index, a formed cluster is better when its Dunn's index value is higher than that of the other formed clusters (Brock et al., 2008). Then, based on the connectivity
coefficient, a formed cluster is better when the value of the connectivity coefficient is lower, where the value is between zero and ∞ (Landin et al., 2021). The results of the cluster assessment can be seen in Table 4.
Table 4. Results of Comparison of Internal Evaluations Based on Methods
| Method | Connectivity | Silhouette Width | Dunn Index |
|---|---|---|---|
| K-means clustering | 11.8710 | 0.8423*) | 0.0915 |
| K-medoids clustering | 8.1187 | 0.7971 | 0.0841 |
| CLARA clustering | 7.4794*) | 0.8063 | 0.1042*) |
Note: *) = best cluster method
The table shows the validation results for the clusters of regencies/cities on the island of Java using the K-Means, K-Medoids, and CLARA methods. The best clustering methods according to the three validations were:
- a. Silhouette coefficient validation The maximum valid value, or the value closest to 1, was obtained by the K-Means method, i.e., 0.8423. This indicator assesses the homogeneity of the clustering, usually by examining intra-cluster variance.
- b. Connectivity coefficient validation The lowest validation value obtained by the criteria of this indicator threshold was obtained by CLARA's method, i.e., 7.4794. This metric represents the extent to which observations are placed in the same cluster as the nearest neighbor.
- c. Dunn's index validation The highest validation value for Dunn's index was obtained by the CLARA method, i.e., 0.1042. This indicator measures the degree of separation between clusters by measuring the distance between the centroids of the clusters.
Based on the evaluation of the selection of the cluster method with three evaluation indicators, namely connectivity coefficient, Dunn's index and silhouette coefficients, it can be concluded that the best results for clustering based on infrastructure data to identify underdeveloped areas on Java Island were obtained by the CLARA method for three clusters (k = 3), because it had the best value for two of the three validation indexes used. Besides this, CLARA can also be recommended because of the reliability of this method. CLARA is a development of the K-Medoids clustering method, which has the particularity of being excellent at handling data sets that contain a large number of objects, as the data set used in this research. Another unique characteristic is that CLARA is not sensitive to outlier data, many of which were contained in the data set in this study, as shown in Figure 1. Furthermore, the step to determine the medoid with the CLARA method uses sampling on the results of cluster evaluation with the Dunn index indicator, which is very efficient in the computational process. Additionally, the connectivity indicator is used to represent the extent to which observations are placed in the same cluster as the nearest neighbor. The CLARA method is very good at separating each
observation in a certain group of clusters and excluding outlier values or data from a cluster. In other words, outliers entering a cluster is highly minimized.
Regency/city clustering using the best method
Based on the validation criteria, the best clustering method was CLARA. Thus, we further explored the clustering results obtained by CLARA. Based on the Regulation of the Ministry of Villages, Development of Disadvantaged Regions, and Transmigration Nr. 3 of 2016, Article 17, every indicator set by KNPDT has two lagging directions, i.e., positive and negative. An indicator with a positive lagging direction means that the higher the value of the indicator, the worse the condition of the area and the more it is lagging behind. An indicator with a negative lagging direction means that the lower the indicator's value, the worse the condition of the area and the more it is lagging behind. Table 5 presents descriptive statistics (averages) of the infrastructure indicators for each cluster and the direction of the lagging.
Table 5. Descriptive Statistics (Averages) of Infrastructure Indicators for Each Cluster
| Indicator | Lagging Direction | Cluster 1 | Cluster 2 | Cluster 3 |
|---|---|---|---|---|
| Asphalt/concrete roads (X1) | Negative | 3015.79*) | 4086.33 | 6031.88 |
| Paved roads (X2) | Positive | 303.80*) | 48.58 | 0.00 |
| Dirt roads (X3) | Positive | 15.13*) | 4.17 | 0.00 |
| Other roads (X4) | Negative | 0.55 | 0.00*) | 0.00*) |
| Markets without building (X5) | Positive | 36.23 | 59.33 | 63.38*) |
| Health facilities (X6) | Negative | 2,209.68*) | 2,774.00 | 2,826.63 |
| Health workers (X7) | Negative | 600.46*) | 920.83 | 1,519,75 |
| Basic education facilities (X8) | Negative | 713.33 | 711.92*) | 740.63 |
| Telephone user households (X9) | Negative | 6,962.25*) | 62,025.25 | 178,138.75 |
Note: *) = potentially lagging
Based on the results of the CLARA clustering method in Table 5, the following is an explanation of each infrastructure indicator:
a. Asphalt/concrete roads indicator (X1)
This indicator has a negative lagging direction. This means that the fewer villages there were with asphalt/concrete roads in an area, the poorer the state of the infrastructure in that regency/city. Cluster 1 had an average number of asphalt/concrete roads of 3,015.79, or 3,016 villages, which was the lowest number compared to the other clusters. Thus, the members of cluster 1 are potentially very underdeveloped areas according to the Asphalt/concrete roads indicator (X1).
b. Paved roads indicator (X2)
The Paved roads indicator (X2) has a positive lagging direction. Therefore, the more villages there were with paved roads in an area, the poorer the state of the infrastructure in that regency/city. Cluster 1 had an average of 303.80, or 304 villages with paved roads, which was higher than for the other clusters.
c. Dirt roads indicator (X3)
The direction of lagging of the Dirt roads indicator (X3) is positive. This means that the larger the number of villages that have dirt roads in an area, the worse the state of the infrastructure in that regency/city. Cluster 1 had an average number of villages with dirt roads of 15,130, or 15 villages, which was the highest number compared to the other clusters.
d. Other roads indicator (X4)
The fewer villages that have 'Other' roads, the poorer the state of the infrastructure in regency/city, because this indicator has a negative lagging direction. Clusters 2 and 3 had an average number of 'Other' roads of zero. Cluster 1 is potentially a very underdeveloped area in terms of this indicator.
e. Markets without building indicator (X5)
The Markets without building indicator (X5) has a positive lagging direction. Therefore, the higher the number of villages who have a market without building, the worse the state of the infrastructure in that regency/city. Cluster 3 had an average number of 63.38, or 64 villages that had a market without building, which was the highest number compared to the other clusters. Thus, cluster 3 is potentially a very underdeveloped area according to this indicator.
f. Health facilities indicator (X6)
With a negative lagging direction, the fewer health facilities an area has, the poorer the state of the infrastructure in that regency/city. Cluster 1 had an average number of health facilities of 2,209.68, or 2,210 units, which was the lowest number compared to the other clusters. Thus, cluster 1 is potentially an underdeveloped area according to this indicator.
g. Health workers indicator (X7)
The Health workers indicator has a negative lagging direction. Therefore, the lower the number of health workers in an area, the poorer the state of the infrastructure in that regency/city. Cluster 1 had an average number of 600.46 health workers, or 601 people, which was the lowest number compared to the other clusters.
h. Basic education facilities indicator (X8)
The lagging direction of the Basic education facilities indicator is negative. Therefore, the fewer basic education facilities an area has, the poorer the state of the infrastructure in the regency/city. Cluster 2 had an average number of Basic education facilities of 711.92, or 712 units, which was the lowest number compared to the other clusters.
i. Telephone user households indicator (X9)
The Telephone user households indicator has a negative lagging direction. Consequently, the lower the number of telephone user households in an area, the worse the state of the infrastructure of that regency/city. Group 1 had an average number of phone user households of 6,962.25, or 6,963 households, which was the lowest number compared to the other groups. Thus, cluster 1 has a strong potential to be an underdeveloped area.
Table 6. Members (Regencies/Cities) of Each Group from Underdeveloped, Developing to Developed
| Cluster | Members of each cluster (regency/city) | ||||
|---|---|---|---|---|---|
| Bandung Barat | Jombang | Tegal City | Purbalingga | ||
| Bangkalan | Karanganyar | Kudus | Purwakarta | ||
| Banjarnegara | Karawang | Kulon Progo | Purworejo | ||
| Bantul | Kebumen | Kuningan | Rembang | ||
| Banyumas | Kediri | Lamongan | Sampang | ||
| Banyuwangi | Kendal | Lebak | Semarang | ||
| Batang | Kepulauan Seribu | Lumajang | Serang | ||
| Blitar | Klaten | Madiun | Situbondo | ||
| Blora | Banjar City | Magelang | Sleman | ||
| Bojonegoro | Batu City | Magetan | Sragen | ||
| Bondowoso | Blitar City | Majalengka | Subang | ||
| Underdevelope | Boyolali | Bogor City | Malang | Sukabumi | |
| d | Brebes | Cilegon City | Mojokerto | Sukoharjo | |
| (Cluster 1) | Ciamis | Cirebon City Nganjuk | Sumedang | ||
| Cianjur | Kediri City Ngawi | Sumenep | |||
| Cilacap | Madiun City | Pacitan | Tangerang | ||
| Cirebon | Magelang City | Pamekasan | Tasikmalaya | ||
| Demak | Mojokerto City | Pandeglang | Tegal | ||
| Garut | Pasuruan City | Pangandaran | Temanggung | ||
| Gresik | Pekalongan City | Pasuruan | Trenggalek | ||
| Grobogan | Probolinggo City | Pati | Tuban | ||
| Gunung Kidul | Salatiga City | Pekalongan | Tulungagung | ||
| Indramayu | Serang City | Pemalang | Wonogiri | ||
| Jember | Sukabumi City | Ponorogo | Wonosobo | ||
| Jepara | Tasikmalaya City | Probolinggo | |||
| Central Jakarta | Tangerang Selatan | ||||
| Developing | Bandung | City | Semarang City | City | |
| Bekasi | Cimahi City | Surakarta City | Yogyakarta City | ||
| (Cluster 2) | Tangerang | ||||
| Bogor | Malang City | City | Sidoarjo | ||
| West Jakarta City | East Jakarta City | Bandung City | Depok City | ||
| Developed | South Jakarta | ||||
| (Cluster 3) | City | North Jakarta City | Bekasi City | Surabaya City | |
Based on Table 5, it can be seen that the members of clusters 1 had the potential to be lagging behind according to all six indicators. Clusters 2 and 3 had the potential to be lagging behind according to two indicators each. The order of the clusters in development (underdeveloped, developing, and developed) is as follows: cluster 1, cluster 2, and cluster 3. Table 6 lists the members of each group from underdeveloped, developing to developed.
In Table 6, it can be seen that 99 regencies/cities were included in the cluster of areas with an underdeveloped infrastructure, while 12 regencies/cities were included in the cluster of areas with a developing infrastructure, and 8 regencies/cities were included in the cluster of areas with a developed infrastructure. The latter cluster consists of four
cities of the Capital Special Region of Jakarta Province (West Jakarta, East Jakarta, South Jakarta, and North Jakarta), three regions of West Java (Bandung City, Depok City, and Bekasi City) and one region of East Java, namely Surabaya City. The underdeveloped, developing, and developed areas are mapped in Figure 5.
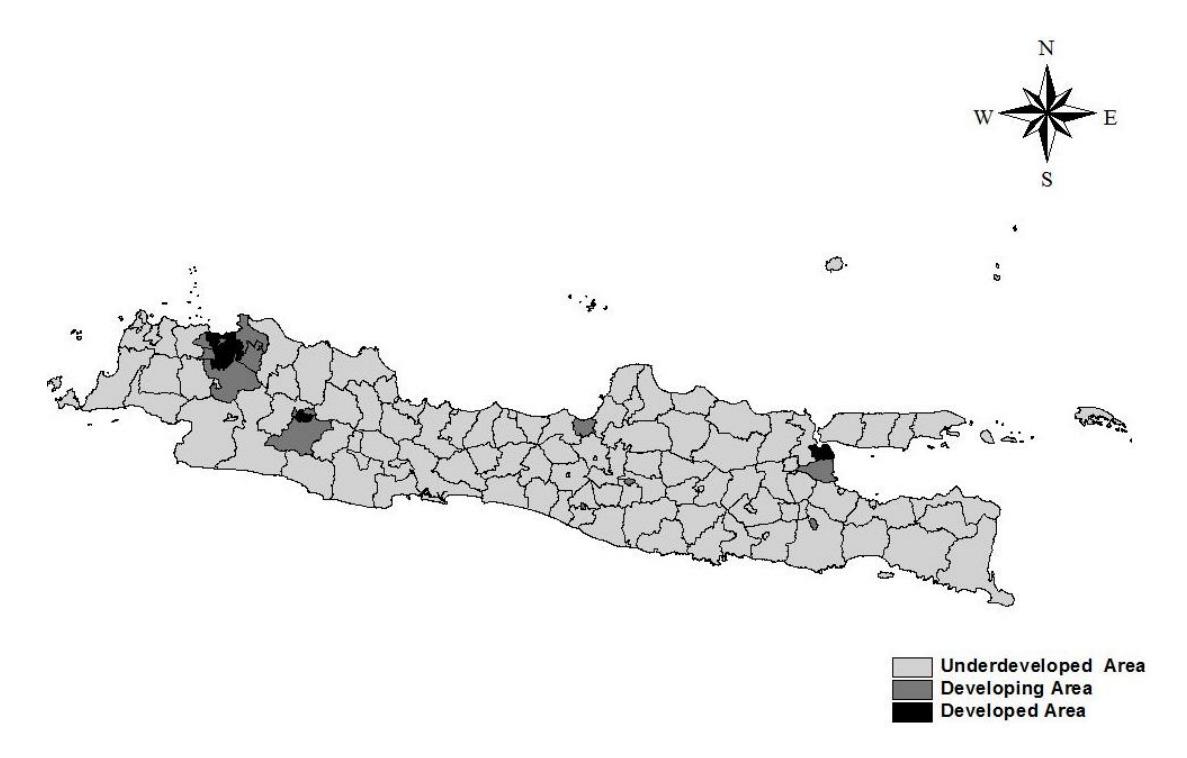
Figure 5. Mapping of development levels on Java Island based on clustered infrastructure indicators. (Source: authors, 2021)
The results for four of the infrastructure indicators (asphalt/concrete roads, markets without building, health facilities, and basic educational institutions) in this study were consistent with the previous research by Otok et al. (2021) on infrastructure in underdeveloped areas of the island of Java, which suggests that the underdevelopment of regional infrastructure on the island of Java is influenced by the accessibility dimension, which includes the average road distance to the regency/city as well as access to health services. The research concept used in Otok et al. (2021) was modeling with the Meta-Analytical Structural Equation Modeling (MASEM) approach using generalized least squares (GLS).
Conclusion
Based on unsupervised learning with a partitional clustering approach to identify underdeveloped areas based on infrastructure metrics, the best clustering results were obtained using the CLARA clustering method because it produced the best values for both the connectivity coefficient and Dunn's index. The result of determining underdeveloped areas on the island of Java from clustering using CLARA was that 99 regencies/cities were underdeveloped areas in terms of infrastructure, while 12 regencies/cities were developing areas, and 8 regencies/cities were areas with an advanced infrastructure. The characteristics of the areas designated as underdeveloped that need to be improved to keep them from lagging behind are:
Cluster 1 – Repairs to asphalt/concrete roads, paved roads, dirt roads, and improvement of the numbers of health facilities, health workers, and phone user households.
Cluster 2 – Improvements for areas without road access and more basic education facilities.
Cluster 3 – Improvements for areas without road access and more markets with building.
With these results, it is hoped that the central government and local governments of the six provinces of Java will focus more on formulating policies to improve infrastructure development in areas designated as underdeveloped areas based on the characteristics of each region. To gain a deeper understanding, other researchers could develop a more detailed conceptual framework that includes other infrastructural variables defined by the Ministry of Villages, Development of Disadvantaged Regions, and Transmigration. In addition, future research could make comparisons with other clustering methods, given the wide range of available cluster analysis methods, which could be further developed by applying them to other relevant fields.