
Introduction
Urbanization is often associated with disparities because it differentiates cities and rural areas. Moreover, while a city's economic growth rate continues to increase, income disparities and urbanization along with rapid development are seen as direct causes of disparities (Bank of Thailand, 2020). This has been noticed in the case of China's urbanization, where the urban-rural income disparity reaches more than 43 percent. The Global Inequalities Survey reports that global inequality is also increasing. This is reflected in the fact that 1% of the world's wealthiest people own more than 45% of global assets (Oxfam, 2018). When considering Asian countries, they are in a critical condition related to inequality. As the population is growing more wealthy, Thailand similarly finds its inequality level to be significantly correlated with the urbanization rate (Iamtrakul et al., 2021). This is due to the characterization of Bangkok, including surrounding areas, as the primate city of Thailand, which has been urbanized with a high concentration of development compared to the other provinces (Iamtrakul et al., 2018a; Iamtrakul & Chayphong, 2021).
In addition to being an economic center, Bangkok is also a social, political, and cultural center (e.g., housing leading educational institutions with academic strength and hospitals with competent medical personnel and complete medical equipment). However, urbanization increases the disparity between urban and rural areas, resulting in significant concentration in urban areas. This plays a key role in contributing to socioeconomic and physical inequalities, especially in cities with large populations. At present, Bangkok provides a variety of transportation choices through its public transport system, which includes the BTS SkyTrain (BTS) (started in 1999), the MRT (underground railway) (started in 2004), the Airport Rail Link (started in 2010), the bus system of the Bangkok Mass Transit Organization (BMTA), and the Chao Phraya Express Boats, supporting daily commuter traffic in the city (Iamtrakul et al., 2022a). However, traffic volumes in Bangkok and its surrounding areas tend to increase according to the Transport and Traffic Information Technology Center (million trips per day), as depicted in Figure 1 (Office of Transport and Traffic Policy and Planning, 2020). Transport is an essential facilitator of social inclusion. However, according to the statistics, only 31% of the Thai population are active users of public transport. Therefore, Bangkok is still ranked as the world's top traffic congestion city. To achieve the goals of solving the traffic problem and supporting sustainable urban development, it is necessary to explore the correlation between transport and inequalities in Bangkok and its surrounding areas based on exploring the relationship between transport and land use (Iamtrakul & Klaylee, 2021). Since urban expansion occurs in different urban patterns, it provides the key to explaining a variety of opportunities for daily activities (Iamtrakul et al., 2018b).
Appropriate interventions and recommendations should be varied by type of geographic area to create connectivity to public transport services. By categorizing the different district characteristics according to economic and social factors, the causes of inequality of access to the public transport network can be understood. This study attempted to apply geospatial analysis together with multivariate statistical cluster analysis methods to provide an essential guide for understanding the roots of the problems based on empirical evidence related to existing inequality of access to public transport. Consequently, a holistic approach of observing multidimensional
indicators among physical, social and economic perspectives can be used to represent both tangible and intangible dimensions of urban development.
Clustering allows us to group more suitable urban development patterns based on the significance of the obtained urbanization-related dimensions. Significant clusters can be used to explain different features among a variety of urban clusters regarding the characteristics of inequality in terms of the level of accessibility. With this analytical framework, differences in the spatial distribution of accessibility can be quantitatively measured. Geographical accessibility in a different context of urban patterns can enrich our knowledge of urban planning to enhance the equality of accessibility for both residents and commuters (Haider & Iamtrakul, 2022). Furthermore, by realizing the explicit configuration of the diverse levels of accessibility, measures to shift the mode of travel toward more public transport can be recommended in parallel to urban development to accommodate a move toward a more inclusive city. This will lead to a reduction of the disparities in the choice of travel mode and to sustainable urban development.
Literature review
Much of the literature does not explicitly explore spatialized inequality but proposes mechanisms and measures of inequality, e.g., social disadvantage, accessibility, poverty, and social exclusion (Shivonne et al., 2019). Inequality often refers to the inequality between those who have opportunities and those who lack opportunities (Church et al., 2007). Access opportunities represent an approach to negotiating and managing resources in a society that sometimes is itself a cause of inequality, where inequality causes unfairness or some individuals are originally 'unequal' (Cooper et al., 2019). The development of a city is perceived to improve the quality of life of its residents by creating opportunities (e.g., more jobs and job security, education resources, and quality health facilities). Moving towards safe, resilient, and equitable urban environments must inevitably be considered, in which mobility plays a vital role as both generating inequality and being an outcome of inequality. This must be considered in transportation planning in view of poverty reduction and providing greater access to social services and utilities that are essential in daily life (Yigitcanlar, 2010). However, inequality prospects for different groups of people and opportunities for urban and rural people to access quality primary public services show significant gaps, reducing access to several rights, which reflects the structural problem of inequality in any society (Iamtrakul et al., 2018b). This problem has led most of the country's population to suffer from economic growth inequality and resource ownership disparities, resulting in significant differences in income between various groups in society (Iamtrakul et al., 2022b). Inequality of access opportunities relates to essential resources and rights, including inequality in bargaining power (Currie, 2010). From Figure 1, the inaccessibility of public transportation is a part of social exclusion resulting from transport disadvantages, which include vehicle ownership, travel service, information for travel and safety in travel, and social aspects. The disadvantages under consideration come from social constraints, i.e., income level, employment, housing characteristics, and health risks, which in turn affect access to the transportation system, as shown in Figure 2.
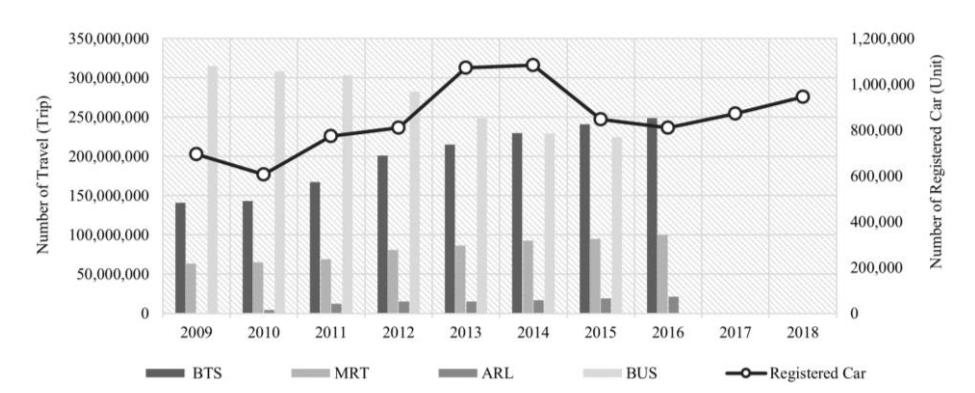
Figure 1. Number of registered vehicles and number of public transport trips in Bangkok. (Source: Department of Land Transport, 2019)
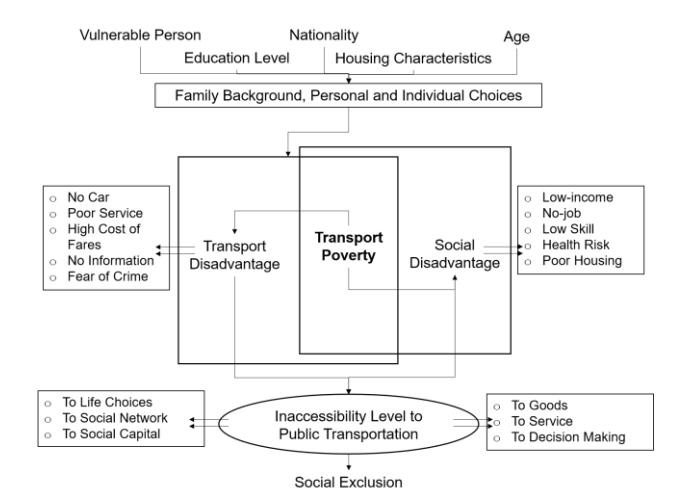
Figure 2. Mechanisms and measures of inequality. (Source: authors)
Elements of inequality
Several dimensions of inequality (e.g., related to income, housing, infrastructure, resources, education, and environment) affect the health and well-being of human beings. Therefore, this study divided inequality into three categories, as shown in Table 1. Among the three dimensions of inequality, the physical dimension is a fundamental factor among multiple dimensions, focusing on the level of access to opportunities in terms of essential resources. Traveling is one of the significant activities of people in commuting to infrastructure and services in the city. This is also known as the 'gateway of communication', which is an economic activity in any type of land-use pattern. In order to lay the foundation for systematic and sustainable urban development, consideration should be given to the overall equality of development in the city before considering individual details (Galor, 2011).
Indicators and assessment approach
The factors that determine the inequality of access to the network of transport systems can be divided into three groups: physical, social, and economic factors (social, economic and travel behavior). The physical factors are indicators that can be used to determine the pattern of physical disparities in terms of locational access in urban planning following the accessibility of travel patterns in the study area. Social-economic factors can be used to determine the level of accessibility and the range of affordability to travel patterns, convenience of access, and the ability to choose a mode of travel (Table 2). In addition, reviewing the indicators used in the data analysis, the selected approaches using both statistical and spatial analyses can determine the linkage between integrated data analysis and the results in each assessment category.
Table 1. Inequality in Each Dimension (Physical, Economic and Social)
| Dimensions | Inequality Concept |
|---|---|
| Physical |
|
| |
| • Spatial inequality pals an important role, as it can result from ethnic discrimination or economic failure (i.e., excessive migration) (Boadway & Flatters, 1982). | |
| |
| Economic | • Income inequality is a major social issue. Empirical observation shows income inequality in the market, which has increased exponentially as measured by the Gini coefficient (Stiglitz, 2013; Piketty, 2014; Milanovic, 2016). |
| • Barro (2000) and Halter et al. (2014) have reported that the growth of inequality correlations has been susceptible to the country's income level in different time periods (Panizza, 2002). | |
| Social | • Related to inequality in bargaining power, rights should be earned by the citizenship of the society (Kraay, 2015). |
Methodology
In this section, the network of transport systems is considered in terms of urban-level analysis to characterize the different districts in the study area along with the traveling conditions. By focusing on the areas of different districts obtained from a grouping analysis at the city level, a network analysis was performed to identify the relationships between each inequality factor and different district characteristics and travel patterns in the study area. The analysis results at this level provide an understanding of the effect of transport system development and network patterns. The following methods of analysis were used.
1) Factor analysis: the idea behind factor analysis is to reduce the number of variables in a study by grouping those that have a high degree of correlation to one another. This process is aimed at reducing redundancy and co-variance problems or multicollinearity between the variables to make the analysis more accurate. By considering the response variable, \(Y_{ij}\), for item j = 1, 2, ..., q from subject i = 1, 2, ..., n as a binarization around zero of a continuous but unobservable process \(Z_{ij}\), explained by m latent factors \(\theta_{il}\), ..., \(\theta_{im}\), the equation can be expressed as follows:
\[Z_{ij} = c_j + \sum_{k=1}^{m} a_{jk} \theta_{ki} + \epsilon_{ij}\] (1)
where \(\ell_{ij} \sim N(0, 1)\) and \(\{c_j\}\) are intercept param incorporated into the model, where high positive (negative) values for \(c_j\) increase (reduce) the probability of endorsing the j-th item and they also refer to an easiness parameter (Chalmers, R. P., 2015). The slopes \(\{a_{jk}\}\), commonly called discrimination param, indicate how well the j-th item can discriminate the k-th ability between the subjects under study. If \(a_{jk} = 0\), the k-th latent factor does not explain the variability of the j-th response item. In other words, this item does not help to discriminate the k-th latent ability between the subjects. In the composition analysis, the factors from Table 2 were used in the factorization analysis to reduce the duplication of factors that were input in the grouping analysis.
| References | ||||||||||
|---|---|---|---|---|---|---|---|---|---|---|
| Elements | Factors | Unit | Asfaw M., | Dandan | Allen | Schneider | Mohammad | Singleton, | Yalcin Y. | Megan H. |
| of Factors | & Hailu | L. et al., | et al., | R.J., 2013 | R., 2020 | 2013 | & Mahyar | & Debra L., | ||
| W., 2019 | 2020 | 2019 | A., 2021 | 2019 | ||||||
| Built-up area | km2 | √ | √ | |||||||
| Non built-up area | km2 | √ | √ | √ | ||||||
| Slope | percent | √ | √ | |||||||
| Physical | Elevation | meter | √ | √ | ||||||
| Water | km2 | √ | √ | √ | ||||||
| Green area | km2 | √ | √ | √ | ||||||
| Bare land | km2 | √ | √ | √ | ||||||
| Access to public | meter | √ | √ | √ | √ | √ | ||||
| transportation | ||||||||||
| Education level | level | √ | √ | √ | √ | |||||
| Population and | unit/area | √ | √ | √ | √ | √ | ||||
| employment | /km2 | |||||||||
| Access to industrial area | meter | √ | √ | √ | ||||||
| Social | Access to urban center | meter | √ | √ | ||||||
| Access to education | meter | √ | √ | |||||||
| Access to institutes | meter | √ | ||||||||
| Access to hospital | meter | √ | √ | |||||||
| Access to park/public space meter | √ | √ | ||||||||
| Access to pier | meter | √ | √ | |||||||
| Access to station | meter | √ | √ | √ | ||||||
| Land price | Baht/sq. | √ | √ | |||||||
| meter | ||||||||||
| Occupation | types | √ | √ | √ | √ | |||||
| Economic | Average income | baht | √ | √ | √ | √ | ||||
| Housing characteristics | types | √ | √ | √ | ||||||
| Travel behavior | type/ | √ | √ | |||||||
| group | ||||||||||
| Travel pattern | vehicles | √ | √ | |||||||
Table 2. Inequality Indicators for Assessment
- 2) Grouping analysis (spatial statistics): is a feature-based grouping analysis tool with optional spatial constraints. The result of this analysis are heterogeneous data groups, where the attributes of the groups are the most similar. This tool groups the results based on the number of groups specified, the analysis variables, and optional spatial constraints. Performing multiple iterations of the analysis helps to identify the optimal number of groups as well as a suitable combination of analysis variables (ESRI, 2022).
- 3) Space syntax analysis: is a powerful approach for analyzing road connections with the Space Syntax tool, which allows examining the interplay between spatial networks and social activities. It provides the potential for an evaluation in terms of the accessibility of a topological street segment from all other street segments within a defined area (e.g., a certain distance from the city center) (Hillier and Hanson, 1989). The analysis was conducted through different clusterings of urban patterns based on a global integration value (Rn) on the provincial level and a local integration value (R3) on the district level.
Among the three steps of the analysis, factor analysis is a critical initial step of factor verification. After that, cluster analysis leads to assessing the potential of the physical space to facilitate disparity in traveling. This was done to understand the linkage between physical and environmental factors that affect the form and direction of urban expansion, resulting in social inequality of access. The grouping of urban contexts into different clusters helps to understand and differentiate the dimensions of each cluster. The illustration of differences between clusters
allows us to understand the horizontal accessibility of the features to quantify the provision of spatial disparities in terms of transport infrastructure to ensure the equity required for each group within the same distribution. This is due to the influence of urbanization leading to different potentials of settlement of different migrations of people from rural areas to the city. Together with the different residential and employment needs, this results in the necessity of transportation planning that balances the urban growth in multiple dimensions.
Since each different cluster has its own transport infrastructure characteristics, i.e., whether it can accommodate the demand or balance the components of local mobility and land-use change or not. The availability of current techniques allows for a comprehensive evaluation to capture interaction between land use and transportation that could lead to long-term equity problems in transportation provision, both in terms of physical infrastructure and socio-economic needs among different urban contexts. Furthermore, by using space syntax analysis, the influence of the transport infrastructure based on spatial disparity requires an integration technique to provide a holistic view of physical, social, and economic aspects when analyzing accessibility patterns. In view of growing concerns about the consequences of equity problems in transportation, the need for more research exploring the link between transport and sustainability must be addressed. This research can be useful to ensure sustainability in future planning of the transportation system, where the identification of the relationship between both can help reveal the appropriate direction for policies and urban development plans.
Analysis and result
To analyze both statistical and spatial data of urban expansion patterns, urban physical factors were input into the analysis to group different characteristics of districts in Bangkok and Pathum Thani Province at the urban level. Pathum Thani Province is located north of Bangkok (the capital of Thailand), with the ratio between city area and total area greater than 42.30 percent, as depicted in Figure 3.
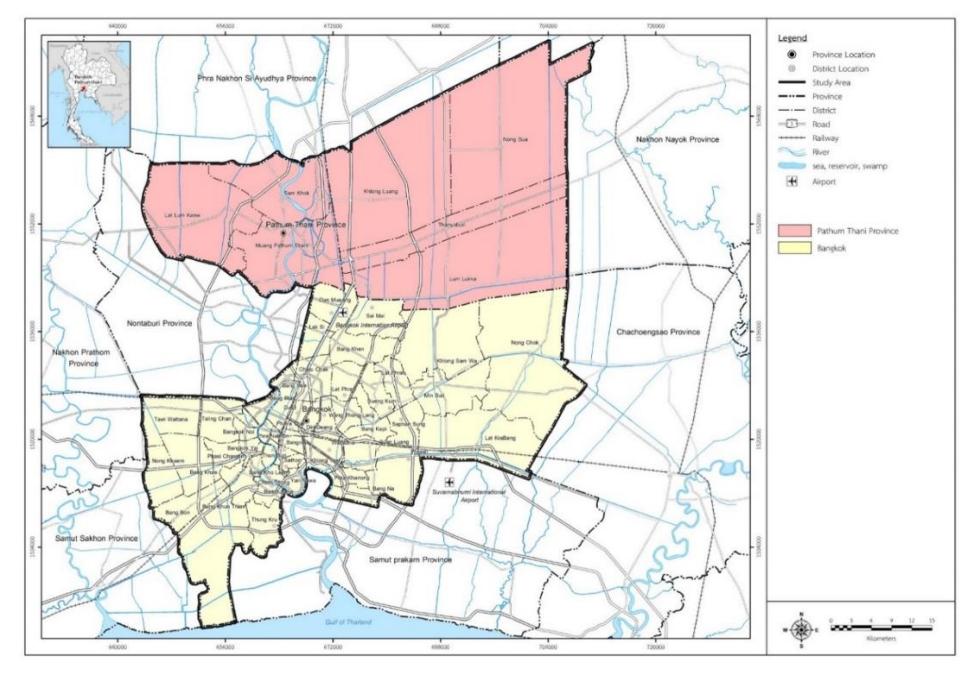
Figure 3. The study area: Bangkok Metropolitan Administration (BMA) and Pathum Thani Province in Bangkok Metropolitan Region (BMR) (Source: Authors)
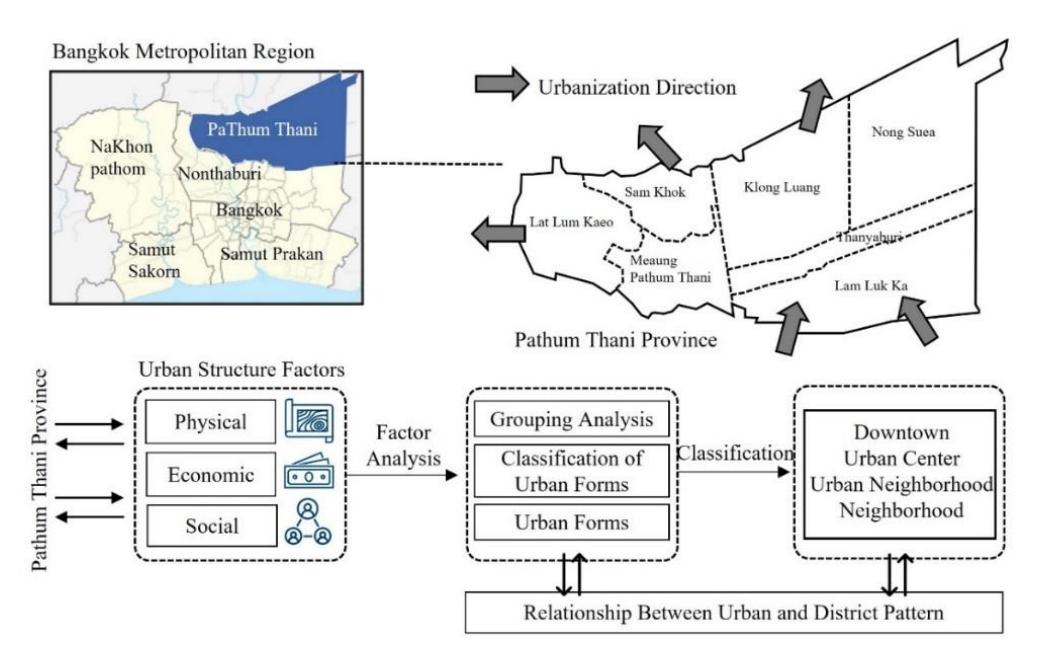
Figure 4. Study framework. (Source: authors)
The immigration rate in Pathum Thani Province is higher than in other provinces in the surrounding areas at +2.24, which represents the highest rate in the metropolitan area around Bangkok Metropolitan Region (BMR). When considering the case of suburban areas, Pathum Thani Province currently displays a rapid expansion of urban areas, leading to traffic congestion. This has been identified as the main problem in the suburban areas of Bangkok, which can be seen from the ratio between travel volume and road capacity (volume capacity ratio, VCR) during the morning rush hour with a value greater than 1.00. In this study, the disparities in transportation systems can be categorized into different typologies of districts according to economic and social factor analysis by considering the relationship between network analysis and district patterns. The analysis results in different levels as explained in the following section (Figure 4).
Typology of urban characterization by economic and social factors
District classification
District classification presents urban forms grouped by land-use characteristics, which are distinguished based on different physical factors. Factor analysis (FA) was employed as a statistical technique to identify a combination of physical, economic and social factors that may contribute to explaining the relationship between sets of variables. This analysis was employed to reduce the number of variables and create a specific model for the analysis in the next step. This study aimed to determine the factors that can explain the different characteristics of the urban context. This is because Bangkok's metropolitan area has different characteristics from the suburban area of Pathum Thani Province. Suburban areas with a sparser density mostly have detached houses for middle income groups and apartments in vertical development estates for lower income groups in close proximity to employment zones. This study attempted to classify district patterns between the capital city and suburban areas of Thailand, which can be divided according to urban center classification as follows: (1) downtown district, (2) urban center district, (3) urban neighborhood district, and (4) neighborhood district.
Spatial analysis and its statistical indicators
In terms of spatial analysis, three main contributing factors were employed for the analysis, namely physical, economic and social factors, as well as sub-factors, with a total of nineteen factors, as illustrated in Table 3. In this study, Bangkok and Pathumthani Province were grouped based on the spatial unit of analysis in terms of a grid of 1,000*1,000 m (a total of 3,008 grids). This is because the neighborhood clustering should be focused on a walking distance of 500 m. All factors were analyzed statistically, defining a set of variables in terms of mean value, standard deviation value and standard error mean value to determine the variability of the factors and the possibility of their analysis by factor analysis. All factors and sub-factors were input for analysis. The details of each factor are shown in Table 4.
Table 3. Definition of Input Factors for Analysis
| No 1 | Factors Road density | Definitions |
|---|---|---|
| The number of distances from roads in the area (buffers) in distances of 500 | ||
| m, 1,000 m and more than 1,000 m | ||
| 2 | Residential density | Analyze building density of residential type with Kernel Density function |
| 3 | Commercial density | Analyze building density of commercial type with Kernel Density function |
| 4 | Mixed-use density | Analyze building density of mix-use type with Kernel Density function |
| 5 | Institute density | Analyze building density of institute type with Kernel Density function |
| 6 | Industry density | Analyze building densities of industry and warehouse types with Kernel |
| Density function | ||
| 7 | Access to main roads | Analyze access to main roads (buffer) in Bangkok and Pathumthani province within 1,000 m, 2,000 m and more than 2,000 m |
| 8 | Access to station | Analyze access to stations (buffer) in Bangkok and Pathumthani province within 1,000 m, 2,000 m and more than 2,000 m |
| 9 | Land price | Land price area by district (baht/m2) |
| 10 | Population density | Population density in Bangkok and Pathumthani province |
| 11 | Employment density | Employment density in study area |
| 12 | Access to industry area | Analyzing access to industrial areas (buffer) in Bangkok and Pathumthani province within 500 m, 2,000 m and more than 2,000 m |
| 13 | Access to urban center area | Analyzing access to urban areas (buffer) in Bangkok and Pathumthani province within 3,000 m, 5,000 m and more than 5,000 m |
| 14 | Access to education area | Analyzing access to educational institutions (buffer) in Bangkok and Pathumthani province within 500 m, 2,000 m and more than 2,000 m |
| 15 | Access to institute area | Analyzing access to government offices (buffer) in Bangkok and Pathumthani province within 500 m, 2,000 m and more than 2,000 m |
| 16 | Access to health care area | Analyzing access to hospitals (buffer) in Bangkok and Pathumthani province |
| within 500 m, 2,000 m and more than 2,000 m | ||
| 17 | Access to park/public space | Analyze access to public parks (buffer) in Bangkok and Pathumthani province |
| within 500 m, 2,000 m and more than 2,000 m | ||
| 18 | Access to pier | Analyze accessibility to piers (buffer) in Bangkok and Pathumthani province |
| within 500 m, 2,000 m and more than 2,000 m | ||
| 19 | Access to train station | Analyze accessibility to railway stations (buffer) in Bangkok and |
| Pathumthani province with 500 m, 2,000 m and more than 2,000 m |
Grouping analysis
Then, all factors were input and spatially analyzed by factor analysis; the new factors were used by the union analysis method in all grids of 1,000*1,000 m (Figure 5). Based on the analysis of the grouping among different districts in this step, the result of the analysis process provided the statistical values for all variables. The analyzed variables were grouped by using grouping based on geospatial analysis, as shown in Table 5. The physical factor that affects accessibility the most is road density, and the most negligible factor is the density of government offices. The economic agglomeration depends mainly on population density, employment, and social factors regarding accessibility to public infrastructures and services (e.g., industrial areas, city centers, educational centers, institutions, and parks).
Table 4. Statistical Analysis of Main Contributing Factors for District Classification
| Factors | Unit | Mean | Std. Deviation | Std. Mean | Error | ||
|---|---|---|---|---|---|---|---|
| 1 | Road density | area/m2 | 18.48 | 36.69 | 2.64 | ||
| 2 | Residential density | area/m2 | 393.68 | 518.49 | 87.64 | ||
| 3 | Commercial density | area/m2 | 165.08 | 53.82 | 9.10 | ||
| Physical | 4 | Mix-use density | area/m2 | 30.29 | 25.09 | 4.24 | |
| 5 | Institutes density | area/m2 | 15.91 | 22.34 | 3.78 | ||
| 6 | Industry density | area/m2 | 18.80 | 7.22 | 1.22 | ||
| 7 | Access to main roads | meter | 10,113.16 | 1924.60 | 33.46 | ||
| 8 | Access to station | meter | 41,06.98 | 6169.55 | 107.25 | ||
| 9 | Land price | baht/m2 | 37,803.57 | 21304.27 | 370.36 | ||
| Economic | 10 | Population density | person | 7,061.95 | 7,156.59 | 124.41 | |
| 11 | Employment density | person | 157.07 | 86.77 | 14.67 | ||
| 12 | Access to industry | meter | 290.27 | 420.28 | 7.31 | ||
| 13 | Access to urban center | meter | 71.03 | 20.50 | 3.47 | ||
| 14 | Access to education | meter | 20.64 | 47.01 | 0.82 | ||
| 15 | Access to institute area | meter | 88.37 | 18.69 | 3.16 | ||
| 16 | Access to health care | meter | 7,061.95 | 7,156.59 | 124.41 | ||
| 17 | Access to park/public spaces | area/m2 | 95.00 | 18.45 | 3.12 | ||
| Social | 18 | Access to pier | person/m2 | 4.44 | 4.75 | 0.08 | |
| 19 | Access to train station | Baht | 4.21 | 4.35 | 0.08 |
Table 5. Definition of Input Factors for Analysis
| Test Value = 3,308 | ||||||||||
|---|---|---|---|---|---|---|---|---|---|---|
| Variables | t | df | Sig. | Mean | 95% Confidence Interval of the Difference | |||||
| Difference | Lower | Upper | ||||||||
| 1. | Road density | 3,124.11 | 3308 | 0.00 | 24,589.220 | 15,847.230 | 32,145.180 | |||
| 2. | Residential density | 8.323 | 3308 | 0.00 | 122.071 | 92.264 | 151.878 | |||
| 3. | Commercial density | 5.345 | 3308 | 0.00 | 28.009 | 17.360 | 38.658 | |||
| Physical | 4. | Mixed-use density | 13.191 | 3308 | 0.00 | 26.631 | 30.734 | 22.528 | ||
| 5. | Institute density | 0.149 | 3308 | 0.00 | 0.840 | 12.296 | 10.616 | |||
| 6. | Industry density | 13.27 | 3308 | 0.00 | 34.112 | 34.270 | 33.954 | |||
| 7. | Access to main roads | 39.729 | 3308 | 0.00 | 10,113.161 | 10,047.560 | 10,178.760 | |||
| 8. | Access to station | 10.63 | 3308 | 0.00 | 33.315 | 31.490 | 35.140 | |||
| 9. | Land price | 12.088 | 3308 | 0.00 | 16.200 | 18.681 | 13.719 | |||
| Economic | 10. | Population density | 167.143 | 3308 | 0.00 | 45,165.458 | 44,665.210 | 45,665.710 | ||
| 11. | Employment density | 177.023 | 3308 | 0.00 | 34.112 | 34.270 | 33.954 | |||
| 12. | Access to industrial area | 438.52 | 3308 | 0.00 | 33.315 | 31.490 | 35.140 | |||
| 13. | Access to urban center area | 102.074 | 3308 | 0.00 | 37,803.566 | 37,077.420 | 38,529.710 | |||
| 14. | Access to education area | 112.045 | 3308 | 0.00 | 39,438.048 | 38,747.920 | 40,128.170 | |||
| 15. | Access to institute area | 42.039 | 3308 | 0.00 | 290.269 | 275.940 | 304.590 | |||
| Social | 16. | Access to health care area | 11.19 | 3308 | 0.00 | 24,186.610 | 19,794.040 | 28,579.180 | ||
| 17. | Access to parks/public spaces 112.045 | 3308 | 0.00 | 248,822.140 | 215,457.330 | 282,186.960 | ||||
| 18. | Access to piers | 4.093 | 3308 | 0.00 | 19.857 | 22.369 | 17.345 | |||
| 19. | Access to train stations | 0.274 | 3308 | 0.00 | 358.68 | 180.574 | 536.787 | |||
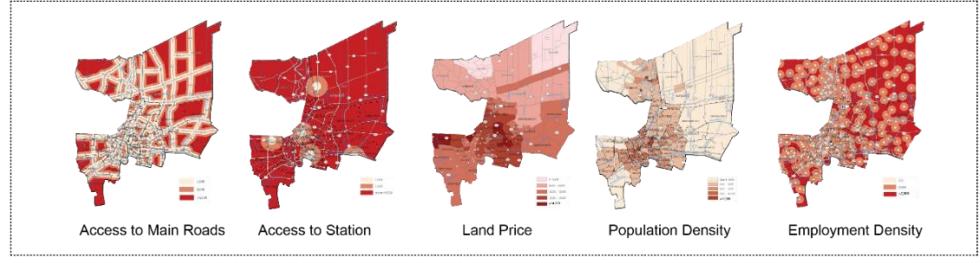
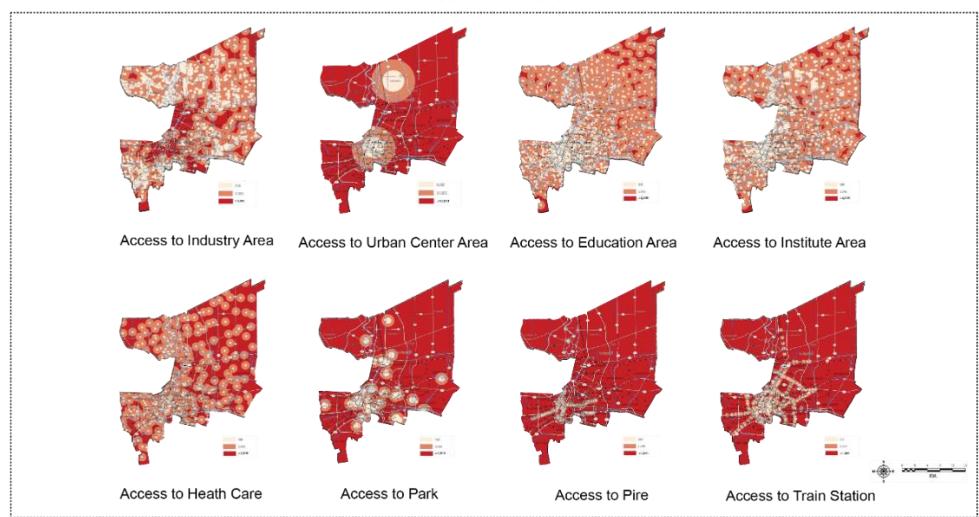
Figure 5. Geographical data among the three dimensions of the analysis. (Source: authors)
From Table 6, Kaiser-Myers-Olkin's (KMO) statistical value was obtained (0.852), which presents a value greater than 0.500. The analysis result indicates that all data and variables were well-correlated. This could be used for component analysis to determine the relationship between the district pattern and its level of accessibility of the transport network based on Bartlett's test of sphericity. When considering the statistical values, it was found that the chi-square statistic ( 2 ) used in the test was 8,185.940, which was statistically significant at the .05 level, and the correlation matrix of the variables was related. Hence, the correlation matrix was appropriate for further composition analysis. From the analysis result, it was found that the number of elements with eigenvalue greater than 1 of the eight components and its cumulative value was greater than 60%. Rotation of the components revealed that eight components had an eigenvalue range between 1.040 and 5.535 with a cumulative variance of 80.758%. The summary of all components is as follows (Table 7):
- All eight elements could be grouped and the first component of two variables had an eigenvalue of 5.535 with a weight range of 0.884-0.955. The name of the new variable is multimodal transportation.
- The second component had three variables with an eigenvalue of 3.765 and a weight range of 0.786-0.905. The name of the new variable is urban economic.
- The third component had two variables with an eigenvalue of 3.618 and a range of weights of 0.447-0.913. The name of the new variable is urban form.
- The fourth component had five variables with an eigenvalue of 2.912 and a weight range of 0.510-0.887. The name of the new variable is urban density.
- The fifth component had one variable, an eigenvalue of 1.948, and a weight range of 0.7841. The name of the new variable is industrial area.
- The sixth component had three variables with an eigenvalue of 1.571 and a weight range of 0.790. The name of the new variable is access to government offices.
- The seventh element had a number of variables with an eigenvalue of 1.418 and a weight range of 0.329-0.698. The name of the new variable is public space.
- The eighth element had two variables with an eigenvalue of 1.040 and a weight range of 0.801. The name of the new variable is access to public services.
Table 6. The Statistical Value of the Classification Factors and their Total Variance Explained
| Initial Eigenvalues | Loadings | Extraction Sums of Squared | Rotation Sums Loadings | of Squared | |||||
|---|---|---|---|---|---|---|---|---|---|
| Component | Total | % of Variance | Cumulative % | Total | % of Variance | Cumulative % | Total | % of Variance | Cumulative % |
| 1 | 5.535 | 20.498 | 20.498 | 5.535 | 20.498 | 20.498 | 4.257 | 15.765 | 15.765 |
| 2 | 3.765 | 13.944 | 34.442 | 3.765 | 13.944 | 34.442 | 3.890 | 14.408 | 30.174 |
| 3 | 3.618 | 13.399 | 47.841 | 3.618 | 13.399 | 47.841 | 3.530 | 13.074 | 43.248 |
| 4 | 2.912 | 10.783 | 58.625 | 2.912 | 10.783 | 58.625 | 3.003 | 11.123 | 54.371 |
| 5 | 1.948 | 7.215 | 65.840 | 1.948 | 7.215 | 65.840 | 1.939 | 7.180 | 61.551 |
| 6 | 1.571 | 5.817 | 71.657 | 1.571 | 5.817 | 71.657 | 1.873 | 6.937 | 68.488 |
| 7 | 1.418 | 5.251 | 76.908 | 1.418 | 5.251 | 76.908 | 1.779 | 6.590 | 75.078 |
| 8 | 1.040 | 3.850 | 80.758 | 1.040 | 3.850 | 80.758 | 1.533 | 5.680 | 80.758 |
| 9 | 0.844 | 3.127 | 83.885 | ||||||
| 10 | 0.776 | 2.874 | 86.759 | ||||||
| 11 | 0.640 | 2.372 | 89.131 | ||||||
| 12 | 0.603 | 2.232 | 91.363 | ||||||
| 13 | 0.590 | 2.185 | 93.548 | ||||||
| 14 | 0.437 | 1.617 | 95.165 | ||||||
| 15 | 0.304 | 1.127 | 96.292 | ||||||
| 16 | 0.298 | 1.110 | 96.542 | ||||||
| 17 | 0.292 | 1.108 | 97.214 | ||||||
| 18 | 0.284 | 1.102 | 97.873 | ||||||
| 19 | 0.279 | 1.097 | 98.121 | ||||||
| Kaiser-Meyer-Olkin Measure of | |||||||||
| Sampling Adequacy* | Bartlett's Test of Sphericity | ||||||||
| 0.852 | 2 Approx. Chi-Square (𝑥 ) | df | Sig. | ||||||
| 8185.940 | 91 | 0.000 | |||||||
To analyze all explanatory variables based on the new grouping among eight variables to group the different district typologies in the Bangkok Metropolitan Region (representative of a metropolitan area) and Pathum Thani Province (representative of a suburban area or areas surrounding a capital city), clustering was employed to obtain geoinformatics mapping clusters. Using this powerful spatial analysis tool, the results can be used to identify a variety of features within the most similar groups. It is also possible to find heterogeneous groups, for which the clustering analysis is done on a specified number of clusters, analytical variables, and optional spatial constraints. It is necessary to check and repeat the analysis several times to help determine the most appropriate number of groups and analysis variables. The grouping analysis was accepted based on the statistical value of the grouping analysis with the K-means algorithm technique. As for the overall variable statistics, the degree of freedom was 3,380 with a standard distance of 1,217.2908 and an SSD of 15,394.554.
Table 7. Results of the Grouping Analysis (Spatial Statistics)
| Factor | Number of Variables | Factor details | Eigenvalues | Range of weights | Grouping Analysis | |
| 1 | 2 | 7 Access to main roads 8 Access to station | 5.535 | 0.884-0.955 | Multi-modal transportation | |
| 9 Land price | • | |||||
| 2 | 3 | 10 Population density | 3.765 | 0.786-0.905 | Urban economic | |
| 11 Employment density | ||||||
| 3 | 2 | 1 Road density | 3.618 | 0.447-0.913 | Urban form | |
| 3 | 2 | 13 Access to urban center area | 3.016 | 0.447-0.913 | ||
| 2 Residential density | ||||||
| 3 Commercial density | ||||||
| 4 | 5 | 4 Mixed-use density | 2.912 | 0.510-0.887 | Urban density | |
| 5 Institute density | ||||||
| 6 Industry density | ||||||
| 5 | 1 | 12 Access to industry area | 1.948 | 0.784 | Industrial area | |
| 14 Access to education area | Access to | |||||
| 6 | 3 | 15 Access to institute area | 1.571 | 0.790 | government offices | |
| 16 Access to health care area | 50 verimient offices | |||||
| 7 | 1 | 17 Access to park/public space | 1.418 | 0.329-0.698 | Public space | |
| 8 | 2 | 18 Access to pier | 1.040 | 0.801 | Access to public | |
| O | _ | 19 Access to train station | 2.010 | 3.301 | services | |
Figure 6 presents a summary of both the groups and the internal variables. It is noted that Group 2 (pink line) had the highest factor value. Group 1 (blue line) had the highest value for factor 2, which represents socioeconomic variables. In contrast, for Group 3 (green line) it was found that the most common factors were: (6) the accessibility to government offices, (7) public areas, and (8) access to public services. For group 4 (yellow line), some factors were found to have a high value, including (1) multi-modal transportation.
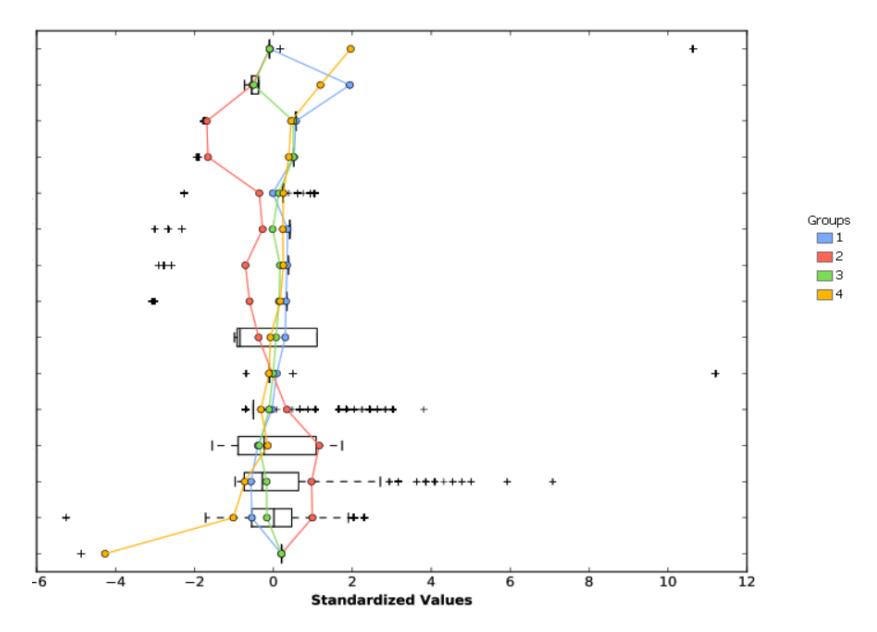
Figure 6. Grouping analysis and its parallel box plot graph. (Source: authors)
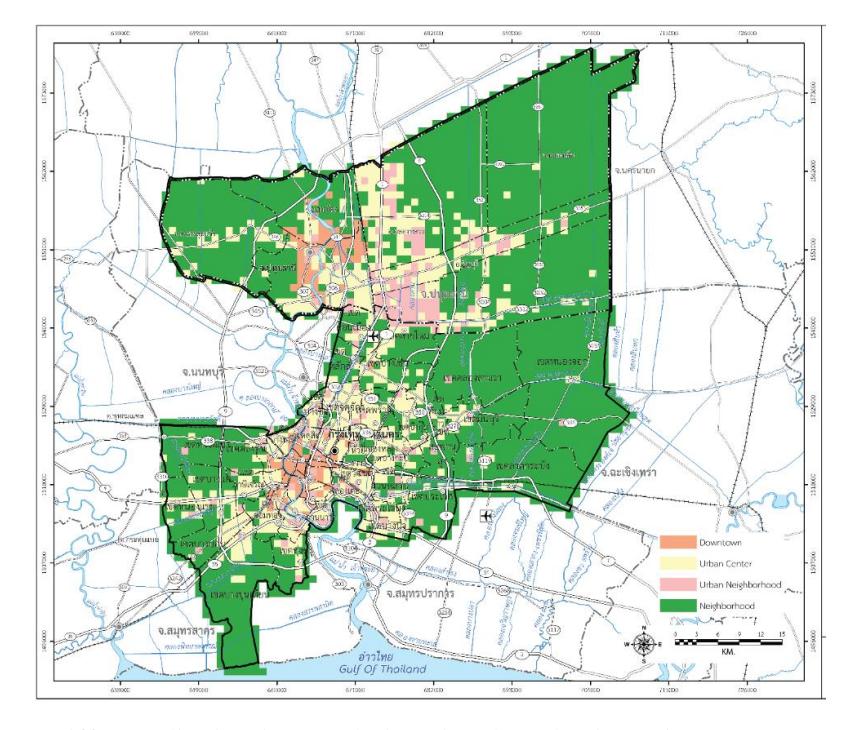
Figure 7. Different districts in Bangkok and Pathumthani province. (Source: authors)
Figure 7 demonstrates the relationship between the different factors and the grouping of districts into four types. The four types of district are: (1) Downtown, (2) Urban Center, (3) Urban Neighborhood, and (4) Neighborhood. Finally, the result of reclassification were eight new factors, which form a new group of variables, namely: (1) multi-modal transportation, (2) urban economic, (3) urban form, (4) urban density, (5) industrial area, (6) access to government offices, (7) public space, and (8) access to public services. This new group of variables was obtained from factor analysis, which was aimed to reduce the redundancy of the original set of variables. A geographical representation will be given to highlight the spatial differences between the separate districts.
Grouping of districts in the study area
The reclassification results as shown in Table 8 were derived from the classification into four different districts. An explanation of the characteristics of the district composition is geographically presented in Figure 8. It was found that the district patterns were differentiated in terms of the built environment (e.g., housing, activities, travel patterns in the area), affecting the quality of life and social inclusivity through the limitation of accessibility, particularly to public transport modes. Furthermore, many areas still face the problem of inequality in terms of housing, lifestyle, income, and alternative modes of travel (mass transit service, public transport, etc.). More detailed links can be shown by using GIS and the space syntax technique to provide a better understanding of essential accessibility according to spatial characteristics. This suggests that the associated evaluation of accessibility can be done through the actual accessibility based on physical aspects among the choice of travel modes. However, the current approach did not consider the actual commuting traffic volumes caused by morning and evening commuting peaks, speed limits, or other traffic-related data that could have an influence on the real accessibility situation.
Grouping Clusters Bangkok Metropolitan Pathumthani Province Area (km2 ) Percent (%) Area (km2 ) Percent (%) 1 Downtown 105.00 6.77 16.00 0.90 2 Urban Center 367.00 23.68 315.00 17.81 3 Urban Neighborhood 71.00 4.58 84.00 4.75 4 Neighborhood 1,007.00 64.97 1,354.00 76.54 Total 1,550.00 100.00 1,769.00 100.00
Table 8. The Different Urban Pattern Clusters
Downtown district
The Downtown district was categorized as a district with intermodal facilities/transportation hub, which is the central hub of economic and cultural activities within the CBD or the city center. The core area is characterized by a high-density mix of housing and employment. It serves as a transit hub for the region, providing connectivity services through two or more modes of transport, i.e., high-frequency, high-capacity regional rail, and bus services. The core area features a wellconnected road grid for maximum mobility and transport access, typically busy all day and night, best accessed in a 400-m radius around bus terminals, high-quality regional destinations, and bus/tram connections, as presented in Figure 8a.
Urban Center districts
The Urban Center districts can be seen as sub-destinations, which are areas that provide regional services, employment, or destination design. Unlike cities, these centers offer at least two public transport modes (public buses and mass transit) and are also busy both day and night. Typically, an environment of this type of district is a lively, crowded, functional, multipurpose area with an array of roads that encourage high-density walking and cycling activities within the area. It can be geographically visualized as depicted in Figure 8b.
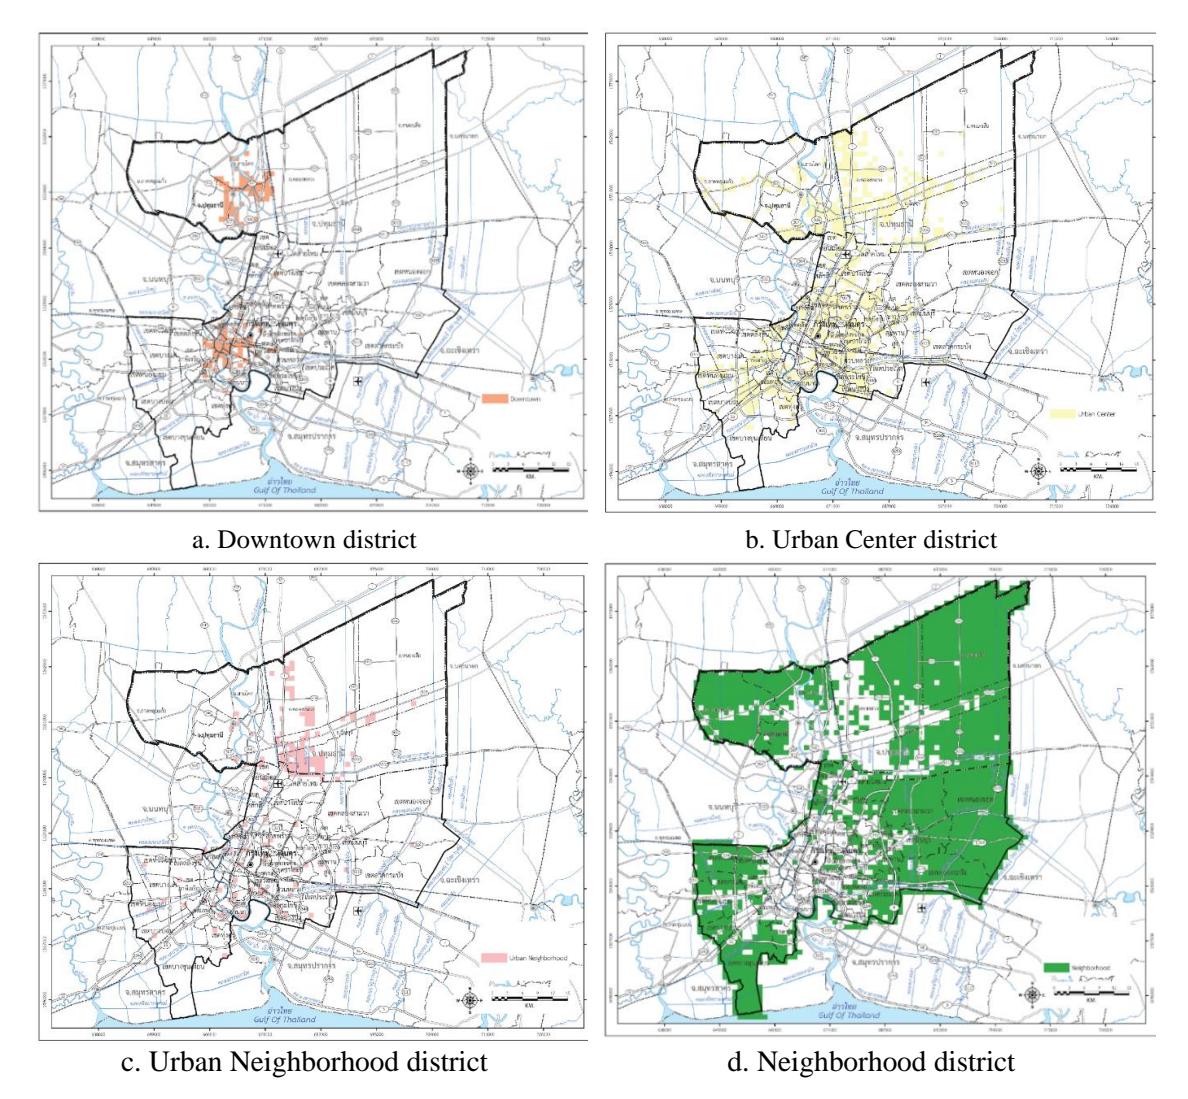
Figure 8. Grouping of different districts. (Source: authors)
Urban Neighborhood districts
The Urban Neighborhood districts basically feature multiple options for accessibility to local public transport. The multimodal node is a park and ride station that is much smaller than the local service centers that serve economic and community activity in urban areas (Figure 8c).
Neighborhood districts
The Neighborhood districts were found to be the lowest hierarchy of districts, with inconvenient access to public transport. Some areas are not accessible through public transport networks, allowing for commuting mainly by passenger car (e.g., Nong Chok, Lat Krabang, etc.). Traveling in these districts often ends up at employment nodes as the destination. Furthermore, they are not areas of concentrated economic activity and urban density; they tend to disperse the living patterns in the area sparsely. Local development should increase pedestrian connections to public transport and allow for convenient linkage to other zones, as presented in Figure 8d.
Level of accessibility in different districts
Based on the space syntax analysis, it was found that the populations in the different districts have their own level of accessibility among a wide range of local networks. Residents who live in urban areas have better choice of transport modes. However, the different characteristics of the districts lead to different levels of accessibility of their residents as well as the infrastructure and services that the decision-making process should consider for equal access for all. From the analysis of route coefficients in the road network (Figure 9), it was found that Bangkok has an average accessibility of 2.500, while Pathum Thani Provine has an average accessibility of 2.283. When considering the correlation between the path environment factor and the morphological index, it was found that the global integrations (Rn) were in the same direction, which represents a low correlation reliability (R 2 ) of 0.05 (Bangkok) and 0.01 (Pathum Thani), respectively. More road network embedding levels have resulted in low accessibility levels. For local integrations (R 3 ), the embedded level at the district level shows a similar relationship trend. Thus, the reliability of the relationship (R 2 ) was 0.05 (Bangkok) and 0.02 (Pathum Thani), respectively. For the analysis of each district, it was found that Group 1 (Downtown) had a high level of accessibility. Group 2 (Urban Center) was also found to have a good level of accessibility. However, Group 3 (Urban Neighborhood) and Group 4 (Neighborhood) had low accessibility, which was influenced by the urban density. Nevertheless, the allocation of basic infrastructures and services affects the wellbeing of people in the city, where moderate to low density will result in a low level of accessibility. Thus, it could be seen from the correlation analysis of the accessibility that correlates with road infrastructure providing access to public services has a good level.
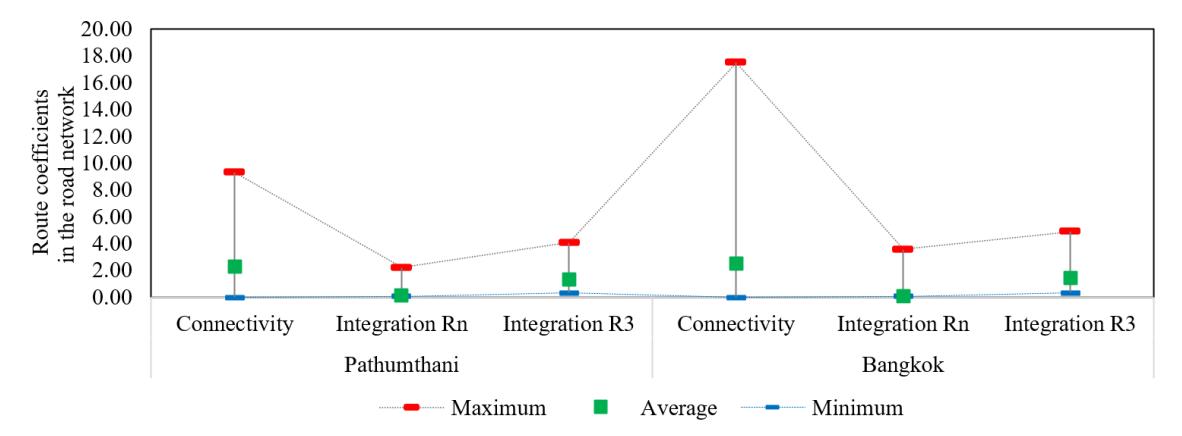
Figure 9. Relationship between urban and district patterns. (Source: authors)
Public agencies should take this finding into consideration to ensure the opportunity for different groups of residents to have equal access. In addition, considering the grouping of districts and considering the accessibility of the transportation network in each district, it was found that the Bangkok area as the capital city of Thailand, has a a very different condition from Pathum Thani Province (suburban area) in terms of accessibility level (Figure 10).
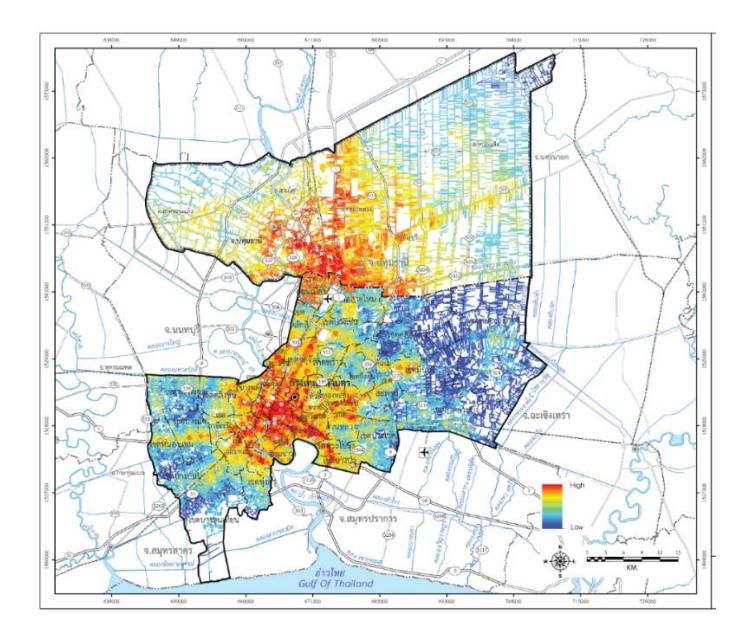
Figure 10. Accessibility levels in different districts. (Source: author)
Furthermore, it was seen that the level of connectivity is the highest in Bangkok due to the concentration of transportation infrastructure investment in the capital city, including public buses, skytrains (BTS and MRT), and Chao Phraya express boats. On the other hand, it was found that only public buses as modal choice are available in Pathum Thani Province as a suburban area. Although there is river and canal network connectivity between the suburban and capital areas, multimodal choice connectivity is limited and must be considered at different levels, which requires further consideration to achieve better connectivity (Iamtrakul et al., 2018a). Better linkage to mass transit systems (e.g., sky trains, subway, etc.) must be an option to enhance access to opportunities in surrounding areas with more effectively constructed hubs providing multimodal choice according to the sustainable mobility concept.
Discussion
Most of the changes in land use have occurred along highway developments, which led to urban growth in terms of sprawl in the surrounding areas of Bangkok influenced by the market, social, and economic momentum and government policies or promotion (e.g., highway development, transportation infrastructure investment, etc.) (Padon A. et al., 2021). Therefore, transportation options in Bangkok as the capital of Thailand and as a megacity have been developed in the form of a mass transit system that serves as a trunk line of services that aims to help alleviate traffic congestion and increase the quality of life of the inhabitants. The first phase was always initiated within the area by sufficient demand, resolutely focusing on Bangkok as an economic agglomeration center. Then, network alignment and expansion were planned to cover the surrounding areas of the capital and facilitate the huge commuting demand. Areas with a mass transit system are considered gathering places for people and activities that require major development to attract more users with direct requirements for effective land-use control. Furthermore, the planning and design of the coverage of the mass transit services must also be consistent with the specific context of the different areas.
Since the enormous investments involved must consider multidimensional aspects to induce the choice for public transportation, this challenge guarantees socioeconomic changes, especially impacting people's travel behavior and their lifestyles in response to the land use of the areas
surrounding the stations (both formal and functional changes) (Iamtrakul et al., 2022b). Transitoriented development must be conducted so as to allow inclusive accessibility for convenient and comfortable lifestyles while reducing travel time (Iamtrakul et al., 2022a). However, this situation has resulted in the popularity of housing settlements along the transit lines, which stimulates an increase in the number of residential buildings and real estate developments rather than supportive transportation infrastructure development. The concentration of residential buildings in areas surrounding the mass transit lines causes land prices to rise in urban areas, because of which lowincome residents cannot improve their living conditions. Therefore, the rapid dispersion of settlements to suburban areas in the search for more affordable housing, directly and indirectly creates disparities in accessibility to both housing and urban amenities and services, and finally results in car-dependent city development.
Thus, effective land-use planning must be conducted by considering the quantitative and qualitative distribution of urban services and facilities (e.g., jobs, healthcare, leisure, and recreation facilities, etc.) to ensure that travelers can reach these destinations, covering the demand for these essential facilities, from their original locations. Furthermore, in terms of transport choices, availability and affordability must be integrated into the features of the transport system in order to reduce the individual's constraints while enhancing the ability of various social groups to participate in multiple activities without suffering from deficits.
Conclusion
This research aimed to develop a method for measuring spatial inequalities of transport accessibility and urban development patterns by focusing on the urbanization of Bagkok as a megacity. The analysis obtained remarkable results by considering the accessibility level of each group of clusters in the study area (Bangkok Metropolitan Administration (BMA) and Pathum Thani Province) based on factor analysis and clustering analysis. Regarding the characteristics of each cluster, it was found that Group 1 (Downtown) and Group 2 (Urban Center) had high levels of connectivity. In contrast, lower levels of accessibility were found in the other district types. This is consistent with the patterns of city expansion that have resulted in the formation of superblocks. The implantation at a higher district level is because of the availability of a small alley network within the blocks (Iamtrakul et al., 2018b). Thus, more shortcuts to the main road in Group 3 (Urban Neighborhood) and Group 4 (Neighborhood) will lead to better connectivity. This will help to provide better connections with daily services and activities that encourage lively lifestyles, which is inversely proportional to city expansion toward increasing the level of accessibility to the transportation network. Furthermore, expanding shortcut roads would be an effective strategy to improve traffic conditions in the urban and neighborhood areas; particularly, the development of superblock areas needs to provide better accessibility for residents or communities in large-size blocks. This brings with it the benefit of contextualizing the area's development with effortless access to its essential infrastructures and services, and particularly other life opportunities.
The key point of promoting better connectivity of road networks through each area is the need to consider the land owners and responsible agencies in a particular area for the feasibility of policy and implementation. This is because the land acquisition and compensation negotiation process for road construction is time-consuming, which is also sensitive to the project duration toward the decision-making process. However, Bangkok is a megacity with intensive urban development and transportation infrastructure investment. Road networking is therefore necessary to create high route connectivity. However, the current linkage at the provincial and district levels in Bangkok and Pathum Thani Province is similarly at a low level of accessibility, consistent with the study of Iamtrakul et al. (2022b). In addition, such typical considerations only focus on physical factors that contribute to accessibility to different infrastructures and services.
Furthermore, by applying space syntax analysis, the identification of accessibility could be performed with integration of the physical, social and economic aspects to show the inequalities in the different clusters. The spatial distribution of opportunities is significant in demonstrating the distribution of infrastructure in transport provision. GIS can help to underpin the variety distribution of accessibility throughout the metropolitan and peri-urban areas. The analysis results can help to localize analysis approaches in the spatial determination of transport planning. The marked differences in accessibility among different groups of urban patterns (four clusters) allow for better identification of quantitative accessibility measurements to the residents' employment and social services (e.g., education, health, etc.). Although the residents' socio-economic status plays a significant role as the main criteria for equity analysis in transportation planning, this research set the scope of the analysis in terms of the opportunities to reach different urban contexts in the proportionate potential of accessibility. Regional scale analysis provides evidence for understanding the inequalities in transportation that arise from inappropriate land-use and transportation planning approaches. The spatial organization and functionality of the different clusters of urban contexts showed differentiation in the results, which provides insight into social and economic inequalities due to demand and supply interactions among different mode choices in all groups of commuters. The consideration of improving coverage and accessibility and redistribution of urban services and facilities must be comprehensively accounted for to prevent social and spatial segregation. In general, it is better to reinforce the distribution of transport infrastructures and other facilities to sustain agglomeration of attractiveness and wealth in any specific area by consistently planning the socio-spatial and economic structures, both at the city and the regional level. Therefore, it is important to consider further relevant limitations of intangible aspects that could help to alleviate the limitation of accessibility to public transportation and non-motorization. Additionally, the provision of inclusivity in accessibility must be incorporated in transport planning by integrating public transport choices for diverse groups of road users in different urban contexts to achieve the goal of multimodal planning and compact development. Finally, social exclusion should be integrated into the planning and policy development to overcome urban development challenges and maintain quality of life for all.
Acknowledgement
The authors gratefully acknowledge the support provided by Thammasat University Research Fund under the TSRI with Fundamental Fund (2022) of a project entitled "The Holistic Approach of Urban Planning toward An Integrative Urban Land Use and Road Safety", Contract No. TUFF 53/2565) and partially supported by Thammasat University Research Fund with Fast Track (2022), Contract No. TUFT-FF23/2565). The research was also supported by Faculty of Architecture and Planning Research Fund, Thammasat University, contract no. TDS 10/2021, and partially supported by Center for Excellence in Urban Mobility Research and Innovation, Faculty of Architecture and Planning, Thammasat University, Pathumthani, Thailand.