
Introduction
The increasing pace of urbanization and the condition of the COVID-19 pandemic in Indonesia are challenges that must be faced in today's landscape development. The government has made various appeals to carry out physical distancing to prevent the spread of COVID-19. The sectors most affected by large-scale social restrictions include the economic sector, the manufacturing sector, the transportation sector, the social sector, and the food sector, with people isolating themselves, losing their income, fearing activities, and experiencing excessive anxiety. This situation has changed the meaning and function of public space, causing people to restrict their movement in public space. However, public space is a place for interaction between individuals or communities, improving public health and welfare (Winarna et al., 2021).
In public health studies, Shinrin-yoku, or forest bathing, has been investigated in Japan, America, China, Korea, United Kingdom, Taiwan, Finland, and Canada (An et al., 2019; Cameron et al., 2020; Elsadek et al., 2019; Goto et al., 2017; Hassan et al., 2018; Mao et al., 2017; Ojala et al., 2019; Song et al., 2013, 2014; Song, Ikei, Kobayashi, et al., 2015; Song, 2019; Tyrväinen et al., 2014). Forest bathing is an approach to health promotion by engaging in activities in a forest landscape. Research conducted on young adults demonstrated that walking in a forest and enjoying the scenery could reduce the heart rate (Song et al., 2019a, 2019b; Pratiwi et al., 2019, 2020) and blood pressure (Ochiai et al. 2015; Yu et al., 2017), stabilize the balance of the sympathetic/parasympathetic systems (Song et al., 2017; Song et al. 2019a, 2019b), improve positive moods, reduce negative moods (Yu et al., 2017; Chen et al., 2018); and anxiety levels (Song et al., 2019a, 2019b; Pratiwi et al., 2019, 2020).
Indonesia is a tropical country with the second-highest terrestrial biodiversity in the world. Flora and fauna dominate the seven main islands of Indonesia, namely Sumatra, Kalimantan, Java, Sulawesi, Lesser Sunda, Mollucas, and Papua, where Java is the island with the highest flora diversity (BAPPENAS, 1993). Biodiversity provides food, water, shelter, clean air, and medicine. Biodiversity is the main pillar of a green campus. IPB Dramaga Campus is one of the campuses in Indonesia that have implemented the green campus concept. Its total score is 31 according to IPB's Dramaga Campus Green Level Survey using UNEP's Green University Toolkit criteria. The Green Level was raised from 'Medium' to 'Very Good' with correct values for green office implementation, green campus audit, green champion, green financial strategy, water treatment, green labs, and off-campus transportation (Sisriany & Fatimah, 2017). The programs launched and implemented by IPB Campus include four green campus elements, namely green
transportation, green movement, green energy, and green building/open space within the Darmaga Campus of IPB. In line with the Academic Paper and Planning for the Implementation of Green Campus IPB 2019-2023 (Rustiadi et al., 2019), IPB declared its university campus a Biodiversity Campus with three focus programs, i.e., 1) structuring green areas by determining park points/locations, designing parks, and preparing human resources for park management, 2) mapping and identifying human resource needs for park management, and 3) surveying tree health and safety. It impacts the academic community's environmental cleanliness, beauty, security, comfort, and health. Therefore, a campus with high biodiversity has a high potential for health benefits for its academic community through forest bathing in parks, forests, and other campus green infrastructure. The benefits of forest bathing during the pandemic in Indonesia have not been studied previously. Therefore, this study aimed to identify the physiological and psychological effects of walking in campus green spaces and to classify the landscape elements of park therapy. The hypothesis in our study was that walking in campus green spaces leads to physiological and psychological relaxation of participants.
Theoretical Review: Why is forest bathing an effective method to improve human's health and well-being?
As the pace of urbanization reduces contact between people and nature, city dwellers are looking for effective and convenient ways to deal with urban stress. Forest bathing is a set of practices involving exposure to natural stimuli with physical activity and relaxation in and around forests. This approach is thought to enhance immune competence through plant-derived physiological relaxation, with the aim of promoting physiological relaxation and preventing medicinal ineffectiveness by improving immune function (Lee et al. Miyazaki et al., 2015; Ochiai et al., 2015; Park et al., 2009, 2010; Song et al., 2017).
Not all city dwellers have access to natural forests. Cities have pocket parks such as block parks, neighborhood parks, city parks, or urban forests with tree-planted areas that serve local recreation. Parks are valuable natural environments in cities. Most people of all ages have access to their favorite nearby parks (Pratiwi & Furuya, 2019). Urban green space therapy begins with passive activities such as using horticultural plants and viewing urban green spaces as natural stimuli and experiencing physical activity in urban green spaces that can improve the cardiovascular health of young and old adults and induce physiological and psychological relaxation to prevent disease (Hofmann et al., 2018; Igarashi et al., 2015; Siang et al., 2018; Uijtdewilligen et al., 2019; B. Xie et al. 2018). Most evidence-based studies have shown that the physiological and psychological benefits of walking and viewing forest and park landscapes, including various environmental factors such as natural surroundings, landscaping, and cultural differences, are associated with human-landscape interaction. A cross-cultural study explored different garden styles (Elsadek et al., 2019). Japanese gardens, architectural gardens, and English landscape gardens induced psychological, emotional, and healing benefits in young Canadian and Japanese students. Viewing an English landscape garden, as the most natural-looking garden type, increased parasympathetic activity. Research related to forest therapy in Indonesia has not been conducted previously; thus, basic research was conducted in a landscape close to an academic environment.
Research Design
Experimental Sites
A field experiment was conducted from August to September 2021 at the Dramaga IPB campus, Bogor. Academic Event Plaza (AEP) and Landscape Arboretum were chosen as the experimental research locations, while Jalan Raya Dramaga was the control area (Figure 1 and 2). The selection criteria for the walking course were: 1) 400 m or more one way, 2) flat gradient, 3) security, 4) well-maintained parks or forest areas, and 5) control area located near the activity center of the Dramaga sub-district (Song et al., 2013, 2014, 2015, 2019a; Pratiwi et al., 2020). The details regarding the landscape features along the routes are listed in Table 1.
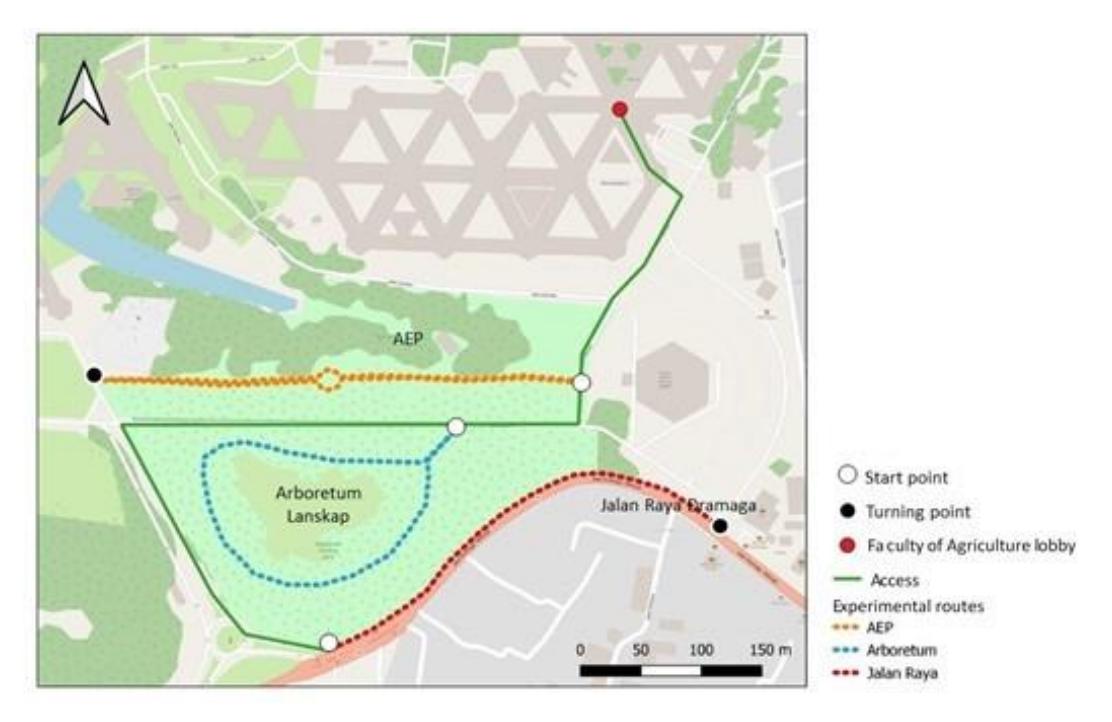
Figure 1. Experimental location.
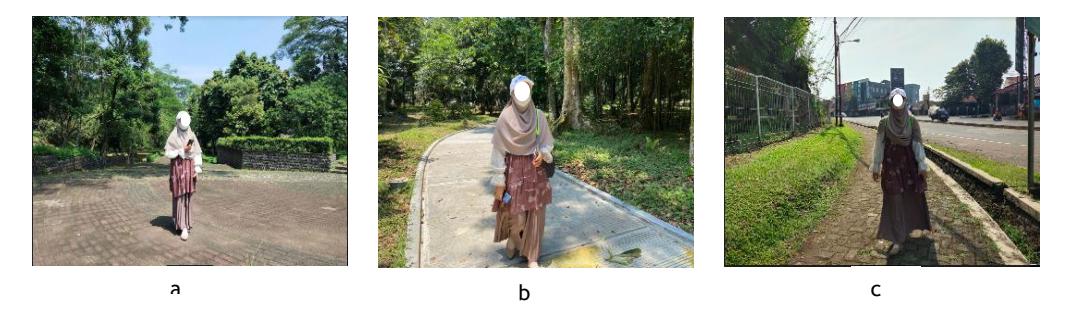
Figure 2. Walking course scene: a. AEP, b. Arboretum, c. Jalan Raya Dramaga.
| Aspects | Experimental Route 1 | Experimental Route 2 | Control Route | |
|---|---|---|---|---|
| Route name | Academic Event Plaza (AEP) | Arboretum | Jalan Raya Dramaga | |
| Length of route | 815.4 m (round trip) | 883.4 m (one and half trip) | 800 m (round trip) | |
| Natural features | Landscape plants: ground Forest tree stands | Turf grass | ||
| cover, bushes, trees | ||||
| Man-made features | Paving block, planter boxes, | Jogging track, benches | Pavement, drainage, | |
| amphitheater, benches, green | fence, streetlamps, | |||
| houses, lamps, water features, | road, vehicles, | |||
| sculpture | buildings | |||
| Temperature (°C) | 30.3 | 30.1 | 30.5 | |
| Relative humidity (%) | 59 | 64.3 | 59.4 | |
| Wind speed (m/s) | 0.03 | 0 | 0.3 | |
| Light intensity (kLux) | 22 | 16.1 | 32.8 | |
| Noise (dB) | 56.3 | 53.7 | 69.4 | |
Table 1. Details of Landscape Features of the Routes.
Physiological and Psychological Measures
The heart rate of the participants was measured continuously using a heart rate sensor (MyBeat WHS-3, Union Tool, Tokyo, Japan), while their blood pressure was measured using a digital sphygmomanometer (OMRON HEM-1021, OMRON Corporation, Kyoto, Japan). Heart sensor and blue sensor M electrodes (Ambu, Penang, Malaysia) were attached to the left anterior chest. Average heart rate values (bpm) during the walking period were used for analysis. A blood pressure test measures the force (pressure) in the arteries as the heart pumps. Blood pressure is expressed in two values: 1) systolic blood pressure (first value – high number) measures the pressure in the arteries when the heart is beating, and 2) diastolic blood pressure (second value – low number) measures arterial pressure between beats (Lehmann and Nelson, 2022).
Two psychological measures, the Indonesian version of Profile of Mood States (POMS) and State-Trait Anxiety Inventory (STAI), were provided before and after the experiment. The POMS was used to assess psychological responses to park exposure, consisting of thirty-five adjectives with six subscales, anger-hostility (AH), confusion-bewilderment (CB), depression-dejection (DD), fatigue-inertia (FI), tension-anxiety (TA), and vigor-activity (VA). The Total Mood Disturbance (TMD) score was calculated by combining A-H + C-B + D-D + F-I + T-A – V-A. A high TMD score indicates an unfavorable mental state (Hashim, 2019; Konuma et al., 2015; Wahyudi & Fajarwati, 2020). Because this study aimed to examine anxiety levels in individuals affected by park and forest environments, STAI's state anxiety was used as a measure of the level of anxiety. The anxiety level consists of twenty adjectives (Iwata et al., 2008; Utami, 2016). Visitor Employed Photography (VEP) was used to collect photographs at the sites. VEP is an effective method for analyzing visitor perceptions of landscape experiences (Heyman, 2012). The photographs were taken with the subject's smartphone using GPS (Geographical Positioning System) to ensure that coordinate point information was included in all photographs (Rathmann et al., 2020). The photographs were then sent to the Google Cloud Vision API software to retrieve keywords for image annotation (Dutta et al., 2018).
Environmental Measures
Temperature, relative humidity, light intensity, wind speed, and sound level were environmental parameters measured every 5 minutes for 15 minutes in each experimental session at each
location. The temperature was measured using Thermohygrometer (HTC-1, Hunan, China). The wind speed was measured using an anemometer (URCERI MT-915, Shenzen, China). The light intensity was measured using a light meter (URCERI MT-912, Shenzen, China). The noise level was measured using a sound level meter (URCERI MT-9111A, Shenzen, China).
Participants
A total of 32 participants were recruited in this experiment. A maximum of four subjects participated on one experimental day. The four subjects were randomly divided into two groups to eliminate the sequence effect. The groups thus consisted of a maximum of two people per day. Before entering the break room, measurement of body temperature (no fever at 38 °C) and general health (no coughing, runny nose or shortness of breath) screening was conducted. During the experiment, health protocols were applied to prevent the transmission of COVID-19. The subjects were asked to 1) wear a mask, 2) keep their distance, 3) refrain from smoking, 4) refrain from eating, and 5) refrain from drinking caffeinated beverages while completing the questionnaire and walking (Pratiwi et al., 2022). The experimental procedure was in accordance with the regulation of the Commission on Research Ethics Involving Human Subjects IPB University (Number: 456/IT3.KEPMSM-IPB/SK/2021).
Experimental Design
On the day of the experiment, each participant walked for fifteen minutes on each walking route from 09.10 am to 11.50 am (Table 1). At the beginning of the experiment, the subjects were briefed and asked to complete the questionnaire to assess their psychological health conditions (mood and anxiety level). Their blood pressure was measured, and heart rate monitoring was started. During the experiment, each subject walked along a predetermined route while photographing landscape elements or landscapes that they found interesting and relaxing for them for fifteen minutes guided by a staff member. The researcher instructed them to walk at equal speed in each location, about two steps per second. The subjects were returned to the break room by a car driven by a staff member, where they completed the questionnaire; their blood pressure was measured, and their heart rate monitoring was stopped. In this study, a washout period of at least thirty minutes was considered sufficient to assess the effect of the intervention (Pratiwi et al., 2019, 2020; Song et al., 2013; Elsadek et al., 2019). The participants were escorted and collected from the site to the break room by at least one staff member per walking route to ensure adherence from the experiment to the study.
The subject eligibility criteria were as follows: (1) IPB students between the ages of 19 and 27, (2) living in Bogor and surrounding areas, (3) not undergoing treatment for cardiovascular disease or hypertension, (4) able to walk for 20 minutes (Pratiwi et al., 2022). Subject selection was performed using a snowball sampling method with ten students as key informants distributed across different faculties. The snowball sampling technique is one of the best tools for finding candidate subjects related to eligibility criteria (Naderifar et al., 2017) using the following four stages: (1) sending announcement posters through social networking services (SNS) using WhatsApp, (2) candidates filled out their identity and the experiment schedule in Google Forms to express their willingness to join the experiment, (3) the research team created a WhatsApp group to send the announcement of the schedule of the experiment and share the zoom meeting link for giving a brief explanation of the research procedures before the experiment, (4) the research team and the participants kept contact until the day of the experiment via the WhatsApp group.
Time Activity (location) 08.30 Gathering at meeting point at Faculty of Agriculture lobby 08.30-08.45 Explanation of the experimental procedure and signing of the consent form 08.45-09.05 Measurement of blood pressure, and heart rate, filling out the pre-experimental questionnaire 1 (break room) 09.05-09.10 Transfer participants to the walking route 1 09.10-09.30 Walking experiment at route 1 (heart rate measurement continues) 09.30-09.50 Blood pressure measurement, stopping heart rate measurement, filling out postexperimental questionnaire 1 (break room) 09.50-10.00 Rest 10.00-10.20 Measurement of blood pressure, and heart rate, filling out the pre-experimental questionnaire 2 (break room) 10.20-10.40 Walking experiment at walking route 2 (heart rate measurement continues) 10.40-11.00 Blood pressure measurement, stopping heart rate measurement, filling out postexperimental questionnaire 2 (break room) 11.00-11.10 Rest 11.10-11.30 Measurement of blood pressure, and heart rate, filling out the pre-experimental questionnaire 3 (break room) 11.30-11.50 Walking experiment at walking route 3 (heart rate measurement continues) 11.50-12.10 Blood pressure measurement, stopping heart rate measurement, filling out postexperimental questionnaire 3 (break room)
Table 1. One-day Experiment Schedule
Analysis Methods
Data Collection Stage
The data collection stage consisted of 1) park therapy experiment and 2) landscape element preference experiment. There were three experimental locations: the Arboretum, the Academic Event Plaza (AEP), and Jalan Raya Dramaga. The experiment was divided into two stages: measuring physiological and psychological responses before and after. During the experiment, the participants were asked to walk along a predetermined route and take landscape photographs of striking scenes during the trip. Visitor Employed Photography (VEP) was used to collect photographs taken with an iPhone (California, United States). VEP minimizes researcher intervention in visitor experience to a large extent and analyzes landscape characteristics and visitor preferences and perceptions quickly and effectively. This has proven to be particularly suitable for sequenced landscapes such as rivers and trails (Gou & Shibata, 2017).
Data Processing Stage
The data processing stage included the analysis of the participants' physiological and psychological responses, as well as the analysis of their preferences. In the analysis, physiological and psychological data from thirty-two participants were analyzed. Repeated Measures ANOVA (RMA) used the physiological response analysis with the main factor being 'location' and the second-factor being 'level', or walking duration. The purpose of this test was to identify the physiological effect of walking in two different campus green spaces and the control area. Physiological responses included heart rate (in bpm) and systolic and diastolic blood pressure (in mmHg). Meanwhile, in the analysis of the psychological responses, Friedman's test with three
location levels (Academic Event Plaza, Arboretum, and Jalan Raya Dramaga (control)) and two time levels (before walking and after walking) were used. The purpose of this test was to identify the psychological effect of walking in campus green spaces and control areas. The psychological responses included six subscales of negative moods ('anger-hostility', 'confusion-bewilderment', 'depression-dejection', 'fatigue- inertia', 'tension-anxiety'), and positive mood ('vigor-activity'), as well as anxiety level. The scores were calculated based on averaged POMS score and state anxiety score of the STAI. All data were provided as mean ± standard deviation (SD), and statistical differences were examined significant at p < 0.05. All statistical analyses were performed using JASP 0.15 (University of Amsterdam, Amsterdam, The Netherlands). In the preference analysis, photograph pre-processing, image annotation, and photograph classification were carried out. The overall results taken by the respondents using Visitor Employed Photography were pre-processed before further analysis. Pre-processing performed on the photographic data included: 1) naming with serial numbers, 2) sorting by location, and 3) compressing photograph file size (minimum 4 megabytes). Once captured, the photographs were sent to the Google Cloud Vision API to retrieve the image annotation keywords (top-50 keywords per image). The API also provided an appropriate confidence score for each keyword, from 0.5 (low) to 1 (very high) (Detect Labels | Cloud Vision API, n.d.) (Wei et al., 2021; Zhu et al., 2020). Data consisting of the names of the photographs and the confidence score of the keywords for each photograph were compiled. The detection results for labeling the photographs represented landscape elements based on the preferences of the participants. Furthermore, cluster analysis was carried out in the JASP 0.15 software with the Euclidean distance metric and Ward's linkage agglomeration to evaluate the grouping results visually and ensure that the photographs of each cluster had a common theme (Gou & Shibata, 2017; Richards et al., 2018).
Table 1 shows the sociodemographic characteristics of the subjects who participated in the park therapy experiment at Dramaga IPB campus. The parameters of sociodemographic characteristics included age, height, body weight, body mass index (BMI), gender, educational level, smoking behavior, sleeping time, Shinrin-yoku knowledge, physical activity intensity, preferred Shinrinyoku program, preferred Shinrin-yoku activities, Shinrin-yoku experience, social attachment in living environment, and participation in the community. The mean age of the experimental subjects was 21.5 ± 2.3, with a sex composition of 25% male (n = 8) and 75% female (n = 24). The mean height of the subjects was 160.5 ± 8.7 cm; the mean weight was 56.5 ± 13.1 kg. Most of the 81.25% subjects were studying at level S1 (n = 26), while 18.75% were studying at level S2 (n = 6). Most of the participants did not smoke (96.9%). 56.3% of the subjects slept less than 7 hours per day (n = 18) and 43.8% for 7-9 hours per day (n = 14). Nearly 50% of the subjects did physical activities 1 to 3 times/month (n = 15) and 1 to 2 times/week (n = 14). We explained the definition of Shinrin-yoku, or forest bathing, the typical activity, and its motives. Most subjects (81.3%) had no prior knowledge of Shinrin-yoku (n = 26). Furthermore, 65.6% (n = 21) of the subjects had never had Shinrin-yoku experiences. Despite not having any knowledge or experience, the Shinrin-yoku program chosen by almost half of the total subjects was a full-day program on weekends 43.75% (n = 14). The selected Shinrin-yoku activities were walking 31.3% (n = 10), sitting while looking at the scenery 21.9% % (n = 7), and lying in a hammock 15.6% (n = 5). Approximately 50% (n = 16) had a moderate level of social attachment to their living environment, with 1.1 ± 1.6 times participation in the community per month.
Table 1. Subject Characteristics.
| Parameter | Mean (N = 32) |
|---|---|
| Age (years) | 21.5 ± 2.3 |
| Height (cm) | 160.5 ± 8.702 |
| Body weight (kg) | 56.7 ± 13.11 |
| Body mass index (BMI) | 21.91 ± 4.65 |
| Gender | |
| Male | 8 (25%) |
| Female | 24 (75%) |
| Educational level | |
| Bachelor | 26 (81.25%) |
| Master | 6 (18.75%) |
| Smoking behavior | |
| Yes | 1 (3.13%) |
| No | 31 (96.88%) |
| Sleeping time | |
| Less than 7 hours | 18 (56.25%) |
| 7-9 hours | 14 (43.75%) |
| Shinrin-yoku knowledge | |
| Yes | 6 (18.75%) |
| No | 26 (81.25%) |
| Physical activity/sports | |
| 1-2 times/week | 14 (43.75%) |
| 1-3 times/month | 15 (46.88%) |
| 1-3 times/year | 1 (3.13%) |
| Every day | 1 (3.13%) |
| Never | 1 (3.13%) |
| Shinrin-yoku Program | |
| Half weekday | 1 (3.13%) |
| One weekday | 1 (3.13%) |
| Half-day weekend | 6 (18.75%) |
| Full-day weekend | 14 (43.75%) |
| Overnight stay with tent | 3 (9.38%) |
| Holidays up to one week | 6 (18.75%) |
| Shinrin-yoku activities | |
| Walking | 11 (34.38%) |
| Sitting while looking at the view | 7 (21.88%) |
| Sensory experience | 3 (9.34%) |
| Breathing exercises | 1 (3.13%) |
| Soaking in river/lake water | 3 (9.34%) |
| Lying in a hammock | 5 (15.63%) |
| Lying in forest ground | 2 (6.25%) |
| Shinrin-yoku Experience | 0.94 ± 2.08 |
| Social attachment | |
| Rarely | 1 (3.13%) |
| Seldom | 7 (21.88%) |
| Sometimes | 16 (50%) |
| Often | 7 (21.88%) |
| Always | 1 (3.13%) |
| Participation in the community (times) | 1.06 ± 1.59 |
Walking in campus green spaces such as parks and arboretums impacts the physiological relaxation of young adult subjects who use the park. The test used on this variable was the Repeated Measures ANOVA test, with the main factor being 'location' and the second factor being 'walking duration'. The location factor had a significant result of heart rate measurement (p < 0.001). The time level (p < 0.001) and the interaction between the two factors had significant results (p < 0.001), which means that walking duration significantly affected heart rate (Table 2). The test was continued with a post-hoc test using the Bonferroni test. The results showed that at the three levels of the location factor, the most significant difference in heart rate was between the Arboretum at 110.48 bpm and Jalan Raya Dramaga at 118.41 bpm (p < 0.001) and between Academic Event Plaza at 112.69 bpm and Jalan Raya Dramaga at 118.41 bpm (p = 0.011). Meanwhile, the Arboretum and the Academic Event Plaza did not significantly differ in their results (p = 0.133). This can also be seen from Figure 3, which shows the average heart rate per minute during walking at each location.
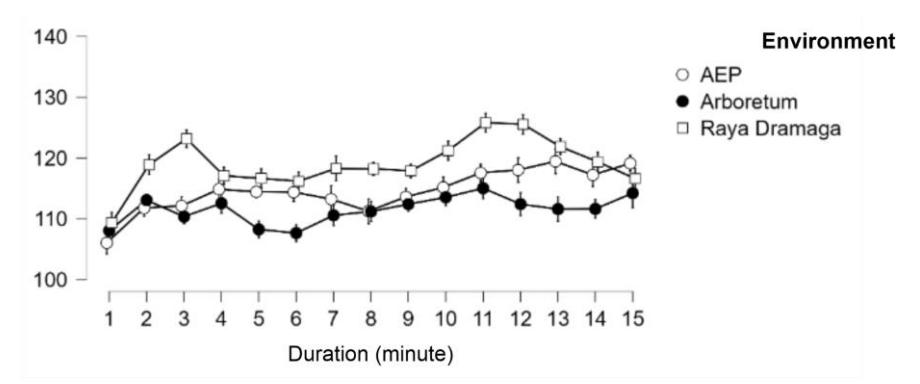
Figure 3. Average heart rate per minute during walking at the three locations.
The subjects' systolic blood pressure measurement showed no significant difference between the three locations (p = 0.614). However, after walking in AEP (108.5 mmHg), the systolic blood pressure was lower than after walking along Jalan Raya Dramaga (110.4 mmHg). In addition, the results of the systolic blood pressure measurements before and after walking at each location did not show a significant difference (p = 0.239). This variable was analyzed using Repeated Measures ANOVA, while the diastolic blood pressure variable was analyzed using ANOVA. Figure 4a shows an increase in the average systolic blood pressure after walking in the Arboretum (before walking: 108.9 mmHg; after walking: 110.9 mmHg). The other two locations showed a decrease in systolic blood pressure (before walking in AEP: 112.3 mmHg; after walking: 108.5 mmHg; before walking on Jalan Raya Dramaga: 111.8 mmHg; after walking: 110.4 mmHg). Diastolic blood pressure did not significantly differ between the three locations (p = 0.211) and time levels (p = 0.664). However, diastolic blood pressure after walking in the Arboretum (72.7 mmHg) was lower than for AEP (73.8 mmHg) and Jalan Raya Dramaga (74.6 mmHg). Figure 4b shows the presence of a slight increase in diastolic blood pressure after walking in the Arboretum (before walking: 72.5 mmHg; after walking: 72.7 mmHg), whereas at the other two sites showed a decrease in diastolic blood pressure (before walking on AEP: 74.4 mmHg; after walking: 73.8 mmHg; before walking along Jalan Raya Dramaga: 75.7 mmHg; after walking: 74.6 mmHg. The blood pressure from the measurements represented a relaxed state.
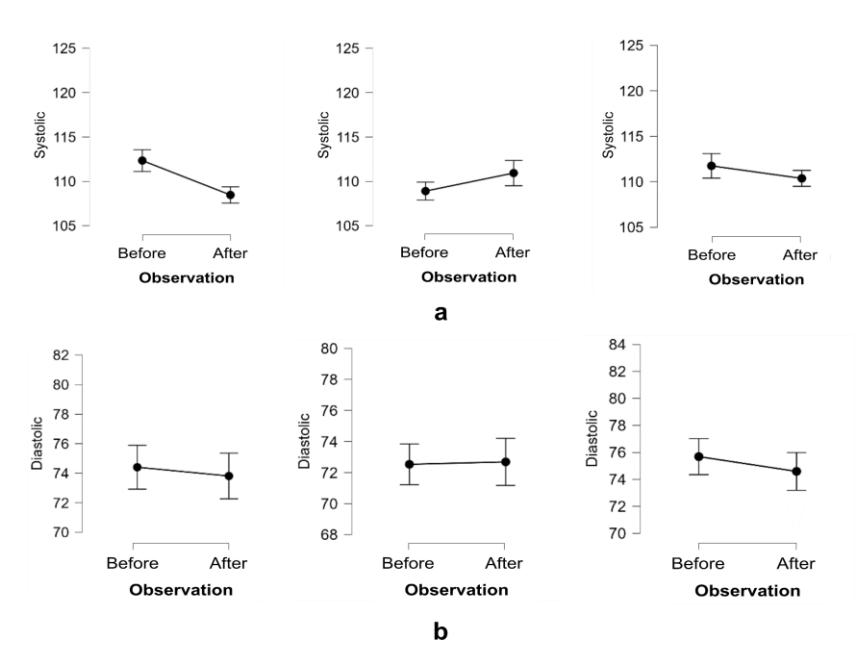
Figure 4. Average blood pressure: a. systolic, b. diastolic after walking in AEP, Arboretum, Jalan Raya Dramaga.
Table 2. Summary Statistics by Repeated Measures ANOVA.
| Physiological parameter | Time | Location | Time x Location |
|---|---|---|---|
| Heart rate | |||
| F = 11.615 | F = 13.296 | F = 2.807 | |
| p = 0.000 | p = 0.000 | p = 0.000 | |
| Blood pressure | |||
| Systolic blood pressure | F = 1.441 | F = 0.491 | F = 3.165 |
| p = 0.239 | p = 0.614 | p = 0.049 | |
| Diastolic blood pressure | F = 0.190 | F = 1.571 | F = 0.096 |
| p = 0.664 | p = 0.211 | p = 0.909 |
Compared to Jalan Raya Dramaga, a short walk in campus green spaces, i.e., the Arboretum and the campus park, caused psychological relaxation. The Friedman test was used to compare the differences between negative and positive mood and anxiety levels before and after walking at the three different locations. Figure 5a shows the mean scores of positive and negative moods of the thirty-two subjects before and after walking in the three different locations on Dramaga IPB campus. Significant differences were found in negative moods 'confusion-bewilderment' (C-B), 'depression-dejection' (D-D), 'fatigue-inertia' (F-I), and 'tension-anxiety' (T-A). The different locations where the subject walked had a significant effect on the negative mood of 'depressiondejection' (p = 0.025) and 'tension-anxiety' (p = 0.005), where walking in the Arboretum had the lowest negative mood score. Meanwhile, the time level, namely before and after walking, had an influence on negative mood changes from 'confusion-bewilderment' (p = 0.000), 'depressiondejection' (p = 0.006), 'tension-anxiety' (p = 0.008) decreased, while 'fatigue-inertia' (p = 0.016) increased. Figure 5b shows a significant reduction in anxiety level after walking in the AEP and the Arboretum. The time level, namely before and after walking, decreased anxiety in the three locations (p = 0.005). Table 3 shows summary statistics on the psychological parameters from Friedman's chi-squared test.
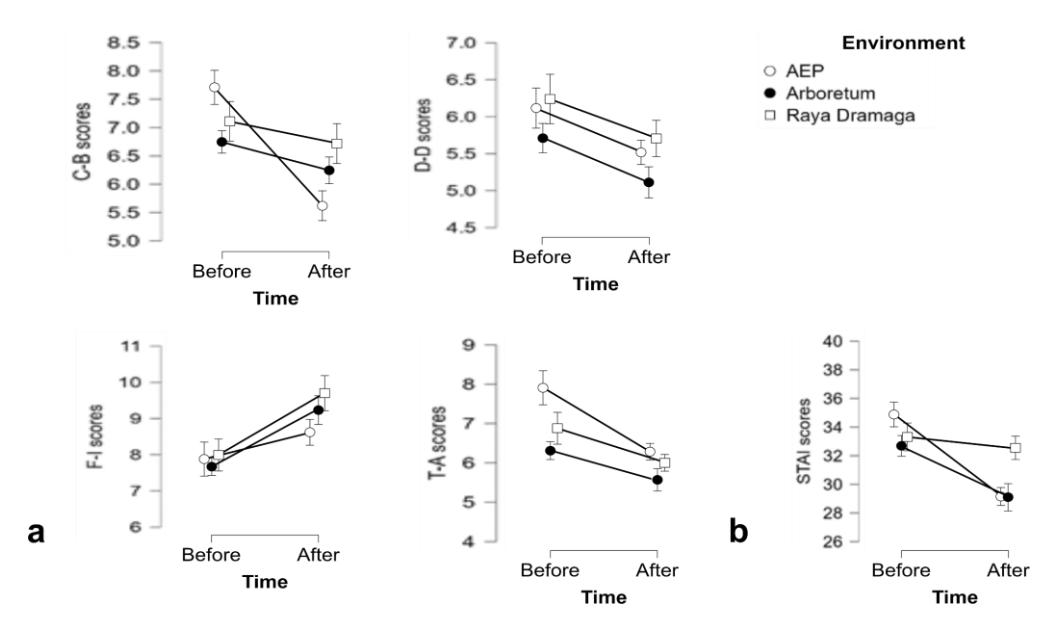
Figure 5. Score comparison: a. POMS, b. STAI in the three different locations.
| Physiological parameter | Time | Location |
|---|---|---|
| Mood state | ||
| Anger-hostility | Value = 1.541 | Value = 4.266 |
| p = 0.214 | p = 0.118 | |
| Confusion-bewilderment | Value = 16.879 | Value = 1.453 |
| p = 0.000 | p = 0.484 | |
| Depression-dejection | Value = 7.5 | Value = 7.4 |
| p = 0.006 | p = 0.025 | |
| Fatigue-inertia | Value = 5.857 | Value = 0.734 |
| p = 0.016 | p = 0.693 | |
| Tension-anxiety | Value = 7.131 | Value = 10.588 |
| p = 0.008 | p = 0.005 | |
| Vigor-activity | Value = 2.757 | Value = 4.548 |
| p = 0.097 | p = 0.103 | |
| State Anxiety | Value = 7.739 | Value = 3.479 |
| p = 0.005 | p = 0.176 |
Table 3. Summary Statistics from Friedman's Chi-squared Test.
Data from the experimental subjects related to the park therapy elements were obtained by collecting 837 photographs. Most of the photographs were taken at AEP (380), followed by the Arboretum (347) and Jalan Raya Dramaga (110). According to the photograph analysis results, the Google Vision API recognized a total of 68 terms. Plants (335), sky (181), trees (151), natural scenery (67), and clouds (58) were the five most detected terms at AEP. Plants (330), sky (171), trees (121), natural landscapes (54), and flowers (52) were detected at the Arboretum. Meanwhile, plants (206), sky (47), flowers (27), clouds (21), and road surface (4) were detected at Jalan Raya Dramaga (Pratiwi et al., 2022). Cluster analysis using Ward's method and squared Euclidean distance was applied to the formulated park therapy landscape elements based on the respondents' preferences for similar groups. The results showed that there were two major groups of campus green spaces called 'man-made landscape', consisting of road surface, buildings, plant organs, stairs, and terrestrial plants found in most of the three locations, 'natural landscape', consisting of sky, trees, flowers, clouds, and plant community mostly found in the AEP and the Arboretum, and the last group called 'plants' (Figure 6 and 7). From Table 4, we can see that Cluster 1
consisted of man-made landscape elements detected in all locations, while Cluster 2 consisted of natural landscape elements without any human disturbance or hardscape.
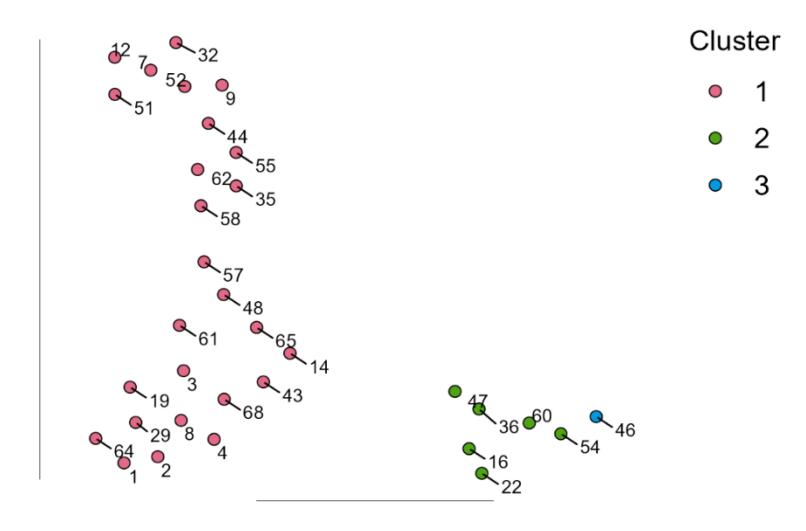
Figure 6. t-SNE cluster plot.
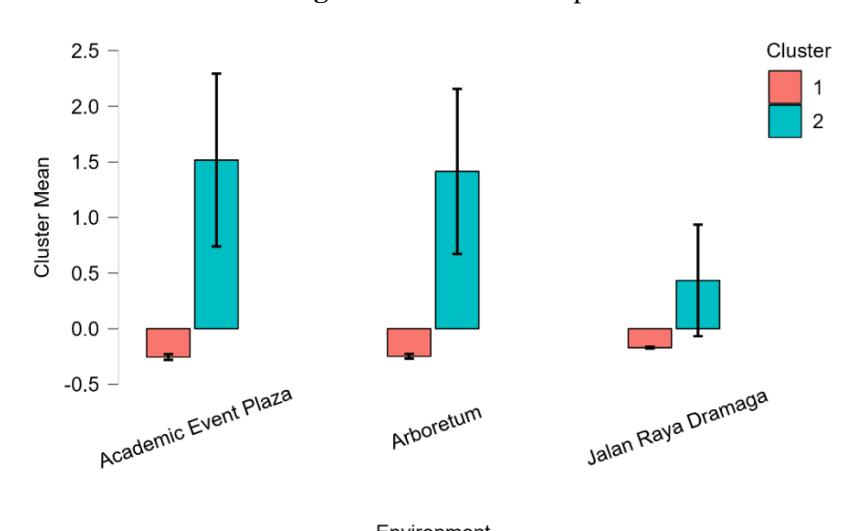
Figure 7. Cluster mean plots.
Table 4. Cluster Information.
| Cluster | 1 | 2 | 3 |
|---|---|---|---|
| Size | 61 | 6 | 1 |
| Explained proportion within cluster heterogeneity | 0.089 | 0.911 | 0.000 |
| Within sum of squares | 1.530 | 15.584 | 0.000 |
| Silhouette score | 0.940 | 0.065 | 0.000 |
Discussion
This study evaluated the physiological and psychological health benefits of park therapy on Indonesian young adults with normal blood pressure after taking brief walks in campus green
spaces and taking photographs of striking landscape elements and views. The major findings of the study indicated that campus green spaces were associated with a decreased heart rate after fifteen minutes compared to suburban walking. Moreover, confusion-bewilderment, depressiondejection, tension-anxiety, and anxiety levels decreased. This is in line with previous research which showed that short walks in parks, green roads, and urban forests planted with trees can provide physiological relaxation and positive health impacts for young adults (An et al., 2019; Rajoo et al., 2019; Song, 2019; Song et al., 2013, 2014; Song, Ikei, Igarashi, et al., 2015; Sundara Rajoo et al., 2021).
Heart rates were lower and decreased during walking in campus green spaces compared to those in a suburban area. Various studies have proved a significant decrease in heart rate in park and forest environments (Song et al., 2019a, 2019b; Pratiwi et al., 2019, 2020). Meanwhile, no significant decrease was found in blood pressure after walking in campus green spaces, although a decrease in blood pressure was reported. Indonesian hypertension treatment guidelines classify blood pressure below 140/90 mmHg as normal and blood pressure above 140/90 mmHg as hypertension (NHLBI-National Institute of Health, 2003). Based on the pre-experimental blood pressure measurement, the subjects' blood pressure was 114.7/76.3 mmHg, thus they were diagnosed with 'normal blood pressure'. Testing subjects with high-normal blood pressure might be more effective to show significant results (Ochiai et al., 2015). Uncontrolled hypertension will cause various complications, such as myocardial infarction, coronary heart disease, congestive heart failure, hypertensive encephalopathy, chronic renal failure, and hypertensive retinopathy (Nuraini, 2015). Therefore, people with normal blood pressure benefit from blood pressurelowering treatments. These subjects do not need antihypertensive agents; however, health promotion (e.g., dietary approach, defending weight and ideal waist circumference, active lifestyle/regular sport, no smoking habit, and no alcohol consumption) are recommended. Besides that, environmental stimuli such as exposure to direct sunlight, mosquitoes, crowdedness, and noise may also affect blood pressure (Lee et al., 2009; Lyu et al., 2019).
The changes in negative mood and anxiety levels as well as prominent landscape elements and views after walking in campus green spaces were also detected. By taking photographs of striking scenes while walking along different routes, we found that the highest number of photographs were taken at AEP, followed by the Arboretum, and Jalan Raya Dramaga. Plants and sky were the most captured landscape elements in the three locations. The captured photographs in campus green spaces were associated with reduced negative mood and anxiety levels, as further investigated by Pratiwi et al. (2022). There were two types of preferred campus green spaces, i.e., man-made landscape and natural landscape with minimum human intervention. This is consistent with previous studies, which found that waterfront areas, vegetation areas, courtyard areas, and square areas perceive optimal attentional restorative effects (Lu et al., 2019). These findings present evidence that campus green spaces not only serve as places of identity and social activities but also act as facilitators for the academic community's recreation and attention restoration, encourage mental well-being, and awaken positive emotions (Elsadek et al., 2019; Foellmer et al., 2021). Therefore, the findings of this study are consistent with the hypothesis that walking in campus green spaces led to physiological and psychological relaxation of the participants. These results are consistent with previous studies on forest and park therapy, which showed significantly reduced negative mood and anxiety levels after walking in a park (Lyu et al., 2019; Song, 2019; Song et al., 2013, 2014; Song, Ikei, Igarashi, et al., 2015).
Our study had some limitations. Firstly, we excluded air pollution measurements and how air pollution may have affected the study results. In further studies, physical data should be considered in describing the existing research location. Secondly, we only used students with normal blood pressure as subjects. It would be better to select and discuss subjects with high blood pressure. An assessment of these factors in a future study would be valuable.
Conclusion
This study presented scientific evidence for the physiological and psychological relaxing effects of walking in campus green spaces. Walking in two campus locations, namely, the Arboretum and the Academic Event Plaza, generated (1) a lower and decreased heart rate; (2) a significant decrease in negative mood, confusion-bewilderment, depression-dejection, and tension-anxiety levels, and (3) a significant decrease in anxiety level. From a total of 837 photographs, 45% of the photographs were taken from the Academic Event Plaza, 41.5% from the Arboretum, and the remaining 13.5% from Jalan Raya Dramaga. There were two major groups of campus green spaces, i.e., 'man-made landscape' consisting of road surface, buildings, plant organs, stairs, and terrestrial plants; and 'natural landscape', consisting of sky, trees, flowers, clouds, and plant community. This study suggests that regular park therapy is a viable alternative for lowering blood pressure in young adults to an optimal range and preventing the continuation of hypertension and various complications. Furthermore, our findings suggest that considering user experience in the park should be used as a comprehensive approach for improving campus landscape designs, especially in formulating appropriate places and views to have physiological and psychological relaxation in campus landscapes.
Acknowledgement
We thank The Institute for Research and Community Services (LPPM) IPB University for providing community funding support for the Young Lecturer Research Scheme (Rector's Decree of 2022 Number: 68/IT3/PN/2021 dated May 31 2021). Thanks are also conveyed to the administrative assistants who assisted in conducting the research, and the participants willing to take part in the experiment.