
Introduction
Over the last decade, the trend of natural disasters occurring in Indonesia has increased (BNPB, 2021; Puteri et al., 2018). Hydrometeorological disasters such as floods, landslides, and tornadoes have high incidence. In the 2010-2020 period, the highest number of disaster events (4,941) occurred in 2020 (BNPB, 2021). As one of the most disaster-prone countries globally, Indonesia, through the National Disaster Management Authority (BNPB), has adopted different methods to reduce disaster risk and strengthen resilience (Stanton-Geddes & Vun, 2019). Resilience measurement is needed to determine the resilience of a particular system. Moreover, it is also an important step to reduce the impact of disasters and prepare a system to deal with disturbances and to apply adaptation patterns (Cutter et al., 2010, 2014).
Resilience is not a result-oriented but a process-oriented phenomenon (Cai et al., 2018; Gonçalves & Marques da Costa, 2013; Saja et al., 2018). Therefore, apart from statistical measurement as a result-oriented characterization, dynamic analysis as a process-oriented characterization is needed to describe the dynamic nature of resilience. In addition, resilience measurement is needed to evaluate the baseline conditions of a site and the factors that hinder an adequate response (Kabir et al., 2018). Limited human resources, budget, and time are challenges in realizing regional resilience. This means quick and precise efforts are needed to determine which areas should be prioritized and what dimensions of resilience should be increased. The question is how to build an appropriate model of urban resilience to disasters, since efforts to realize regional resilience will be more effective in view of these limitations. Therefore, it is crucial to develop a spatially-based inclusive resilience measurement framework.
This study aimed to determine indicators for measuring urban resilience to disasters and developed an index-based spatial dynamic model of disaster resilience. This paper also presents the urban resilience's spatial distribution to disasters in Semarang City, Indonesia. The novelty of this research is to contribute to solving problems on the topic of urban resilience, namely the development of an index-based dynamic spatial model of urban resilience to disasters that can measure urban resilience at the sub-district level. The dynamic spatial model of urban resilience was built in a web-based GIS environment. This makes it possible to dynamically conduct spatial simulations of resilience indices and makes it easier for stakeholders who do not have access to GIS applications to carry out assessment of urban resilience. The model results and the spatial distribution of overall and dimensional resilience as well as the indicator values will tell which areas and dimensions should be prioritized to overcome the increasingly destructive impacts of environmental change. Furthermore, the model's ability to dynamically perform
simulations is useful in guiding practitioners' and stakeholders' decision-making to increase resilience in sustainable urban development efforts.
Study area
Semarang is the capital of Central Java and has very high mobility and population density. It had a growth rate of 1.57% in 2019 and a population of 1.653 million people in 2020 (BPS, 2021). Physically and topographically, the city is unique because it consists of hilly, lowland as well as coastal areas. The disaster hazards, identified in relatively complex urban risks, are floods (river and tidal floods), land subsidence, sea-level rise, landslides, fires, strong winds, and droughts (100RCSemarang, 2018; BNPB, 2020; Gunawan et al., 2015; Setiadi & Wulandari, 2016). The trend of disaster incidence has consistently increased from 2011 to 2020. Disasters with the highest probability of occurrence were landslides, with as many as 104 events. At the same time, floods were the disaster type with the most significant impact; they submerged 1,221 houses and heavily damaged 186 (BNPB, 2021).
The city has a geostrategic position, located on the main economic traffic artery of Java Island and is an important development corridor for Central Java. Semarang plays a significant role in the development and growth of Central Java as a main regional transportation node and transit city, specifically due to the presence of ports, land transportation networks (railway and road), and air transportation (BPBD, 2021). The location of Semarang City is presented in Figure 1.
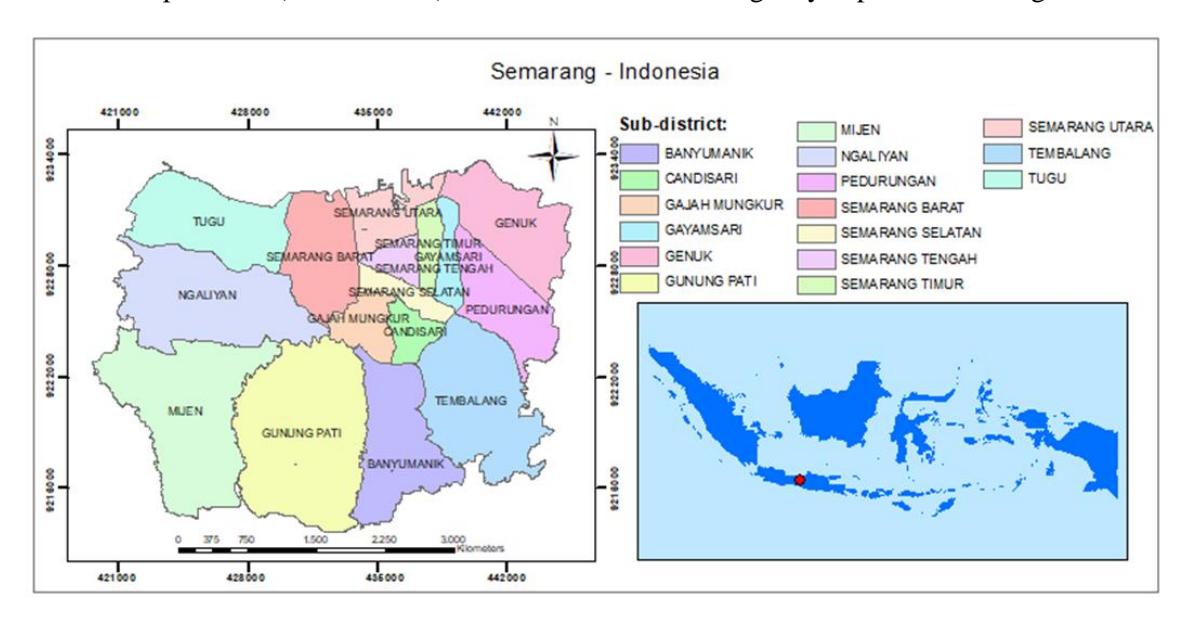
Figure 1. Map of Semarang city.
Research Methods
The data used were collected from various sources in the form of tabular (2018-2021) and spatial data (topographic, disaster, infrastructure, and spatial planning map). The sub-district indicator data were obtained through an online questionnaire among 37 respondents representing 16 sub-districts. Furthermore, data from various related agencies was transformed by converting raw data of various sizes into percentages, ratios, and per capita (Cutter et al., 2010; Narieswari et al., 2019). The spatial analysis was performed using GIS techniques such as overlays, intersections, queries, and spatial joints.
The proposed index-based urban resilience spatial dynamic model is structured in three stages (Figure 2). The first stage consists of the selection of indicators using factor and principal component analysis (PCA) (Mavhura et al., 2021). The output consists of indicators used in calculating the index-based urban resilience. Based on this output, the second stage categorizes and determines the indicators' scores for each sub-district. Finally, the output of the third stage is the index-based city resilience spatial dynamic model.
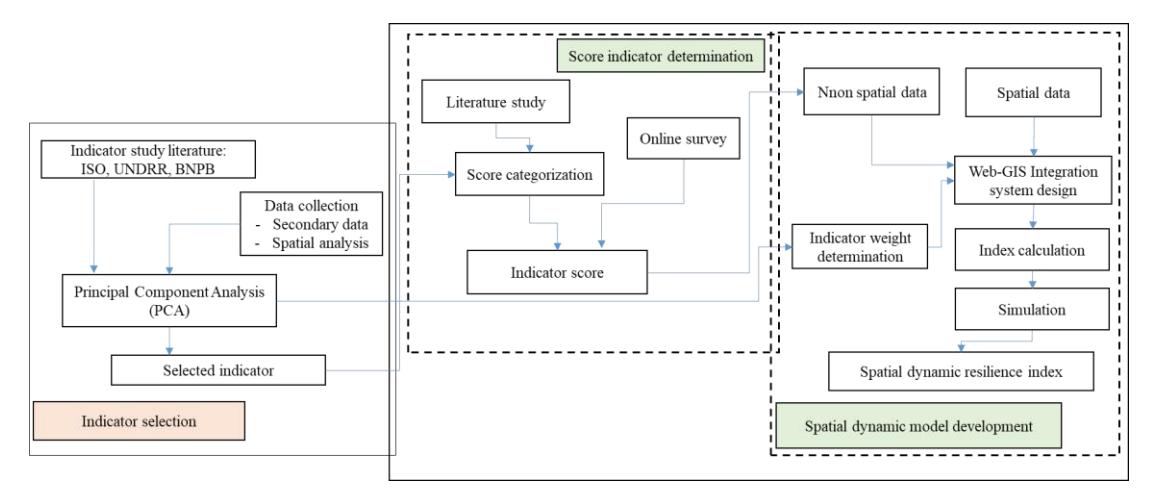
Figure 2. Stages of building a spatial dynamic model of index-based resilience.
Indicator selection
Factor analysis was used to determine the indicators used to prepare the model. It was performed using the Statistical Package for Social Sciences (SPSS) software with the PCA algorithm to reduce the data and group the indicators. The correlation matrix was examined before the analysis by performing Bartlett's Test of Sphericity (BTS), Kaiser-Meyer-Olkin (KMO), and the Measure of Sampling Adequacy (MSA) with p-value <0.05, >0.5, and >0.5 (Fekete, 2010; Hair et al., 2014; Mavhura et al., 2021), respectively. The factor analysis was conducted separately for each dimension by considering the number of samples in each of the sub-districts in Semarang City. To produce an optimum model, based on the factor analysis, 21 indicators from the 51 original ones were selected to measure urban resilience. Table 1 contains descriptions of the 21 indicators, dimensions, data sources, and justifications for using these indicators.
Determination of indicator score
For calculation of the index, each indicator was classified by giving a score range of 0 to 5 based on the questionnaire survey data. A score of 0 represents little or no awareness related to disaster risk reduction or conditions that do not fulfill the city's minimum service standards. A score of 5 represents the ideal city conditions expected or implementing full integration towards disaster reduction (UNDRR, 2017). Category classification for indicators that have a negative effect on resilience (e.g., vulnerable population, people with a disability, unemployed people) was adjusted by reversing the order of the indicators' data values. The highest data value of the indicators, which represents lower resilience, was classified as the lowest score. The lowest data value of the indicators, which represents high resilience, was classified as the highest score.
Table 1. Indicators used
| A WALL AT ALGORDOLD WIND | ||||||||||
|---|---|---|---|---|---|---|---|---|---|---|
| Resilience dimensions | Indicator descriptions | Justification/references | Sources | |||||||
| Social | % vulnerable population | (Cutter et al., 2014; ISO, | ||||||||
| Demography | (PCTVUL) | 2019; Shi et al., 2021) | ||||||||
| Special needs | % pop with disability (PCTDIS) | (Beccari, 2016; ISO, 2019) | Semarang City | |||||||
| Educational | % female school-aged pop | (Normandin et al., 2009; | Government | |||||||
| equity | enrolled in school (PCTFEMSCH) | UNISDR, 2013) | ||||||||
| Health access | number of physicians per 10,000 population (NOPHY) | (Al Rifat & Liu, 2020; Bappenas, 2015; BSN, 2018) | Village Potential- BPS | |||||||
| Economic | % pop enrolled in social | (Beccari, 2016; ISO, 2019; | ||||||||
| Subsidy | assistance programs (PCTSOCAS) | Shi et al., 2021) | ||||||||
| Livelihood/ | % pop living in | (Cai et al., 2016; Kusumastuti | Semarang City | |||||||
| welfare | poverty(PCTPOOR) | et al., 2014) | Government | |||||||
| Housing | % homeownership | (Cai et al., 2018; Cutter et al., | 2018-2021 | |||||||
| capital/asset | (PCTHOME) | 2014; Ji et al., 2021) | ||||||||
| Employment | % unemployed (PCTUNEMP) | (Cutter et al., 2008; Kamh et al., 2016; Shi et al., 2021) | ||||||||
| Infrastructure | ||||||||||
| Building | % building structurally | (ISO, 2019; Shi et al., 2021) | RBI-BIG, | |||||||
| structure | vulnerable to high-risk | Disaster Risk | ||||||||
| hazards (PCTBUILDRISK) | Map-BPBD Semarang | |||||||||
| Electricity | % households with access to | (DasGupta & Shaw, 2015; Shi | Village Potential- | |||||||
| accessibility | electricity(PCTELECTRIC) | et al., 2021) | BPS | |||||||
| Recovery | Number of public schools per | (Cai et al., 2016; Gonçalves & | Semarang in | |||||||
| , | sq. km (NOPUBSCH) | Marques da Costa, 2013) | Figures-BPS Semarang | |||||||
| Medical | health care facility per 1000 | (Al Rifat & Liu, 2020; Cai et | C | |||||||
| capacity | population (NOHEALTH) | al., 2016; Kamh et al., 2016) | Semarang City | |||||||
| Water | % pop with accessed to | (Beccari, 2016; BSN, 2018; | Government | |||||||
| accessibility | improved water sources/ (PCTWATER) | Mavhura et al., 2021) | ||||||||
| Environment | Green open space | (BSN, 2018; Li et al., 2021; | RBI-BIG, | |||||||
| Urban planning | (NOGREEN) | Sajjad et al., 2021) | RTRW-Distaru | |||||||
| % area covered by tree canopy (PCTTREE) | (ISO, 2019; Li et al., 2021) | RBI-BIG, RTRW-Distaru | ||||||||
| % informal settlement area (PCTSLUM) | (BSN, 2018; Shi et al., 2021) | Semarang City Government | ||||||||
| %, population living in slums (PCTPOPSLUM) | (BSN, 2018; DasGupta & Shaw, 2015; UNISDR, 2013) | Village Potential, (BPS) | ||||||||
| Institutional | % pop covered by early | (Gonçalves & Marques da | • | |||||||
| Mitigation | warning systems (PCTEWS) | Costa, 2013; ISO, 2019) | ||||||||
| J | % trained population (PCTTRAIN) | (ISO, 2019; Shi et al., 2021) | Semarang City Government | |||||||
| Disaster | % disaster prepared village | (Kusumastuti et al., 2014; Shi | ||||||||
| awareness | (PCTKSB) | et al., 2021) | ||||||||
| Political | % voter participation | (Al Rifat & Liu, 2020; Cai et | Regional General | |||||||
| engagement | (PCTVOTER) | al., 2018; Cutter et al., 2014; | Election | |||||||
| Huang et al., 2019) | Commission - | |||||||||
| KPUD Semarang | ||||||||||
Development of an index based spatial dynamic model of resilience
The spatial dynamic model of resilience was built in a Web-GIS environment. The data process in the developed model is shown in Figure 3.
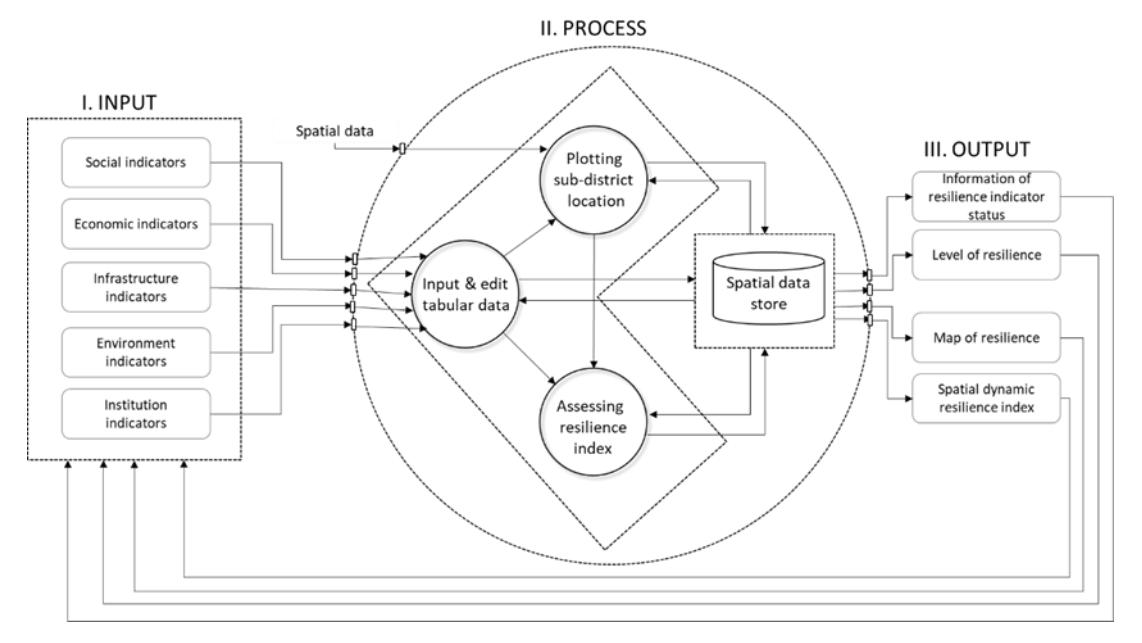
Figure 3. Data flow model
The model consists of data input, process, and output. The data flow begins with the input process for non-spatial indicator class data. Then, it is plotted with spatial data according to area, calculated, and stored in the data store. The output generated from the model is in the form of information on the status of each indicator in five dimensions, the level of sub-district resilience, resilience maps, and spatial dynamic resilience indexes.
The weight of each indicator is calculated based on the optimal arrangement of factors forming urban resilience in the index calculation process (Figure 4) using PCA (weighted by factor scores) (Beccari, 2016). It is calculated based on the value of the loading factor and the value of the rotation sums of squared loading (% of variance) through two stages. The first is the calculation of the weight of each indicator in the factor using the following formula (Bappenas & BPS, 2015):
\[B = \frac{LF}{RLF} x RSSL\] where B is the weighted value, LF is the loading factor, RLF is the average loading factor in one factor, and RSSL is the value of the rotation sums of squared loading (% of variance).
Furthermore, the calculation of the contribution of each indicator in urban resilience is conducted using the following formula (Bappenas & BPS, 2015):
\[b = \frac{B}{IB}\] where b is the contribution value of each indicator, B is the weighted value, and JB is the sum of all weights. The contribution value of each indicator is used as a weight to produce the index.
The index resilience value is obtained from the sum of each indicator score multiplied by the weight of each indicator. In addition, the total index value is the current state of resilience and can be used as a benchmark for urban disaster resilience. The index value ranges from 0 to 100, with a high and low score indicating higher and lower resilience. Furthermore, the index scores are categorized into five classes for visualization and ease of interpretation (Figure 4).
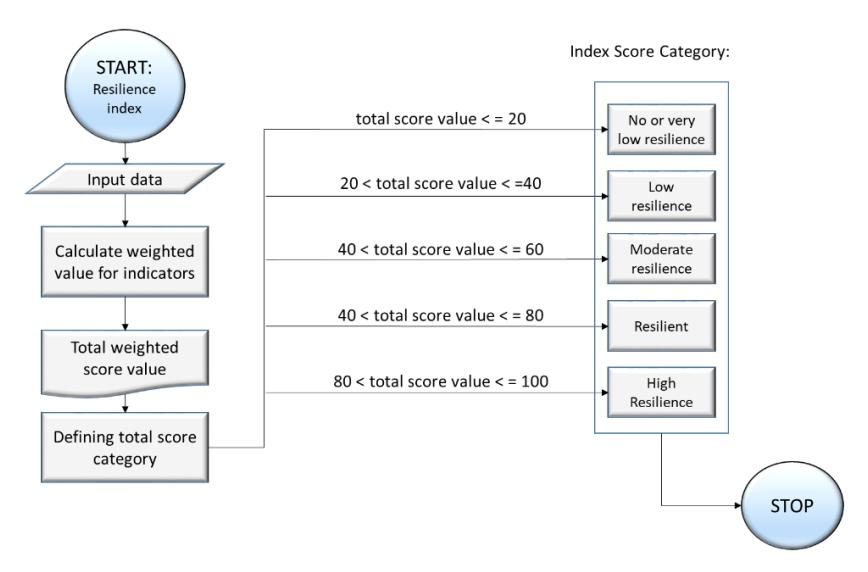
Figure 4. Index calculation and classification rules.
Results and Discussions
Indicator Analysis
The statistical analysis of each dimension resulted in a KMO value greater than 0.5, therefore, the indicators used in the analysis are suitable for PCA. In addition, the PCA model provides >60% variance in each dimension, hence, each indicator is expected to have a contribution to the index. The amount of contribution describes the magnitude influence of the indicator on the dimensions and index. Furthermore, the contribution of each indicator is not determined with the same value or based on a subjective assessment; rather, it is calculated based on the distribution of the statistical analysis data. Table 2 shows the factors, factor loading, variance, and weight of each indicator.
Table 3 shows the scores for each indicator. Analysis of the indicator values showed a substantial variation/heterogeneity among the sub-districts from 0 to 5 in approximately 60%. These include vulnerable population, disability, number of physicians, social assistance program, homeownership, unemployment, building structure, access to improved water, tree cover, slum areas, early warning system, and trained population. Some indicators (7 out of 21) had values below the average of more than 50%, including the female school-age population, unemployment, number of hospitals/residents, green space area, tree canopy, disaster training, and disaster prepared village (Kelurahan Siaga Bencana-KSB). Tree canopy (D2) was the indicator with the most significant variance, showing very diverse conditions between subdistricts.
Dimensions Code Indicator KMO Bartlett loading factor % variance Weight Social A1 PCTVUL 0.655 0.002 0.729 64.039 0.0404 A2 PCTDIS 0.781 0.0432 A3 PCTFEMSCH 0.869 0.0481 A4 NOPHY 0.816 0.0452 Economic B1 PCTSOCAS 0.709 0.000 0.947 70.457 0.0404 B2 PCTPOOR 0.849 0.0432 B3 PCTHOME 0.581 0.0481 B4 PCTUNEMP 0.929 0.0452 Infrastructure C1 PCTBUILDRISK 0.769 0.000 0.849 61.619 0.0480 C2 PCTELECTRIC 0.581 0.0413 C3 NOPUBSCH 0.929 0.0442 C4 NOHEALTH 0.913 0.0490 C5 PCTWATER 0.778 0.0417 Environment D1 NOGREEN 0.563 0.000 0.982 66.337 0.0646 D2 PCTTREE 0.959 0.0631 D3 PCTSLUM 0.947 0.0442 D4 PCTPOPSLUM 0.973 0.0454 Institution E1 PCTEWS 0.708 0.000 0.956 67.727 0.0563 E2 PCTTRAIN 0.832 0.0490 E3 PCTVOTER 0.96 0.0566 E4 PCTKSB 0.426 0.0251
Table 2. Summary of indicator analysis in each dimension
Table 3. Indicator score for each sub-district (the indicator codes are s
| Social | Economic | Infrastructure | Environment | Institution | |||||||||||||||||
|---|---|---|---|---|---|---|---|---|---|---|---|---|---|---|---|---|---|---|---|---|---|
| Sub-district | A1 | A2 | A3 | A4 | B1 B2 | B3 | B4 | C1 | C2 | C3 | C4 | C5 | D1 D2 | D3 | D4 | E1 | E2 | E3 | E4 | ||
| Mijen | 5 | 4 | 2 | 1 | 4 | 3 | 4 | 4 | 4 | 5 | 5 | 1 | 0 | 5 | 5 | 4 | 4 | 4 | 2 | 1 | 2 |
| Gunung Pati | 4 | 3 | 2 | 1 | 2 | 0 | 3 | 4 | 5 | 5 | 5 | 0 | 3 | 5 | 5 | 0 | 0 | 3 | 3 | 1 | 2 |
| Banyumanik | 1 | 1 | 2 | 4 | 3 | 1 | 2 | 2 | 1 | 5 | 5 | 1 | 3 | 4 | 3 | 1 | 0 | 1 | 1 | 1 | 2 |
| Gajah Mungkur | 5 | 2 | 2 | 4 | 5 | 2 | 2 | 2 | 1 | 5 | 5 | 3 | 2 | 3 | 0 | 5 | 5 | 3 | 0 | 1 | 2 |
| Semarang Selatan | 5 | 4 | 3 | 5 | 4 | 2 | 1 | 4 | 3 | 5 | 5 | 3 | 1 | 2 | 0 | 0 | 1 | 0 | 3 | 1 | 2 |
| Candisari | 1 | 5 | 2 | 1 | 5 | 0 | 0 | 2 | 3 | 5 | 5 | 1 | 0 | 2 | 0 | 3 | 3 | 5 | 1 | 1 | 2 |
| Tembalang | 1 | 2 | 1 | 3 | 5 | 1 | 1 | 3 | 1 | 5 | 5 | 1 | 2 | 4 | 0 | 4 | 1 | 0 | 2 | 1 | 2 |
| Pedurungan | 5 | 3 | 2 | 4 | 5 | 2 | 3 | 2 | 3 | 5 | 5 | 1 | 2 | 2 | 0 | 4 | 2 | 0 | 1 | 1 | 2 |
| Genuk | 1 | 1 | 2 | 2 | 3 | 3 | 3 | 1 | 3 | 5 | 5 | 1 | 3 | 3 | 0 | 4 | 4 | 4 | 5 | 1 | 2 |
| Gayamsari | 1 | 1 | 3 | 3 | 1 | 1 | 1 | 0 | 1 | 5 | 5 | 1 | 1 | 2 | 0 | 1 | 2 | 0 | 1 | 1 | 2 |
| Semarang Timur | 3 | 2 | 3 | 4 | 4 | 3 | 1 | 3 | 5 | 5 | 5 | 3 | 4 | 2 | 0 | 2 | 2 | 1 | 1 | 1 | 1 |
| Semarang Utara | 4 | 3 | 1 | 1 | 3 | 1 | 2 | 1 | 5 | 5 | 5 | 0 | 5 | 3 | 0 | 5 | 4 | 5 | 5 | 1 | 2 |
| Semarang Tengah | 1 | 1 | 3 | 5 | 3 | 2 | 3 | 2 | 3 | 5 | 5 | 2 | 3 | 2 | 0 | 1 | 4 | 4 | 5 | 1 | 1 |
| Semarang Barat | 5 | 4 | 2 | 4 | 4 | 0 | 1 | 2 | 2 | 5 | 5 | 1 | 4 | 3 | 0 | 3 | 3 | 1 | 3 | 1 | 2 |
| Tugu | 3 | 4 | 2 | 1 | 4 | 3 | 3 | 2 | 3 | 5 | 5 | 0 | 1 | 5 | 0 | 2 | 2 | 3 | 3 | 2 | 2 |
| Ngaliyan | 4 | 2 | 2 | 2 | 3 | 1 | 3 | 2 | 3 | 5 | 5 | 1 | 3 | 5 | 4 | 4 | 4 | 2 | 1 | 2 | 2 |
Indicators of access to electricity (C2) and public school (C3) (Table 3) had the smallest variance and the most significant average value, which indicates very good and homogeneous conditions in all sub-districts. Meanwhile, indicators for female population enrolled in school and population in poverty, health care facilities, KSB, and voter involvement showed a poor condition, having a maximum indicator value of 3 and an even distribution in all sub-districts. The KSB indicator had the lowest average, at 1.1 out of 5, and a high variance value, indicating improvement priorities.
Spatial dynamic models and spatial distribution of disaster resilience
The modeling results provide an overview of the disaster resilience conditions, which were relatively homogeneous in the moderate resilience class, as shown in Figure 5. From the distribution, 88% of sub-districts had moderate resilience, with a score of 40-60 (Table 4). Mijen had the highest score of 66.69, classified as resilient. Meanwhile, Gayamsari, with a score of 27.79, was classified as low resilience (Figure 5). The total score results showed that approximately 40% of the total sub-districts had a score below the average of less than 49.79.
The model was built to measure the urban resilience of disasters. Referring to the whole process, several outputs are produced from the compiled model. These include information related to the condition of the resilience indicators, the level in each sub-district, and the dynamic resilience index. The urban resilience is monitored and evaluated using these outputs. The developed model is web-based, allowing stakeholders without access to GIS applications to assess urban resilience (Lathrop et al., 2014). The developed model also allows simulating the indicators, therefore, changes made to the score will automatically change the total resilience index and the visualization of the map.
Table 4. Value of total resilience to disasters and value of resilience each dimension
| Sub-district Resilience Score | ||||||||
|---|---|---|---|---|---|---|---|---|
| Social | Economic | Infrastructure | Environment | Institutional | Total | |||
| Mijen | 58.35 | 74.28 | 59.63 | 91.75 | 45.96 | 66.69 | Resilient | |
| Ngaliyan | 49.10 | 42.93 | 66.51 | 85.95 | 34.74 | 57.13 | Moderate | |
| Semarang Utara | 43.44 | 32.17 | 78.14 | 34.55 | 67.70 | 56.06 | Moderate | |
| Gunung Pati | 48.88 | 44.93 | 70.70 | 58.77 | 45.18 | 54.47 | Moderate | |
| Gajah Mungkur | 63.87 | 50.54 | 62.97 | 59.07 | 29.47 | 53.61 | Moderate | |
| Semarang Tengah | 65.61 | 44.82 | 74.60 | 28.61 | 26.01 | 52.58 | Moderate | |
| Genuk | 30.53 | 48.76 | 66.51 | 42.69 | 61.68 | 52.39 | Moderate | |
| Tugu | 49.20 | 57.89 | 54.70 | 46.22 | 51.23 | 51.87 | Moderate | |
| Semarang Timur | 60.18 | 53.24 | 87.54 | 28.38 | 19.99 | 50.55 | Moderate | |
| Semarang Barat | 73.64 | 30.44 | 65.95 | 42.58 | 33.15 | 49.20 | Moderate | |
| Semarang Selatan | 84.18 | 53.13 | 67.81 | 16.07 | 27.13 | 49.01 | Moderate | |
| Pedurungan | 68.76 | 55.68 | 62.79 | 36.52 | 16.65 | 48.14 | Moderate | |
| Candisari | 44.96 | 28.82 | 55.35 | 36.63 | 46.75 | 42.68 | Moderate | |
| Banyumanik | 40.74 | 37.79 | 57.95 | 45.27 | 22.67 | 41.64 | Moderate | |
| Tembalang | 35.08 | 45.30 | 54.23 | 44.23 | 21.89 | 40.89 | Moderate | |
| Gayamsari | 41.07 | 14.38 | 50.51 | 24.32 | 16.65 | 29.79 | Low | |
| Average | 52.70 | 44.93 | 64.51 | 47.13 | 37.49 | |||
| Variance | 211.20 | 197.47 | 91.34 | 410.10 | 280.07 | |||
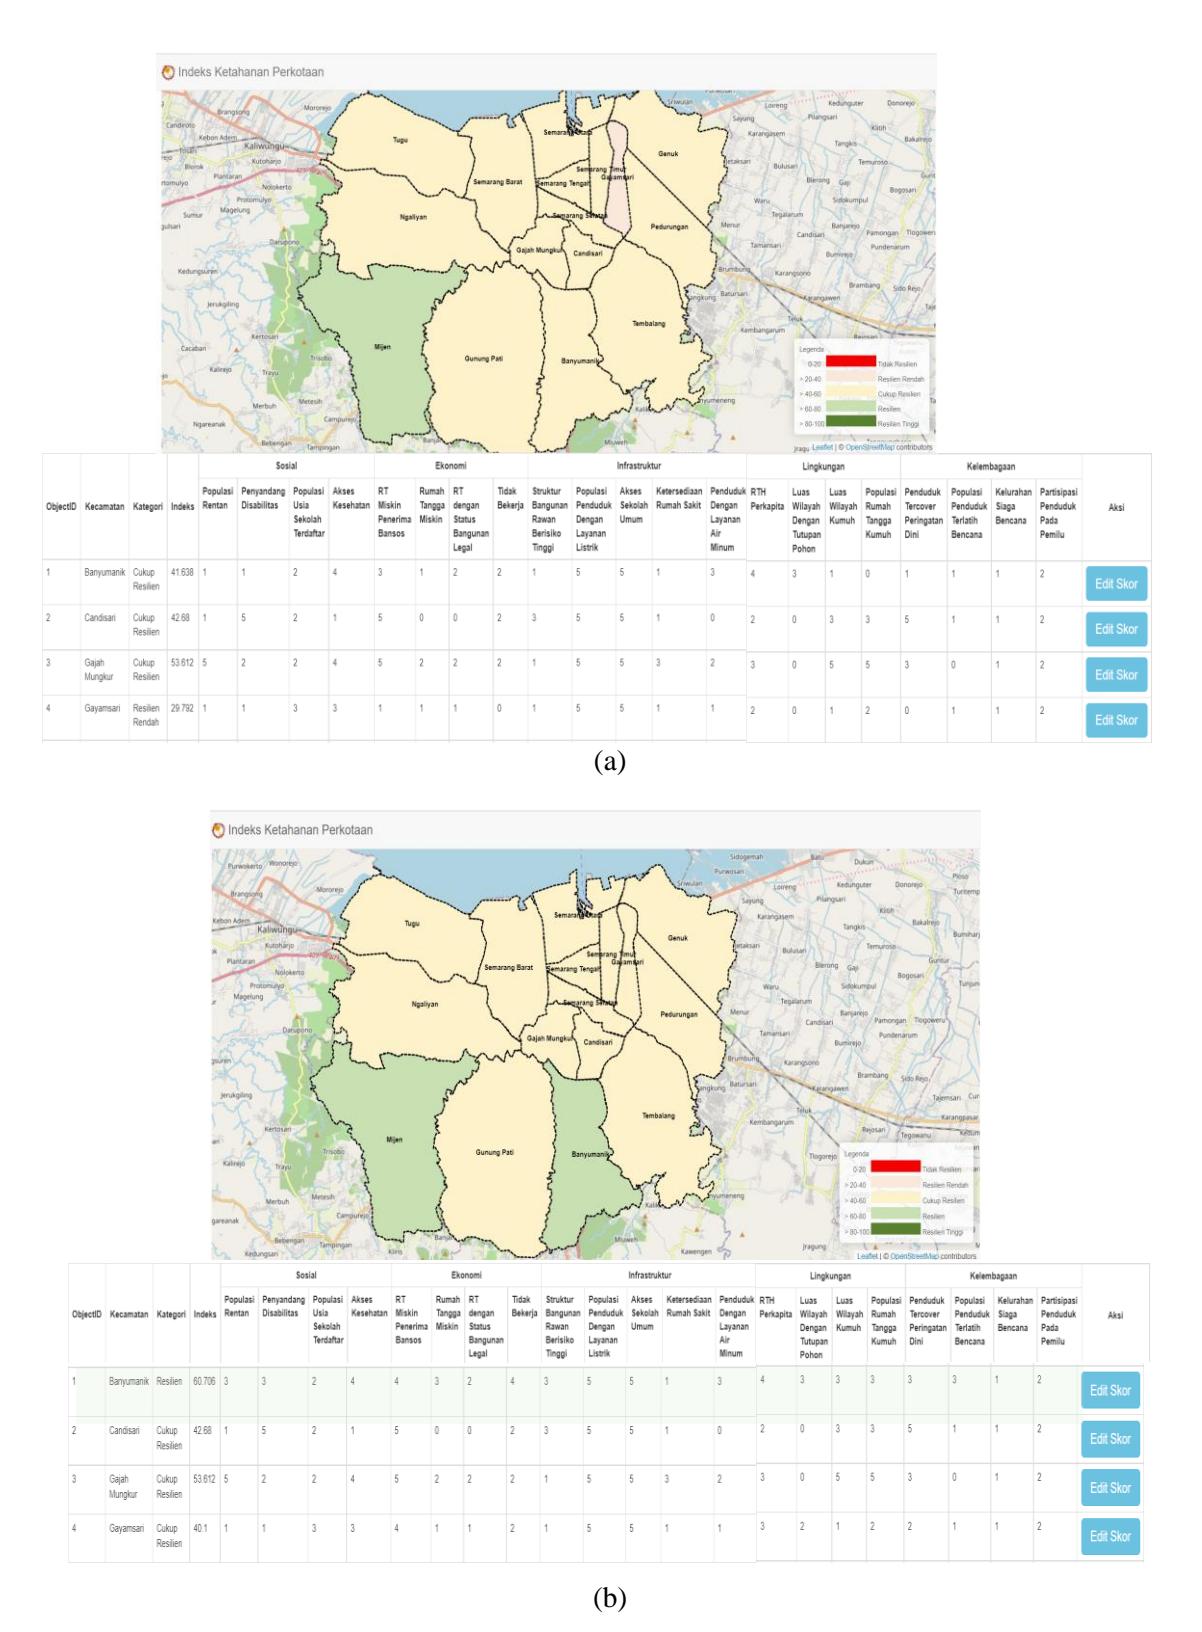
Figure 5. Spatial distribution of total urban resilience: (a) spatial distribution of the baseline index, (b) example of the simulation and spatial distribution of the resilience index after simulation by changing the score of several indicators.
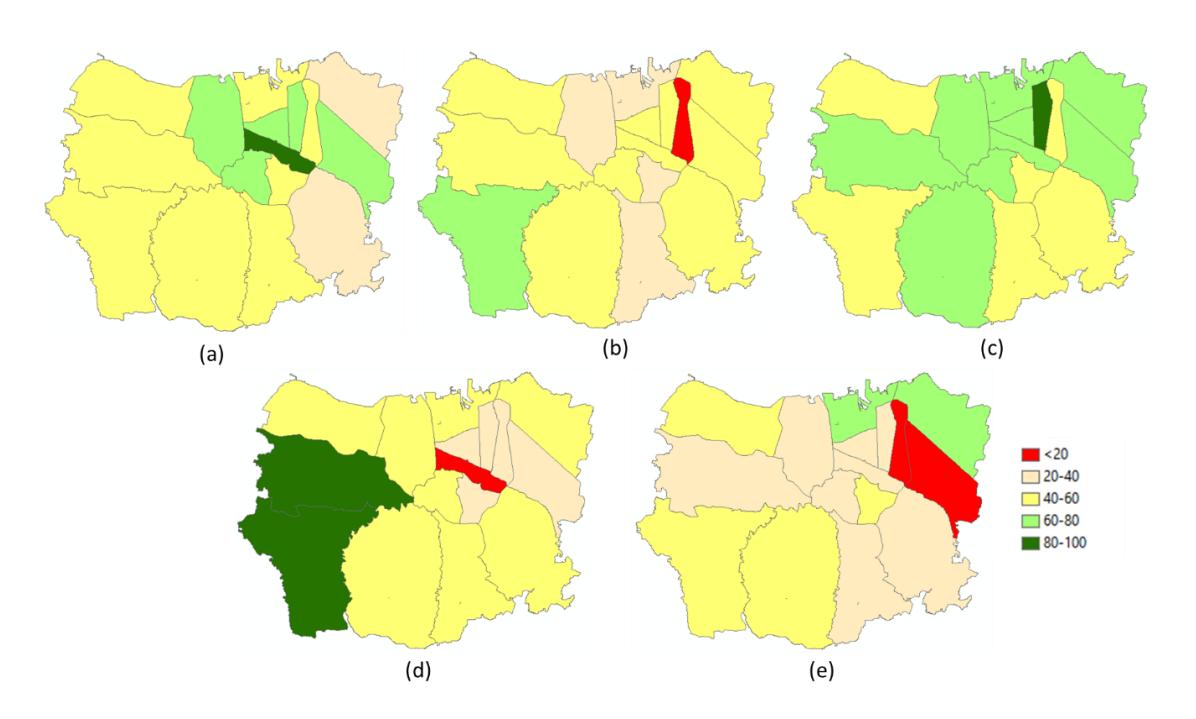
Figure 6. Resilience scores in five classes for each dimension: a) social; b) economics; c) infrastructure; d) environment; e) institutional.
The main display of the spatial model is a resilience map equipped with information related to the total resilience index of each sub-district and the value of each indicator. Users can zoom in and out on the map and obtain information regarding the name of the sub-district, the total index, the category, and the status according to each indicator using the information tool. Users can also simulate the resilience index by changing the values using the Score Edit menu. The model will automatically calculate and change the total index value, category, and visualization on the map. This will be very helpful for related parties, specifically the Semarang City government, in increasing resilience to disasters. Furthermore, the spatial dynamic simulation will automatically prioritize the indicators to be improved.
Describing the resilience index based on five dimensions allows further exploration of the geographic trends of data, as shown in Figure 6. The map shows what dimensions affected the index resilience in each sub-district. For dimension scores, approximately 50% of sub-districts had scores below the average scores for the social, infrastructure, environmental, and institutional dimensions. Moreover, approximately 40% of sub-districts had scores below the average for the social dimension (Table 4). The analysis results showed that none of the subdistricts achieved the highest possible score, both for the dimension and the total score (100).
The environmental dimension had the most significant variation in its scores, indicating great inequality or heterogeneity among sub-districts. The infrastructure dimension had the highest average and minimum score. It had the lowest score variation value, which indicates that the condition is very good and evenly distributed in each sub-district. Finally, the institutional dimension had the lowest average and maximum value (67 out of 100), indicating conditions that require special attention.
The spatial distribution of resilience on each dimension showed considerable spatial heterogeneity in the north-middle area, as can be seen in Figure 6. Concerning the social and infrastructure dimensions, the area in the city center (north-middle area) had better resilience than the hilly areas in the south (Figures 6a and 6c). On the other hand, these areas had poor economic, environmental, and institutional resilience. The north-middle area is the downtown area, where economic growth occurs and the population is concentrated, so it has good infrastructure services. The attractiveness of being a city center causes economic, industrial activities, and high population concentration. This means it has a large number of workers as well as high unemployment. Concerning the environmental dimension, the high environmental burden causes environmental conditions to decline due to the loss of green area, the emergence of slums, and high-density and irregular buildings. Pressures on the environment cause land subsidence due to groundwater exploitation, waste problems, and an increasing frequency of disasters such as rob (tidal floods), floods, and fires. The red color in Figures 6b, 6d and 6e, indicates the condition of the sub-districts with low resilience. The conditions of infrastructure resilience in the north-central part (sub-districts of Ngaliyan, West Semarang, central-east-south Semarang, Gayamsari, and Pedurungan) are opposite to institutional resilience. Infrastructure resilience was better than institutional resilience, colored green in Figures 6c and 6e. The opposite condition in the area shows that social resilience was higher than institutional resilience, as shown in Figures 6a and 6d. Despite the significant heterogeneity in the city center, all dimensions of resilience showed relatively high and homogeneous conditions in the south-west region (Ngaliyan, Mijen, and Gunungpati sub-districts). Meanwhile, the resilience conditions were relatively low and homogeneous on every dimension for the south-east area.
The institutional dimension had the lowest average value. Generally, areas with a low to moderate total resilience index had low institutional resilience, therefore, immediate action is needed according to all indicators.
Promoting resilience-based risk management
The spatial distribution of resilience (of indicators, dimensions as well as overall) and the identification of hotspots facilitate the prioritization process to manage resilience overall and across all dimensions and indicators. For example, the average value of resilience in the institutional dimension, which was the lowest among all dimensions (average value of 37.49 out of 100), indicates a condition that should be addressed immediately. This is because the dimension is crucial in realizing resilience (Jha et al., 2013). Institutions as a priority for building resilience is in line with the study conducted by Narieswari et al., (2021). Institutional strengthening is one of the main processes targeted in developing urban resilience (BPBD, 2021; Sitadevi, 2016).
Furthermore, the Gayamsari Sub-district, had the lowest resilience score (Figure 5). A study by Narieswari et al., (2019) also stated that Gayamsari is one of the sub-districts in Semarang City that have low resilience conditions. This sub-district may be at risk of worse resilience conditions when appropriate steps are not given priority. The spatial distribution presented in Figures 5 and 6 supports this.
This index-based spatial model of disaster resilience benefits government stakeholders to support the strategic interests of the city at a broader level in natural disaster management. The index can be used as a benchmark for urban disaster resilience and measurable changes in the future. In addition, this index-based model can be a tool to quickly identify areas with high and low resilience in Semarang City. Furthermore, it can identify coping and adaptive capacity (Sajjad, 2021).
Action focus and policy implementation
Identifying areas with low resilience to natural disasters is important for policymakers (Frigerio et al., 2018; Sajjad et al., 2021). Spatial distribution capability in identifying resilience hot spots facilitates disaster risk reduction actions at the desired level. The urban resilience index highlights sub-districts with low resilience that require special attention. These results can be integrated with existing disaster risk reduction activities at the sub-district level.
Increased resilience can also be conducted in a focused manner by analyzing the indicators (Table 3). For example, the results show low resilience scores for indicators A3 and B2 in the economic dimension, C4 in the infrastructure dimension, D2 in the environmental dimension, and E1, E3, and E4 in the institutional dimension. Therefore, increasing resilience on these indicators will effectively increase the total resilience.
Specifically, the spatial distribution of indicators and dimensions can be used as a reference in simulations to increase indicator values. This will effectively increase overall resilience in each sub-district by considering the weight of the indicators. For example, indicators D2, E1, and E4 had reasonably high weights, at 0.0631, 0.0563, and 0.0566, respectively (Table 2). Therefore, program efforts to increase the scores on these indicators will effectively increase the total resilience.
The main advantage is to propose a comprehensive selection of indicators and models to dynamically visualize urban resilience's spatial distribution. Resilience is dynamic, in harmony with social, economic, and environmental dynamics (Rus et al., 2018; Sajjad, 2021). The proposed model can visualize the dynamic conditions of resilience through simulation. Thus, it allows the formulation of strategies and the evaluation of policies to implement resilience enhancement with reasonable efforts to improve city conditions.
The application of this urban resilience measurement model has several challenges, such as the availability and consistent quality of data to represent indicators at the sub-district level. Generally, sectoral thematic data are available regularly and uniformly at the city and provincial scales but not at the sub-district scale. In addition, the number of samples for the sub-districts is smaller than indicators analyzed, therefore, the analysis is carried out on each dimension. For future studies, similar indicators should be used based on the availability of existing data. The study and field measurements should include simulation scenarios and policy suggestions to improve the application of future study models (Zhang, 2020). Combining resilience results with hazard data/maps for a more comprehensive risk measurement of single or multiple hazards is also a consideration for future research.
Conclusion
This study developed a replicable and robust baseline indicator model to measure and visualize the spatial distribution of resilience in Semarang City. An index system and a web-GIS (indexbased spatial dynamic model) were used to determine the urban resilience and spatial distribution. Furthermore, the developed model allows dynamic spatial simulation of the urban resilience index at a sub-district level and can used by stakeholders who do not have access to GIS applications to carry out assessments of urban resilience.
The factor analysis resulted in the selection of 21 indicators to measure resilience to disasters, grouped in social, economic, infrastructure, environmental, and institutional dimensions. The results of index-based spatial modeling showed that 88% of sub-districts had a score in the moderate class. Mijen had the highest resilience index value (66.69), categorized in the resilient class. On the other hand, Gayamsari had the lowest resilience index value (29.79), classified in the low-class category. Therefore, it is a priority to increase urban resilience to disasters in Gayamsari. The spatial distribution of resilience in each dimension showed considerable spatial heterogeneity in the coastal and land areas (city center), which had better resilience in the social and infrastructure dimensions than the hilly areas. In the west, the hilly areas had relatively high resilience, while in the east, they had relatively low resilience on each dimension. The spatial distribution of resilience and the model's ability to dynamically perform simulations are useful in providing a quick overview of the condition and determining priorities for increasing resilience in supporting disaster risk reduction programs.
Acknowledgements
We acknowledge the Ministry of Research and Technology (Kemenristek/BRIN) and Geospatial Information Agency (BIG) for providing a doctoral fellowship to the first author for undertaking this study.