
Introduction
Slumification is a critical problem that big cities are confronted with, not only in Indonesia but all around the world. Slum areas are described as neglected parts in the development of an urban environment, where the living conditions and livelihoods of the people are far below ideal levels. The management of such residential areas is included in national and international development documents referring to the Sustainable Development Goals (SDGs) goal 11, goals 11.1. In addition, the 100-0-100 program, which was run for four years from 2015 to 2019 and included programs for 100% access to safe drinking water, 0% of urban slum areas, and 100% access to proper sanitation, has not been fully achieved.
Based on Roberts (2019), insufficient funds to alleviate the problem of slum settlements are still a problem. The concept of a visual improvement program for slums in urban areas is considered an affordable solution that is participatory-collaborative and that many cities in Indonesia have adopted, such as Jodipan-Ksatrian Village, Malang (Sarli, P.W., 2017), Code Village, Yogyakarta (Sarli, P.W., 2018), Wonosari Village, Semarang (Soewondo, P., 2020) and Sindulang Village, Manado (Soewondo, P., 2020). Visual improvement of slums is expected to eliminate the impression of a slum in the hope that further environmental management will be consciously carried out by the people in the area to maintain the physical appearance of their settlement.
This research was conducted to identify the impact of the visual improvement programs implemented in two slum areas in Indonesia on the behavior of sanitation management and to identify factors that influence sanitation management so that strategies for optimizing sanitation management can be planned to support the sustainability of sanitation management as the basis for visual improvement programs of slums.
Description of Study Area
The study areas in this research were Bekelir Rainbow Village, Tangerang and Code Rainbow Village, Yogyakarta. The existing locations of Bekelir Rainbow Village, Tangerang and Code Rainbow Village, Yogyakarta are shown in Figure 1 and Figure 2 below.
1. Bekelir Rainbow Village, Tangerang
Figure 1. Location map of Bekelir Rainbow Village.
Bekelir Rainbow Village is located in Tangerang District, Tangerang City, Banten. This village has an area of 7,225 m2 and is directly adjacent to Kisamaun Street in the north, Perintis Kemerdekaan Street in the east, Kalipasir Indah Street and Cisadane River in the south, and SMEA Street in the west. The entrance to Bekelir Village is located on Kalipasir Indah Street and Perintis Kemerdekaan Street, with the main entrance located on Kalipasir Indah Street, which is directly adjacent to the Cisadane River and Cisadane River Tourism. This Bekelir Rainbow Village is a unitary area of Hamlet (Rukun Warga/RW) 01, Tangerang District, which consists of four neighborhoods (Rukun Tetangga/RT).
To support Bekelir Rainbow Village as an environmentally friendly village, there are several public facilities in Bekelir Rainbow Village, including public toilets, waste banks, Reuse– Reduce–Recycle (3R) areas of residents' waste and a monitoring post for Cisadane River, which is part of Cisadane River Tourism. The area outside Bekelir Rainbow Village is also filled with angkringan to support Bekelir Rainbow Village as a tourist village. All houses in Bekelir Rainbow Village are permanent houses built with brick wall materials, tiled floors, and red tiled roofs.
2. Code Rainbow Village, Yogyakarta
Figure 2. Location map of Code Rainbow Village.
Code Rainbow Village is located in Gondokusuman District, Special Region of Yogyakarta. This village has an area of 2,152 m2 and is directly adjacent to Jendral Sudirman Street in the north, Faridan M Noto Street in the east, Prau Street in the south, and Kali Code in the west. The entrance to Code Rainbow Village is located on Jendral Sudirman Street. Code Rainbow Village is a unitary area of Hamlet (Rukun Warga/RW) 01 Gondokusuman District, which consists of one neighborhood (Rukun Tetangga/RT).
The name Code Village was taken from the name of the river directly adjacent to this village, namely the Code River. According to the Housing Office of the Special Region of Yogyakarta, the people who live in Code Rainbow Village do not own the land they live on; the land belongs to the Ngayogyakarta Sultanate, which has the same position as the governor in other regions. Some of the public facilities in Code Rainbow Village include public toilets, waste banks, and community meeting halls, which are used for several purposes, such as regular community meetings, socialization/counseling events and so on.
Description of Visual Improvement Program
1. Bekelir Rainbow Village, Tangerang
Bekelir Rainbow Village was originally a slum area called Babakan Village. Initially, this village was a slum village, with many criminal acts and many disease outbreaks, and a place for buying and selling drugs. In 2015, the Ministry of Public Works and Housing, the Development Planning Agency and the Tangerang City Health Office stated that Babakan Village was a medium category slum village. This was finally recognized by the Tangerang City government and together with the people of Babakan Village they planned to make improvements to the village to eliminate the impression of a slum and improve people's living standards.
The idea of becoming a 'rainbow village' in Babakan Village was initially planned by the community of Hamlet (Rukun Warga/RW) 01 and the Head of Hamlet 01 of Babakan Village, after which representatives of the Tangerang City government, appointed by the mayor of Tangerang to carry out improvements in Babakan Village, compiled the improvement concept and presented it to the mayor of Tangerang. The concept of improvement in Babakan Village also received assistance through the Corporate Social Responsibility (CSR) program by PT. Pacific Paint, which produces paint under the brand name Pacific Paint.
2. Code Rainbow Village, Yogyakarta
Prior to 1988, the dwellings in Code Village were made of cardboard with only fifteen families inhabiting the area. Initially, the residents of Code Village were scavengers who built a nonpermanent house under the Gondolayu Bridge, which developed into Code Village. Even in 1988, the Yogyakarta provincial government planned to evict the village, but this was successfully opposed by Romo Mangun. Romo Mangun (1929-1999) was an important figure in the establishment of Code Village. Romo Mangun was a socialist, a writer, and an architect, who argued that the people who were living under the Gondolayu Bridge also had the right to housing.
In 1988-1991, Romo Mangun together with several of his colleagues planned to revamp Code Village. This improvement was carried out by rebuilding the settlement in Code Village to discourage the government's plan to evict the area so that the residents' right to occupy Code Village would be recognized by the Ngayogyakarta Sultanate without having a certificate of ownership. The redevelopment of the settlement was carried out by building semi-permanent houses made of bricks and bamboo. The design of the houses in Code Village prioritized the architectural style of Yogyakarta to maintain the local cultural values of Yogyakarta.
Until 2015, Code Rainbow Village had been inhabited by 64 households and the coloring of the houses was done based ont the concept of a cultural village by the addition of murals with social and health subjects. In 2017, PT. Sampoerna, Tbk carried out a Corporate Social Responsibility (CSR) program by doing a thorough coloring of the village to eliminate the impression of a slum, namely painting all houses in Code Village, from the walls to the roof. The initial purpose of the coloring carried out by PT. Sampoerna, Tbk was to benefit the company through the CSR program, but after the painting was completed, Code Village became more widely known to the public and began to get a lot of attention from various parties, including the regional government, academics, and the general public.
Methodology
This research is part of a series of studies on rainbow villages in Indonesia. The research was conducted using non-experimental quantitative methods to collect data that could further explain the variables measured in the study (B. Christensen, 2007). This study aimed to understand the differences between two community groups in rainbow villages that have different settlement characteristics in order to be able to identify responses to their visual improvement programs.
In this study, the scope of sanitation management was domestic wastewater management and solid waste management. The research was conducted by first identifying the existing condition of sanitation management, which was carried out using the Knowledge, Attitude and Practice survey (KAP survey) approach. Then, the impact of the visual improvement programs on sanitation management based on the Theory of Planned Behavior construct was identified. Next, the impact of the visual improvement programs on sanitation management was the basis for identifying the optimization strategy for achieving sanitation management sustainability, which was formulated using the theoretical model line method (Structural Equation Modeling method) on technical and non-technical aspects of sanitation management.
Data Collection
In this study, the sampling technique used was cluster sampling. The required sample size was calculated using the Yamane equation (Ariola, 2006):
\[n = \frac{N}{1 + Ne^2} \tag{1}\]
Description:
n = sample size N = population size e = margin of error
Based on the data obtained, the number of heads of families (KK) in Bekelir Rainbow Village, Tangerang was 392 households, while in Code Rainbow Village, Yogyakarta it was 64 households. Thus, based on the calculation of the Yamane formula at a 90% confidence level, the required number of samples in Bekelir Rainbow Village, Tangerang was 81 households while in Code Rainbow Village, Yogyakarta it was 64 households.
Data Processing
1. Knowledge, Attitude and Practice (KAP) Survey
This research started by conducting a KAP survey to provide a general description of the sanitation management in the two villages as the study areas before and after the visual improvement programs were implemented. This survey was also conducted to identify problems in sanitation management that still arose after the visual improvement programs were implemented.
2. Identifying the Impact of the Visual Improvement Program on Sanitation Management
After the general description of the sanitation management before and after visual improvement programs was formulated, the next step was to identify the impact of the visual improvement
programs on the sanitation management using the Theory of Planned Behavior construct, which explains that individual behavior is formed because of intention, where the intention is influenced by the existence of attitudes, subjective norms, and perceived behavioral control (Ajzen, 1991). These factors were then further analyzed using the Pathway Analysis method, which is an extended regression model used to test the alignment of the correlation matrix with two or more causal relationship models (D. Garson, 2003).
Each dimension of the Theory of Planned Behavior construct, hereinafter referred to as the endogenous latent variables, is explained by several exogenous latent variables. These exogenous latent variables were identified based on a preliminary survey conducted before data collection was carried out. Based on a literature review of previous studies (I. Kusumayanti, 2022; Soewondo, P., 2020), data were collected on variables that could explain each dimension of the endogenous variables. The exogenous variables are listed in Table 1.
| Table 1. Research variables for Theory of Planned Behavior construct. |
|---|
| Exogenous Latent Variables |
| Endogenous | Exogenous Latent Variables | ||||
|---|---|---|---|---|---|
| Latent Variables | Domestic Wastewater Management | Solid Waste Management | |||
| Attitude towards the behavior | - Perception of risk of harm caused by environmental pollution - Perception of risk of harm caused to public health - Public knowledge related to wastewater management | - Perception of risk of harm caused by environmental pollution - Perception of risk of harm caused to public health - Public knowledge related to solid waste management | |||
| Subjective norm | - Government regulations - Family - Neighbor (local community) - Youth organization - Family Welfare Empowerment Organization - Head of neighborhood - Head of hamlet - Counseling/socialization | - Government regulations - Family - Neighbor (local community) - Youth organization - Family Welfare Empowerment Organization - Head of neighborhood - Head of hamlet - Counseling/socialization | |||
| Perceived behavior control | - Availability of wastewater technology facilities - Visual improvement program in the village area | - Availability of solid waste technology facilities - Visual improvement program in the village area | |||
The research design used to identify the impact of the visual improvement programs on sanitation management was a correlational design. The variables used were: attitude towards the behavior, subjective norm, perceived behavioral control as well as intention and behavior in domestic wastewater management and solid waste management, with a numerical interval measurement scale and data distribution not normal, so that data processing was carried out using the Spearman Rho correlation method with the following equation:
\[\rho = 1 - \frac{6 \, \Sigma b i^2}{n(n^2 - 1)} \tag{2}\]
Description:
ρ = Spearman Rho correlation coefficient
bi = Xi – Yi variable data ranking
n = number of respondents
3. Identifying Optimization Strategy for Sustainability of Sanitation Management
After knowing the impact of the visual improvement programs on sanitation management, the next step was to identify the optimization strategy for sanitation management sustainability, which was formulated by first collecting data on the sustainability factors of sanitation management based on the study. The literature to be reviewed was then formulated using the Structural Equation Modelling (SEM) method to develop the model into a database of variables for sanitation management sustainability as the basis for optimization strategies that can be applied based on approaches towards several aspects of sanitation management sustainability.
Table 2. Research variables for sustainability factors of domestic wastewater management.
| Domestic Wastewater Management | |||
|---|---|---|---|
| Exogenous Latent Variables | Observation Variables | References | |
| - System durability | Setiawati (2013), Paramita (2009), Bell, S. (2008) | ||
| Technical aspect | - Ease of obtaining spare parts | Setiawati (2013), Masduqi (2010), Gaulke (2009) | |
| - Ease of operation | Setiawati (2013), Masduqi (2010), Massoud (2009) | ||
| - Environmental protection regulation | Setiawati (2013), Pushpangadan (2008) | ||
| Regulatory & institutional aspect | - Environmental protection sanction | Setiawati (2013), Werner (2009), Pushpangadan (2008) | |
| - Authorized institutions | Pushpangadan (2008) | ||
| Socio-cultural | - Local capacity | Setiawati (2013), Singhirunnusorn (2009), Flores (2008) | |
| aspect | - Community acceptance | Setiawati (2013), Castillo (2016), Werner (2009) | |
| - Local cultural suitability | Setiawati (2013), Castillo (2016), Werner (2009) | ||
| Financial & | - Investment cost | Setiawati (2013), Werner (2009), Muga (2008) | |
| economical | - Operational and maintenance costs | Setiawati (2013), Paramita (2009) | |
| aspect | - Affordability for the local community Setiawati (2013), Flores (2008) | ||
| Environmental | - Do not pollute water resources and environment | Setiawati (2013), Ajayi (2012), Bradley (2002) | |
| impact | - Minimize waste | Setiawati (2013), Pushpangadan (2008) | |
The research variables used to identify the sustainability factors of sanitation management as the basis for formulating an optimization strategy for sanitation management are listed in Table 2 and Table 3.
The research design employed in the identification of sanitation management optimization strategies was a correlational design using the Structural Equation Modeling method. The variables used were technological aspects, regulatory and institutional aspects, financial and economic aspects, socio-cultural aspects and environmental impact aspects, which were used to measure the sustainability of the domestic wastewater management and the solid waste management with a numerical interval measurement scale and data distribution not normal, so that data processing was performed using the Partial Least Square–Structural Equation Modeling (PLS–SEM) method. The equations of the design model were as follows:
\[\eta = \gamma 1\xi 1 + \gamma 2\xi 2 + \gamma 3\xi 3 + \gamma 4\xi 4 + \gamma 5\xi 5 + \zeta \tag{3}\]
Description:
η = exogeneous variable ξi = endogeneous variable
γi = coefficient of influence of exogeneous variable on endogeneous variable
ζ = error variance
Table 3. Research variables for sustainability factors of solid waste management.
| Solid Waste Management | |||
|---|---|---|---|
| Exogenous Latent Variables | Observation Variables | References | |
| - System durability | Muntazah (2015), Sidique (2010) | ||
| Technical aspect | - Ease of procurement facilities | Wulandari (2017), Ma, J. (2017) | |
| - Ease of operation | Wulandari (2017), Sidique (2010) | ||
| Regulatory & | - Environmental protection regulation | Purnaweni (2014), Moriguchi (2009) | |
| institutional | - Environmental protection sanction | Purnaweni (2014), Moriguchi (2009) | |
| aspect | - Authorized institutions | Xiao, L. (2017), Purnaweni (2014), Ogwueleka (2009) | |
| - Local capacity | Wulandari (2017), Muntazah (2015), Ridley (2011) | ||
| Socio-cultural aspect | - Community acceptance | Muntazah (2015), Masduqi (2010) | |
| - Local cultural suitability | Wulandari (2017), Bell, S. (2004) | ||
| Financial & | - Investment cost | Muga (2008), Mucherjee (2003) | |
| economical | - Operational and maintenance costs | Paramita (2009), Flores (2008) | |
| aspect | - Affordability for the local community | Burhanuddin (2021), Martinawati (2016) | |
| Environmental | - Do not pollute water resources and environment | Diniaty (2019), Dompak (2014), Purnaweni (2014), Sankoh (2013) | |
| impact | - Minimize single-use products | Diniaty (2019), Dompak (2014), Ramayah (2012) | |
Results
Analysis of Existing Sanitation Management Condition
Analysis of the existing conditions of the sanitation management at the research locations was needed to get an overview of the existing condition of the system used by the community and to identify gaps or problems that were found in the research locations related to the condition of the sanitation management. The analysis of the existing sanitation conditions in this study included the domestic wastewater management conditions and the waste management conditions.
To describe the condition of the domestic wastewater management, an analysis was carried out by making a comparison between an overview of the management conditions before the visual improvement program and an overview of the management conditions after the visual improvement program. The comparison between the descriptions of domestic wastewater management is shown in Figure 3 to Figure 6.
In general, for sanitation and hygiene activities in the river, in Bekelir Rainbow Village, Tangerang, there was a decrease of 94.2%, while in Code Rainbow Village, Yogyakarta there was a decrease of 4.7% after the visual improvement program. For septic tank ownership, in Bekelir
Rainbow Village, Tangerang, there was an increase of 10.6%, while in Code Rainbow Village, Yogyakarta, there was an increase of 22.8% after the visual improvement program.
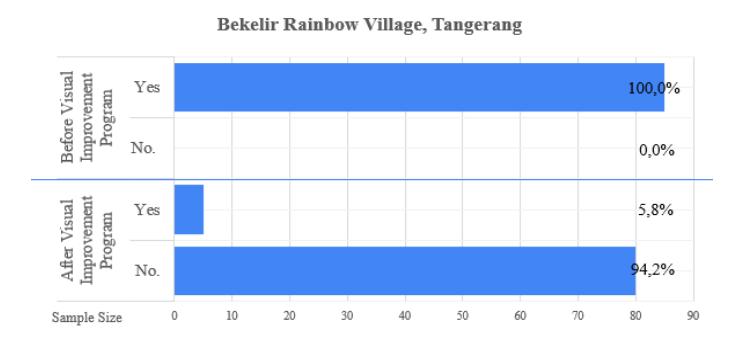
Figure 3. Overview of sanitation and hygiene activities in the river in Bekelir Rainbow Village.
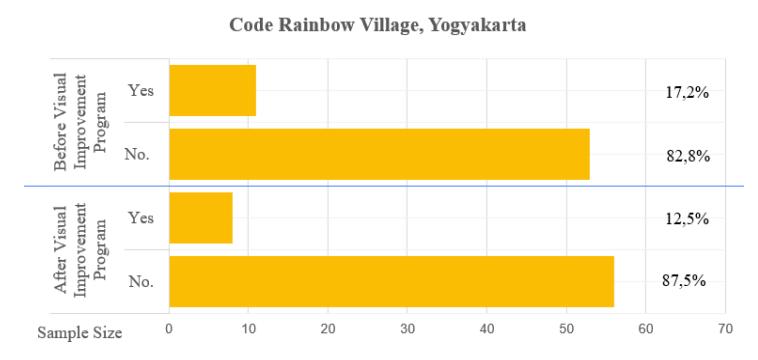
Figure 4. Overview of sanitation and hygiene activities in the river in Code Rainbow Village.
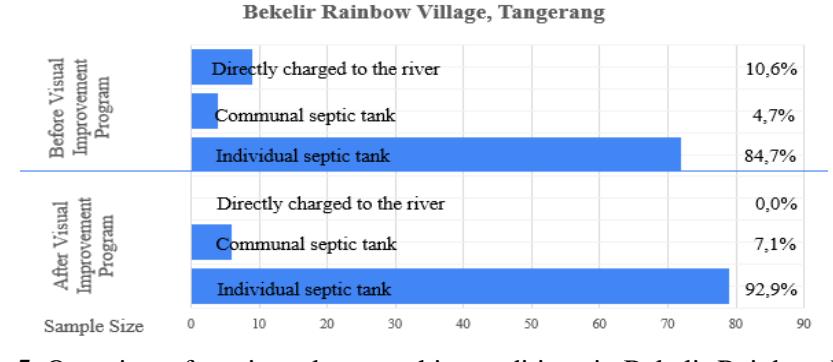
Figure 5. Overview of septic tank ownership conditions in Bekelir Rainbow Village.
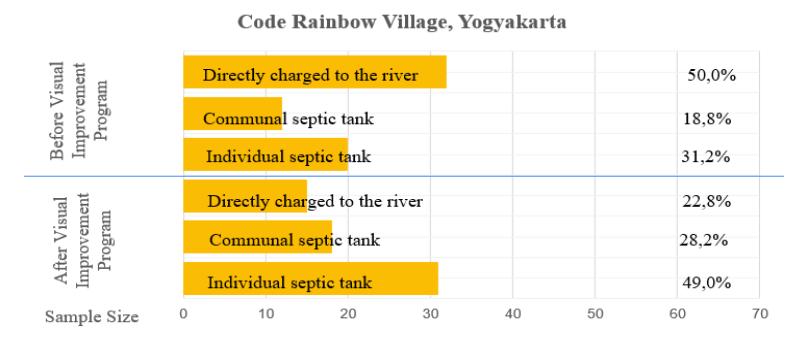
Figure 6. Overview of septic tank ownership conditions in Code Rainbow Village.
To describe the condition of solid waste management, an analysis was carried out by making a comparison between an overview of the management conditions before the visual improvement program and an overview of the management conditions after the visual improvement program. The comparison between the descriptions of solid waste management is shown in Figure 7 to Figure 10.
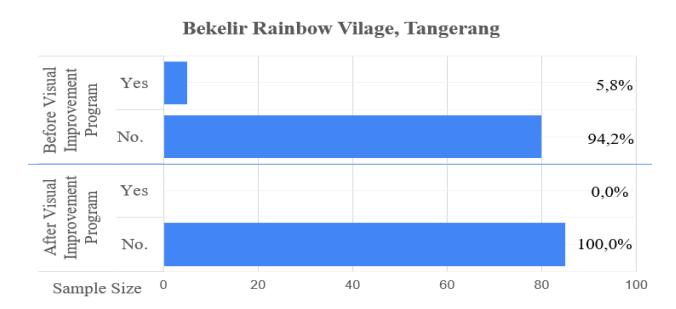
Figure 7. Overview of disposing waste into river behavior in Bekelir Rainbow Village.
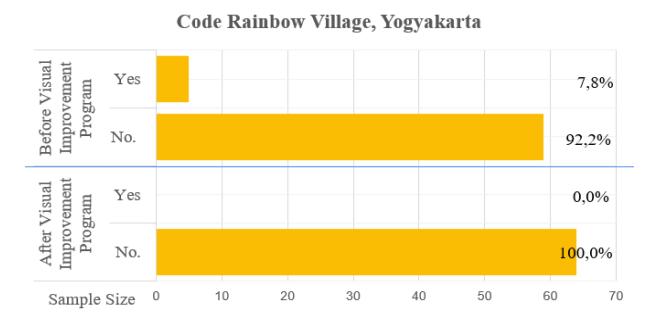
Figure 8. Overview of disposing waste into river behavior in Code Rainbow Village.
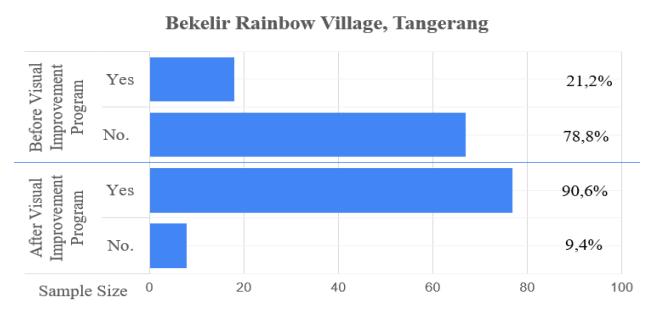
Figure 10. Overview of waste segregation at the source in Code Rainbow Village.
In general terms, for the behavior of disposing waste into the river in Bekelir Rainbow Village, Tangerang there was a decrease of 5.8%, while in Code Rainbow Village, Yogyakarta, there was a decrease of 47.8% after the visual improvement program. As for waste segregation at the source, in Bekelir Rainbow Village, Tangerang, there was an increase of 69.4%, while in Code Rainbow Village, Yogyakarta, there was an increase of 18.9% after the visual improvement program.
Impact Analysis of Visual Improvement Program on Sanitation Management
Analysis of the impact of the visual improvement programs on domestic wastewater management and solid waste management was identified with the Theory of Planned Behavior construct, with a construct combining attitude towards the behavior, subjective norm, and perceived behavioral
control. The combination of these constructs resulted in the formation of behavioral intention, where this behavioral intention is the closest determinant of behavior, or it can be said that the behavior displayed by people will appear because of their intention towards the behavior.
Data processing to identify the impact of the visual improvement program on domestic wastewater management and solid waste management was carried out by using the Spearman Rho Correlation statistical correlation test using the Path Analysis construct.
For domestic wastewater management this was identified based on the impact of the visual improvement program on the behavior of not doing sanitation and hygiene activities in the river and the behavior of treating household wastewater. The results of the path analysis for domestic wastewater management are shown in Figure 11 and Figure 12.
Based on the Theory of Planned Behavior construct, the visual improvement program in Bekelir Rainbow Village, Tangerang was included in the Perceived Behavior Control (PBC) dimension, which was obtained based on the correlation test for sanitation and hygiene activities in the river. The PBC dimension provided a correlation value to intention of 0.396 with p-value < 0.05 and for the behavior of household wastewater treatment, the PBC dimension provided a correlation value to the intention of 0.289 with a p-value < 0.05. Therefore, it can be said that the visual improvement program had a significant effect on reducing sanitation and hygiene activities in the river and improving the household wastewater treatment behavior.
For Code Rainbow Village, Yogyakarta, the results of the correlation test refer to the analysis based on Soewondo, P. (2020), where the visual improvement program was included in the Perceived Behavior Control (PBC) dimension. PBC gave a correlation value to intention of 0.256 with p-value < 0.05. Thus, it can be said that the visual improvement program in Code Rainbow Village, Yogyakarta also had a significant effect on improving the domestic wastewater management behavior in general.
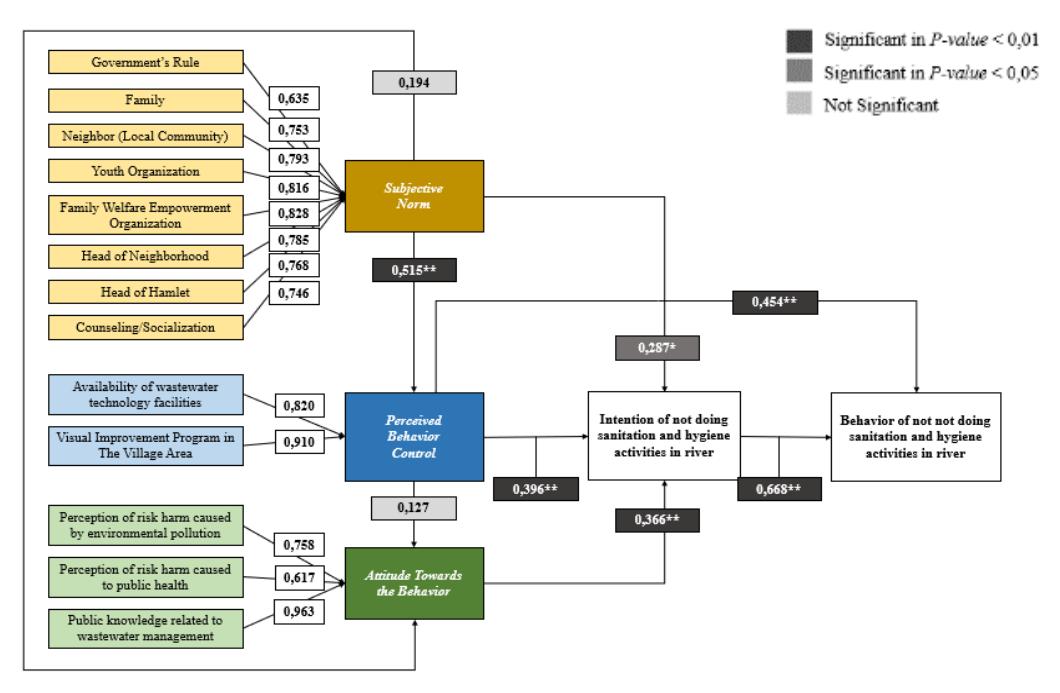
Figure 11. Path analysis impact of visual improvement program on the behavior of not doing sanitation and hygiene activities in the river.
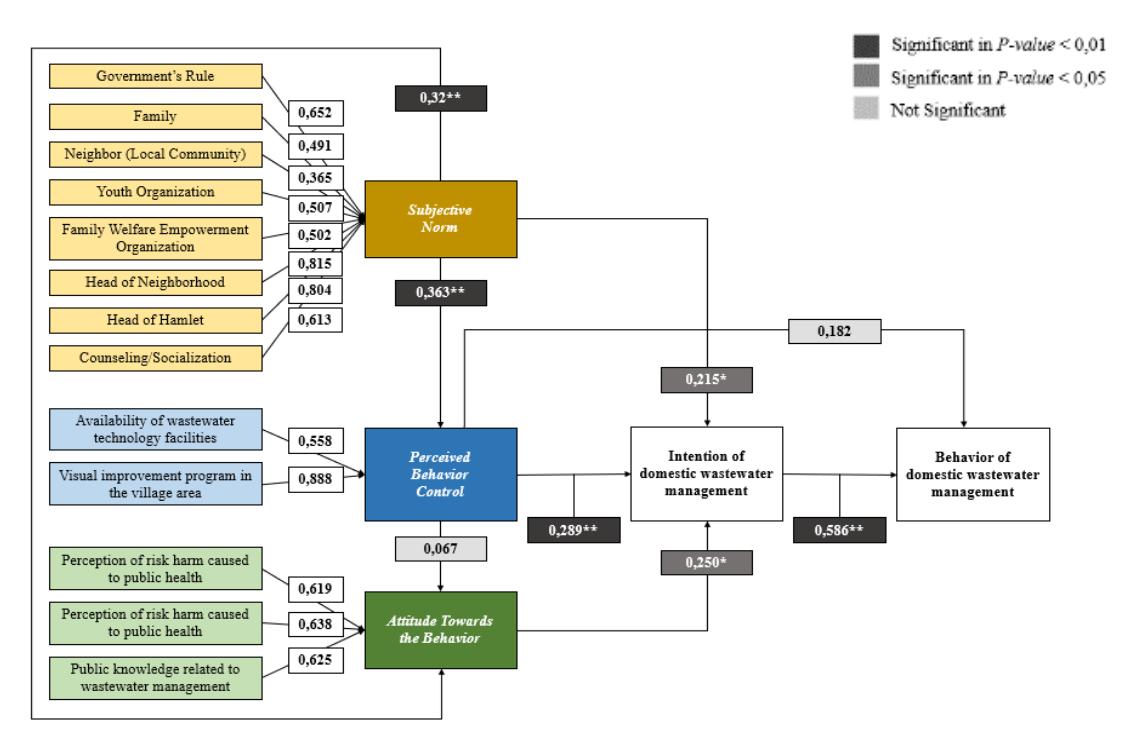
Figure 12. Path analysis impact of visual improvement program on domestic wastewater management.
For solid waste management, the path analysis impact was identified based on the impact of the visual improvement program on the behavior of not disposing waste into the river and the behavior of domestic solid waste management at the source. The results of the path analysis of solid waste management are shown in Figure 13 and Figure 14.
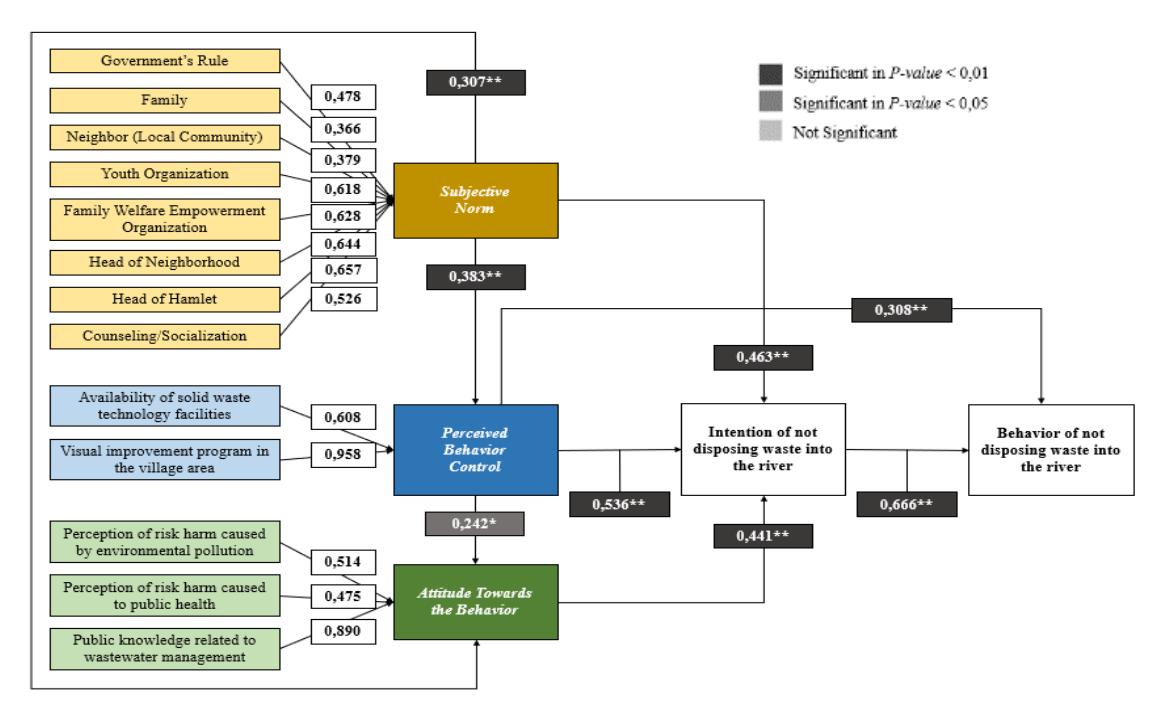
Figure 13. Path analysis impact of the visual improvement program on the behavior of not disposing waste into the river.
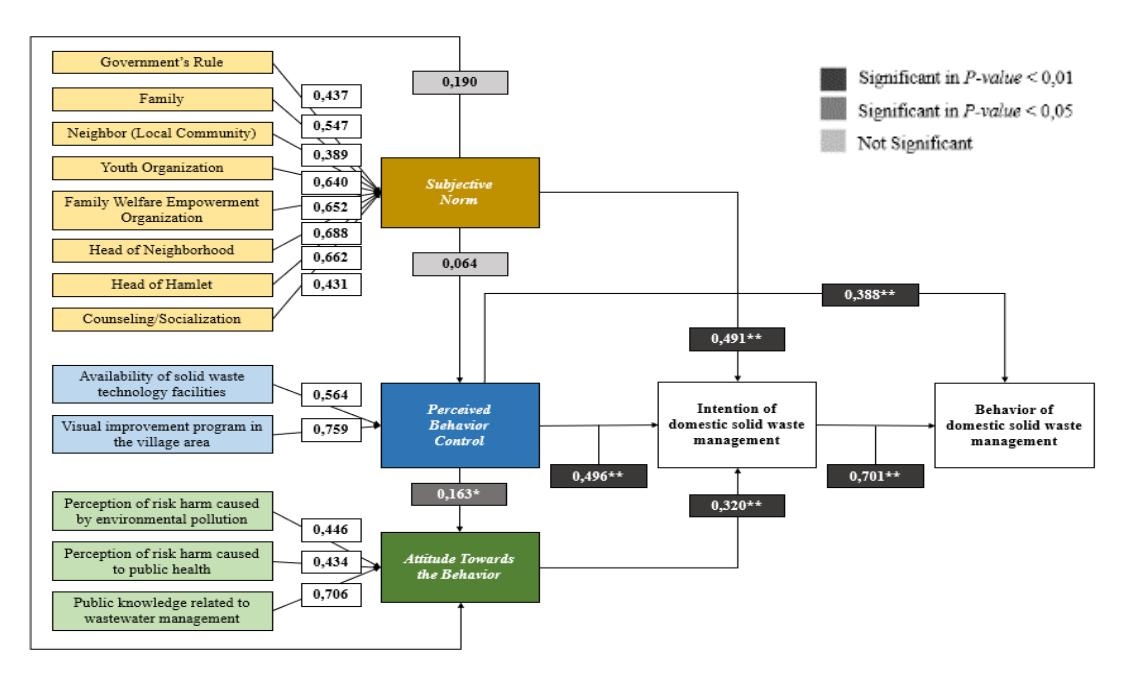
Figure 14. Path analysis impact of the visual improvement program on solid waste management.
Based on the Theory of Planned Behavior construct, the visual improvement program in Bekelir Rainbow Village, Tangerang was included in the Perceived Behavior Control (PBC) dimension, which was obtained based on the correlation test for not disposing waste in the river behavior. The PBC dimension provided a correlation value to intention of 0.536 with p-value < 0.05 and for the behavior of solid waste management, the PBC dimension provided a correlation value to the intention of 0.496 with a p-value < 0.05. Therefore, it can be said that the visual improvement program had a significant effect on reducing disposing waste behavior in the river and improving the solid waste management.
For Code Rainbow Village, Yogyakarta, the results of the correlation test refer to the analysis based on Soewondo, P. (2020), where the visual improvement program was included in the Perceived Behavior Control (PBC) dimension. PBC gave a correlation value to intention of 0.207 with a p-value < 0.05, so it can be said that the visual improvement program in Code Rainbow Village, Yogyakarta also had a significant effect on improving solid waste management behavior in general.
Analysis of Sustainable Factors Supporting Sanitation Management
Based on Figure 11 and Figure 12, it can be said that there was a significant impact of the visual improvement programs on domestic wastewater management and solid waste management. However, for domestic wastewater management, in Bekelir Rainbow Village, Tangerang and in Code Rainbow Village, Yogyakarta based on Figure 3 and Figure 4, there were still people who practiced sanitation and hygiene activities in the river. Also, based on Figure 5 and Figure 6, there were still people who did not have a private septic tank at home. For solid waste management, based on Figure 7 and Figure 8, both in Bekelir Rainbow Village, Tangerang and Code Rainbow Village, Yogyakarta, there was no practice of disposing waste into the river, but based on Figure 9 and Figure 10, the level of waste segregation at the source was still low.
Based on these conditions, it can be concluded that it was necessary to optimize sanitation management to ensure the sustainability of sanitation management after the visual improvement
programs in the two rainbow villages in the study area. Prior to the formulation of the best strategy to be used, it was necessary to identify the supporting factors for the sustainability of sanitation management based on the perspective of the population in the study area. The factors in Table 1 are then referred to as the exogenous latent variables, or dependent variables, which will be analyzed for their relationship to the optimization of domestic wastewater and solid waste management.
In addition to the exogenous latent variables, it was also necessary to analyze the endogenous latent variables, namely the sustainability of domestic wastewater management and solid waste management. The endogenous latent variable in the form of the sustainability dimension is a representation of the aspects contained in the optimization of the wastewater management system and solid waste management.
The analysis of supporting factors for the sustainability of domestic wastewater and solid waste management was processed using the SmartPLS statistical program, where the model formed can be said to have a significant effect on an endogenous latent variable if it has a T-statistic value > 1.96 and a p-value < 0.05. Before analyzing the relationship between the exogenous latent variables and the endogenous latent variables, it was necessary to test the structural model that was formed. The test in the SmartPLS statistical program is called Model Fit, where the test results from the structural model formed need to meet the criteria. The Model Fit results for the structural model of domestic wastewater and solid waste management are shown in Table 4 below.
| No | Inner Model | Cut-off Value | Running Results | Information | ||
|---|---|---|---|---|---|---|
| Wastewater | Solid waste | Wastewater | Solid waste | |||
| 1 | R-square | ≥ 0,26 | 0.718 – 0.905 | 0.875 – 0.979 | Good | Good |
| 2 | f-square | ≥ 0.02 | 0.047 – 0.290 | 0.099 – 0.245 | Good | Good |
| 3 | Q2 | > 0 | 0.700 – 0.897 | 0.868 – 0.977 | Good | Good |
| 4 | SRMR | ≤ 0.08 | 0.093 – 0.125 | 0.064 – 0.079 | Not good | Good |
| 5 | Chi-square | Expected small | 300.1 – 374.7 | 261.6 – 443.1 | Not good | Not good |
| 6 | NFI | ≥ 0.7 | 0.906 – 0.923 | 0.853 – 0.888 | Good | Good |
Table 4. Model Fit for the structural model of sustainability factors.
An empirical model of the relationship between the endogenous latent variables and the exogenous latent variables in the domestic wastewater management in Bekelir Rainbow Village, Tangerang is shown in Figure 15.
An empirical model of the relationship between the endogenous latent variables and the exogenous latent variables in the domestic wastewater management in Code Rainbow Village, Yogyakarta is shown in Figure 16.
In domestic wastewater management, for Bekelir Rainbow Village, Tangerang, the supporting factors for sustainable domestic wastewater management were: technical (0.406), regulatory and institutional (0.235), financial and economic (0.219), environmental impact (0.201) and sociocultural (0.142). For Code Rainbow Village, Yogyakarta, the supporting factors for the sustainability of domestic wastewater management were socio-cultural (0.302), regulatory and institutional (0.263), financial and economic (0.245), and technical (0.152). For Code Rainbow Village, the environmental impact aspect had no significant effect (0.125, p-value 0.204).
Based on the factors that influenced the sustainability of domestic wastewater management in Bekelir Rainbow Village, Tangerang and Code Rainbow Village, Yogyakarta, a different order of significance was obtained between each factor. This could be due to differences in the impact of the visual improvement programs in the two villages. For Bekelir Rainbow Village, Tangerang, the technical aspect was the most influential aspect on the sustainability of domestic wastewater management, with an effect size of 0.406. This can be explained based on the KAP survey that was carried out, where after the visual improvement program, the regional government massively built septic tanks for people who did not have a septic tank in their homes, so that sanitation and hygiene activities in the river was reduced by 94.2%. Meanwhile, in Code Rainbow Village, Yogyakarta, the technical aspect had less influence on the sustainability of the domestic wastewater management, with an effect size of 0.152, because after the visual improvement program, not many septic tanks were built for people who did not have a septic tank at home.
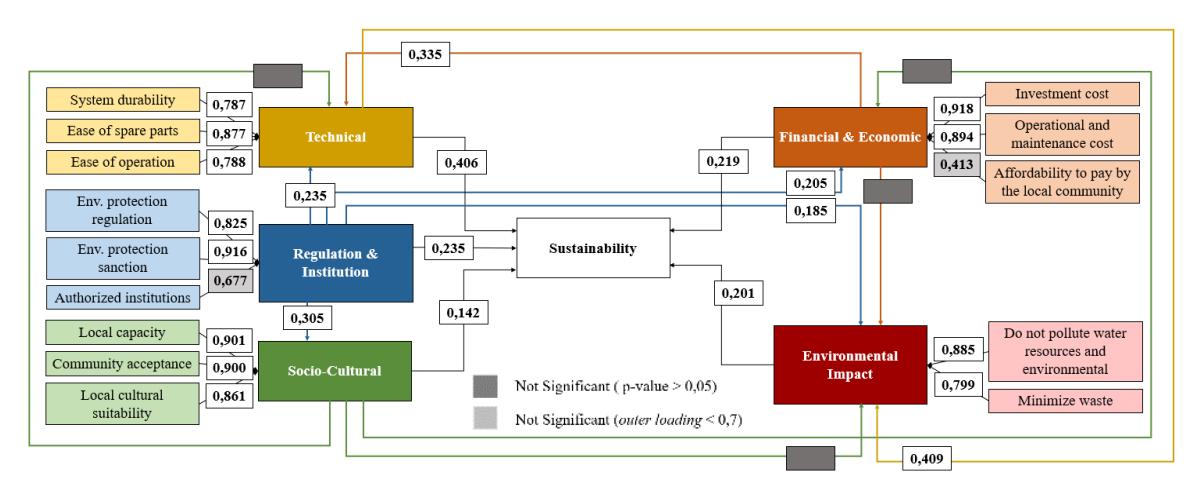
Figure 15. Factors for sustainability of wastewater management in Bekelir Rainbow Village.
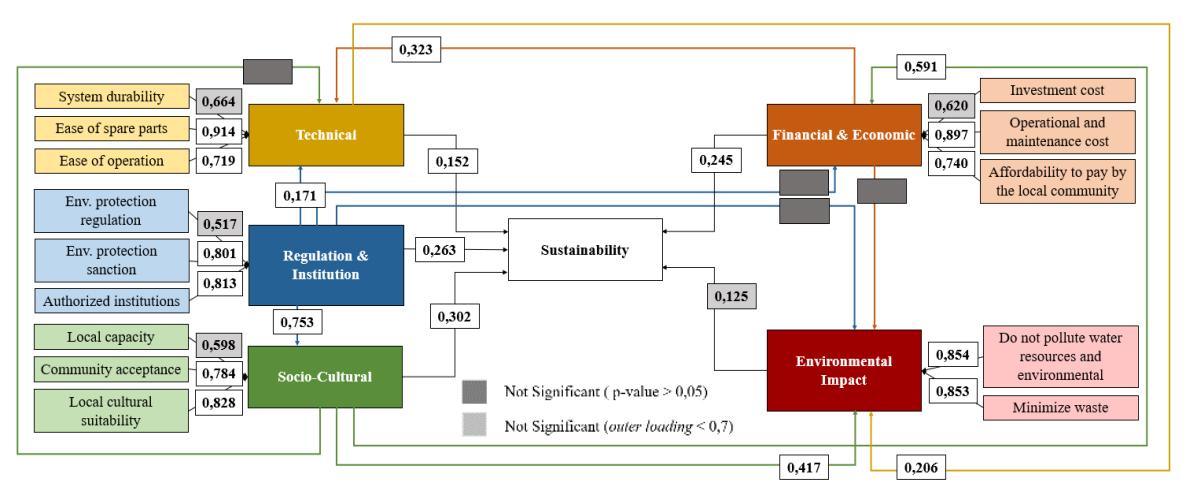
Figure 16. Factors for sustainability of wastewater management in Code Rainbow Village.
For Code Rainbow Village, Yogyakarta, the socio-cultural aspect was the most influential aspect on domestic wastewater management sustainability, with an effect size of 0.302. The high influence of socio-cultural factors in Code Rainbow Village, Yogyakarta was because the people in Code Rainbow Village, Yogyakarta still hold the values handed down by Romo Mangun in the environmental management of their area. For example, houses must face the Code River so that the inhabitants feel increased ownership of the Code River and toilets are not allowed to turn their back on the Code River because this is considered to create the perception of the Code River as a means of disposal. These things are not found in Bekelir Rainbow Village, Tangerang, where the socio-cultural factors that applied in Bekelir Rainbow Village, Tangerang were more about community acceptance in terms of sanitation management in their area and community mutual assistance activities in terms of sanitation management development in their area.
In addition, in terms of domestic wastewater management, it was found that both for Bekelir Rainbow Village, Tangerang and Code Rainbow Village, Yogyakarta, the environmental impact aspect was smaller than that of the other aspects. However, in Bekelir Rainbow Village, Tangerang, the socio-cultural aspect had a smaller impact than the environmental impact aspect. This can be explained based on the results of the KAP survey, where before the visual improvement program, the percentage of people who carried out sanitation and hygiene activities in the river was higher in both study areas compared to people who carried out waste disposal activities into the river. The decrease in the percentage of the community that did sanitation and hygiene activities in the river was also due to the prohibition of disposing waste directly into the river after the visual improvement program, not because the community felt the negative impact of disposing waste directly into the river. This may indicate that the community felt that domestic wastewater management does not have a direct impact on public health and environmental health, both before and after the visual improvement program.
In this case, the visual improvement programs implemented in the two study areas had an influence on the sequence of factors for the sustainability of domestic wastewater management that was felt by the community. Thus, in terms of optimizing domestic wastewater management after the visual improvement programs to support the domestic wastewater management sustainability, the two study areas had a different priority-order based on the order of factors that influenced the sustainability of domestic wastewater management, whose influence was most felt by the community.
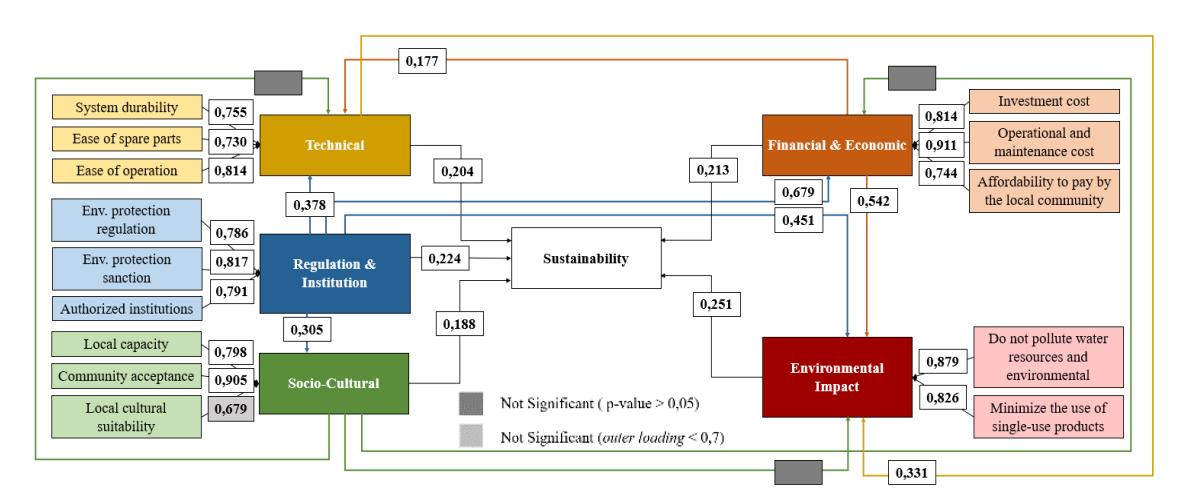
Figure 17. Factors for solid waste sustainability management in Bekelir Rainbow Village.
An empirical model of the relationship between the endogenous latent variables and the exogenous latent variables for solid waste management in Bekelir Rainbow Village, Tangerang is shown in Figure 17.
An empirical model of the relationship between the endogenous latent variables and the exogenous latent variables for solid waste management in Code Rainbow Village, Yogyakarta is shown in Figure 18.
In solid waste management, for Bekelir Rainbow Village, Tangerang, the supporting factors for sustainable solid waste management were environmental impact (0.251), regulatory and institutional (0.224), financial and economic (0.213), technical (0.204), and socio-cultural (0.188). For Code Rainbow Village, Yogyakarta, the factors that supported solid waste management sustainability were environmental impact (0.239), socio-cultural (0.225), regulatory and institutional (0.203), financial and economic (0.190), and technical (0.165).
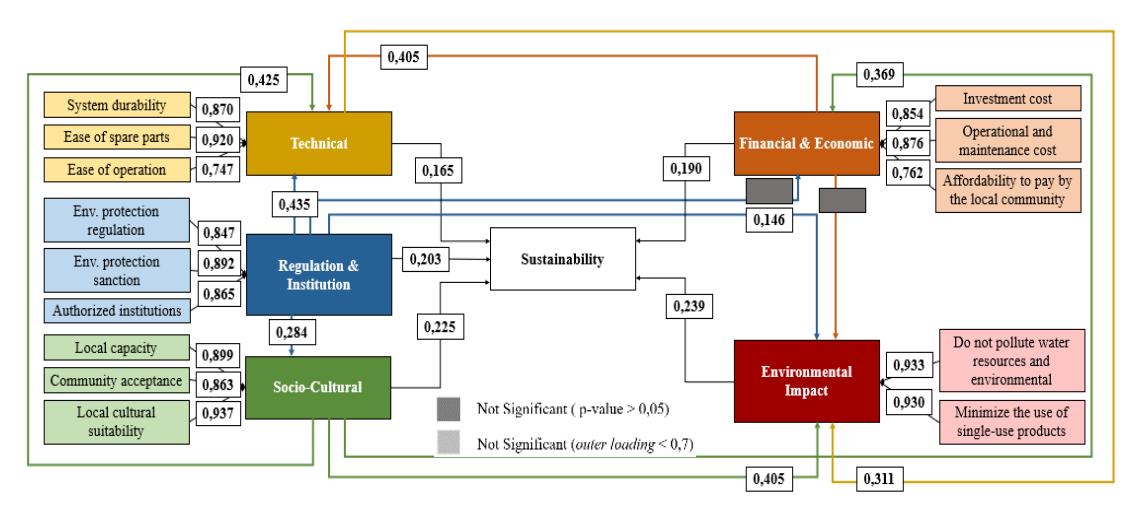
Figure 18. Factors for sustainability of solid waste management in Code Rainbow Village.
Based on the factors that influenced the sustainability of solid waste management in Bekelir Rainbow Village, Tangerang and Code Rainbow Village, Yogyakarta, a different order of significance was obtained between each factor. This could be due to differences in the impact of the visual improvement program carried out in the two villages. For Bekelir Rainbow Village, Tangerang, the environmental impact aspect was the most influential on the sustainability of solid waste management, with an effect size of 0.251. This can be explained based on the KAP survey that was carried out, where after the visual improvement program, no people carried out activities of disposing waste into the river, where before the visual improvement program, there were still 5.8% of people who carried out activities of disposing waste into the river.
For Code Rainbow Village, Yogyakarta, the environmental impact aspect was the most influential aspect on the sustainability of solid waste management, with an effect size of 0.302. This can be explained based on the KAP survey that was carried out, where after the visual improvement program, no people carried out activities of disposing waste into the river, where before the visual improvement program, there were still 7.8% of people who carried out activities of disposing waste into the river.
Based on this, it can be seen that the effect of the environmental impact aspect on the factors that influenced solid waste management sustainability was greater than on the other factors in both study areas. This may have been caused by the community's opinion that when compared to the improvement in domestic wastewater management in the two village areas after the visual improvement program, the improvement in solid waste management was directly felt by the community in terms of environmental cleanliness and financial gain.
In addition, when viewed from the factors that influenced solid waste management sustainability, regulatory and institutional aspects also had a high enough influence, even though the influence of regulatory and institutional aspects in Code Rainbow Village, Yogyakarta came after the sociocultural aspect. This may have been because after the visual improvement program, regulations were introduced by the government regarding the prohibition of disposing waste into the river. Besides that, the community also felt that it was necessary to protect the environment after the visual improvement program, because they felt that solid waste management had a direct effect on the cleanliness of the environment in the area.
Similar to domestic wastewater management, in this case, the visual improvement program carried out in the two study areas had an influence on the sequence of solid waste management sustainability factors felt by the community. Thus, in terms of optimizing solid waste management after the visual improvement program to support the sustainability of solid waste management, the two study areas had a different order of priorities based on the order of factors that influenced the sustainability of solid waste management, whose influence was most felt by public community.
Strategies for Optimizing Sanitation Management
A general recapitulation of the order of factors influencing domestic wastewater management in the two study areas is shown in Table 5.
| Influencing Factors on Domestic Wastewater Management Sustainability | |||
|---|---|---|---|
| Bekelir Rainbow Village | p | Code Rainbow Village | p |
| Technical | 0.406 | Socio-cultural | 0.302 |
| (ease of obtaining spare parts) | (0.877) | (local cultural suitability) | (0.828) |
| Regulatory & institutional | 0.235 | Regulatory & institutional | 0.263 |
| (protective sanctions) | (0.916) | (authorized institution) | (0.813) |
| Financial & economic | 0.219 | Financial & economic | 0.245 |
| (investment cost) | (0.918) | (operational cost) | (0.897) |
| Environmental impact | 0.201 | Technical | 0.152 |
| (do not pollute the environment) | (0.885) | (ease of obtaining spare parts) | (0.914) |
| Socio-cultural | 0.142 | Environmental impact* | 0.125* |
| (local capacity) | (0.901) | (do not pollute the environment) | (0.854) |
Table 5. Influencing factors on domestic wastewater management sustainability.
• = not significant (p-value > 0.05)
A recapitulation of the order of factors influencing solid waste management in the two study areas is shown in Table 6.
| Influencing Factors on Solid Waste Management Sustainability | |||
|---|---|---|---|
| Bekelir Rainbow Village | p | Code Rainbow Village | p |
| Environmental impact | 0.251 | Environmental impact | 0.239 |
| (do not pollute the environment) | (0.879) | (do not pollute the environment) | (0.933) |
| Regulatory & institutional | 0.224 | Socio-cultural | 0.225 |
| (protective sanctions) | (0.817) | (local cultural suitability) | (0.937) |
| Financial & economic | 0.213 | Regulatory & institutional | 0.203 |
| (operational cost) | (0.911) | (protective sanctions) | (0.892) |
| Technical | 0.204 | Financial & economic | 0.190 |
| (ease of operation) | (0.814) | (operational cost) | (0.876) |
| Socio-cultural | 0.188 | Technical | 0.165 |
| (community acceptance) | (0.905) | (ease of procurement of facilities) | (0.920) |
Table 6. Influencing factors on solid waste management sustainability
After knowing the results of the evaluation of the condition of domestic wastewater management in Bekelir Rainbow, Tangerang and Code Rainbow Village, Yogyakarta and the determining factors in domestic wastewater management sustainability in Bekelir Rainbow, Tangerang and Code Rainbow Village, Yogyakarta, the next step was to determine the right strategy to achieve sustainable domestic wastewater management in the two study areas that shown in Table 7.
Table 7. Strategy for achieving domestic wastewater management sustainability
| Recommendations Strategy for Domestic Wastewater Management Sustainability | |||||
|---|---|---|---|---|---|
| Bekelir Rainbow Village | Code Rainbow Village | ||||
| Implementation of the construction of a septic tank for houses indicated that they did not have an impermeable septic tank and making plans for the | Regular counseling and monitoring are carried out to ensure the proper management | ||||
| 1 | connection of a centralized wastewater piping network. Related factors: Technical – ease of obtaining spare parts. | of domestic wastewater. Related factors: Socio-cultural – local cultural suitability. | |||
| 2 | Enforcement of sanctions related to environmental protection that have been stated in the domestic wastewater management regulations for people who do not manage domestic wastewater properly. | Carrying out the function of a community service center that can be part of the institution responsible for domestic wastewater management. | |||
| Related factors: Regulatory & institutional – protective sanctions. | Related factors: Regulatory & institutional – authorized institution. | ||||
| 3 | Determination of funding schemes that can come from APBD related to the development and construction of domestic wastewater management systems. | Implementation of self-funding schemes originating from the community for domestic wastewater management in the future. | |||
| Related factors: Financial & economic – investment cost. | Related factors: Financial & economic – operational cost. | ||||
| 4 | Regular counseling regarding appropriate domestic wastewater management systems in order to increase public understanding of the role of domestic wastewater management systems in preventing pollution of water resources. | Implementation of the construction of septic tanks for people who do not have a septic tank in their homes and replacement of accessories for supporting facilities for domestic wastewater management systems | |||
| 5 | Related factors: Environmental impact – do not pollute the environment. Inviting the community to actively contribute to the maintenance of the domestic wastewater management system in their area. | that are not up to standard by taking into account the convenience of obtaining spare parts in the event of damage to the piping network. | |||
| Related factors: Socio-cultural – local capacity. | Related factors: Technical – ease of obtaining spare parts – do not pollute the environment. | ||||
For the sustainability of solid waste management, the right strategy to achieve sustainability of solid waste management in the two study areas shown in Table 8.
Table 8. Strategy for achieving solid waste management sustainability.
| Recommendations Strategy for Solid Waste Management Sustainability | |||||
|---|---|---|---|---|---|
| Bekelir Rainbow Village | Code Rainbow Village | ||||
| 1 | Community counseling and assistance regarding the utilization of waste bank facilities and the potential for processing waste at the source. | Regular counseling related to the waste bank utilization scheme in the area to support solid waste management. | |||
| Related factors: Environmental impact – do not pollute the environment | Related factors: Environmental impact – do not pollute the environment. | ||||
| 2 | Enforcement of sanctions related to environmental protection that are listed in the solid waste management regulations for people who do not manage waste properly. | Regular counseling and monitoring are carried out to ensure proper solid waste management is running. | |||
| Related factors: Regulatory & institutional – protective sanctions. | Related factors: Socio-cultural – local cultural suitability. | ||||
| 3 | Implementation of self-funding schemes originating from the community for future solid waste management and utilization of waste bank facilities to support waste management in their area. | Enforcement of sanctions related to environmental protection that are listed in the solid waste management regulations for people who do not manage waste properly. | |||
| Related factors: Financial & economic – operational cost. | Related factors: Regulatory & institutional – protective sanctions. | ||||
| 4 | Assistance in the procurement of segregated trash bins for people who have not yet sorted waste at home and procurement of segregated trash bins at certain points in their area. | Implementation of self-funding schemes originating from the community for future waste management and utilization of waste bank facilities to support solid waste management in their area. | |||
| Related factors: Technical – ease of operation. | Related factors: Financial & Economic – operational cost. | ||||
| 5 | Counseling regarding proper solid waste management systems and solid waste management schemes in their area that can be carried out by the community. | Assistance in the development of waste banks as a means to support solid waste management in their area and assistance in the procurement of segregated waste bins. | |||
| Related factors: Socio-cultural – community acceptance. | Related factors: Technical – ease of procurement of facilities. | ||||
Conclusion
The visual improvement programs implemented in two different slum areas, namely Bekelir Rainbow Village, Tangerang and Code Rainbow Village, Yogyakarta, had a different impact on domestic wastewater management and solid waste management. Based on the results of the Knowledge, Attitude and Practice survey (KAP survey) it was found that for domestic wastewater management in general there was a decrease in sanitation and hygiene activities in the river and an increase in domestic wastewater treatment activities. For solid waste management in general there was a decrease in activities of disposing waste into the river and there was an increase in activities of managing waste at the source. To identify the impact of the visual improvement programs in the two study areas, further analysis was carried out based on the Theory of Planned Behavior construct and it was found that the visual improvement program significantly affected the intention and behavior not to do sanitation and hygiene activities in the river, the intention to treat domestic wastewater, intentions and behaviors not to dispose waste into the river and intentions and behaviors for waste management at the source. Taking into account the problems that are still found in the two study areas, an optimization strategy was formulated based on the factors that influence the sustainability of domestic wastewater management and solid waste
management in the two study areas. It was found that regulatory and institutional aspect as well as the financial and economic aspect were sustainability aspects found in the sustainability of domestic wastewater and solid waste management in Bekelir Rainbow Village, Tangerang. Moreover, the socio-cultural aspect as well as the regulatory and institutional aspect were sustainability aspects found in the sustainability of domestic wastewater management and solid waste management in Code Rainbow Village, Yogyakarta.