
Introduction
The development of the city of Bekasi is providing growth for industry, trade, and housing. This caused the urban heat island (UHI) effect to occur, which is an increase in temperature within urban areas contrasting with cooler temperatures in surrounding areas (Udristioiu, Velea, Bojariu, & Sararu, 2017). In 2021, Umam and Jumadi discussed the UHI effect by extracting Landsat 8 data images. The result showed an average value of 0.55 for the correlation between land and UHI from 2014 to 2019 (Umam & Jumadi, 2021).
Research on private green space is comparatively less prevalent than research on public green space (de Bell et al., 2020). Private green space, especially in housing, is more vulnerable to changes due to the dependence on the needs of homeowners. Generally, home gardens constitute 50-70% of urban green space (Ignatieva & Hedblom, 2018). In Sweden, private green space at home constitutes half of urban green space (Hedblom et al., 2017), which can lower the air temperature, but its influence is low in tropical monsoon (Am) climates. Therefore, this research conducted a limited simulation of green space in a tropical monsoon (Am) climate.
The effects of air temperature
The effect of UHI is more visible in land surface temperature (LST) than in air temperature. LST is the temperature of the earth surface heat radiation. An increase in this variable is also associated with a higher air temperature.
The air temperature is an important indicator of comfort, significantly affecting outdoor activities, such as exercising. A comfortable air temperature stimulates people to exercise outside (L. Zhang et al., 2020). Lacharite-Lemieux et al. found that respondents who exercised outdoors were more consistent (Lacharité-Lemieux, Brunelle, & Dionne, 2015), indirectly positively affecting their health. Air temperature also enhances the amount of outdoor activity (Labdaoui, Mazouz, Moeinaddini, Cools, & Teller, 2021), which indirectly influences the perceptions of an area. Even though the concept looks trivial, air temperature affects different aspects of life in the city.
Cool outdoor air temperatures can motivate people to carry out outdoor activities and reduce skin inflammation. Many problems arise due to high air temperatures, namely eczema and rashes. Sweaty skin conditions also increase the chance of fungal skin diseases, scabies, and ringworm. Several people still use fans as the only solution to make indoor spaces more comfortable. Even though this makes the air become cooler due to the reduction of relative humidity, ventilation with fans has no influence on the outside air temperature.
Types of green space
Green space is defined in Bekasi City Regional Regulation Number 13 of 2011 concerning the Bekasi City Spatial Planning Plan for 2011-2031. The concept consists of public and private green space. Public green space is an area with a fixed budget from the local government that can be accessed by anyone, where the activities carried out are diverse but subject to regulations. There are several types of public green spaces, namely city parks, green belts, and other public locations.
Private green space is located in a non-public area, such as in homes and private institutions. The access depends on the limitations reinforced by the owner. In addition to aesthetics, some are used as agricultural land. The arrangement is not only related to the preferences of the owner but also regulated by local regulations. For example, Bekasi City Regional Regulation Number 17 of 2011 states that developers must provide 15 to 20% of the land for green space. Law Number 26 of 2007 states that green space must have a minimum area of 30% of the city's land area, divided into 10% and 20% for private and public, respectively. Private green spaces are more prone to being converted to non-green spaces because of the needs of the owners. This includes house yards, private cemeteries, and institutional gardens (such as offices and schools).
Green space and air temperature
The configuration, composition, and arrangement of the surrounding environment affect temperature (Li & Liu, 2020). In general, a 1% increase in green space can reduce the temperature by 1 to 2 ℃ (Y. Zhang, Murray, & Turner, 2017). Previous research has shown that green roofs provided a maximum cooling effect of -1.60 ℃ (Sun, Lee, Lin, & Lee, 2012). This is important in hot and humid climates requiring cooling.
2017 investigated the spatial distribution in Dalian City, China affecting environmental, social, and governance (ESG). In this context, remote sensing was used to determine the relationship between green space and LST (Yang, Sun, Ge, & Li, 2017). The climate of Dalian City is warm and temperate according to the Köppen classification. Meanwhile, Verma and Kundapura showed a correlation between LST and the urban-weighted green index in Lucknow City, India (Verma & Kundapura, 2020). The climate of the city is warm and temperate according to the Köppen classification. According to Davtalab et al., green space in Iran reduced the average air temperature by 1 ℃. Direct measurements were conducted to review the effect of green space on temperature (Davtalab, Deyhimi, Dessi, Hafezi, & Adib, 2020). The climate of Iran is a tropical and subtropical desert (Bwh) according to the Köppen classification.
There has been limited discussion about the effect of private green space on air temperature in tropical areas. Research on the effect can provide various benefits, especially in making the outdoor environment more comfortable. Bekasi City has green space below the national standard, at 15% instead of 30% (Azzam, 2020). This contributes to an increase in temperature in Bekasi City (Umam & Jumadi, 2021). Therefore, private green space in housing should be analyzed (Ignatieva & Hedblom, 2018). The results can also be considered in planning and designing areas as well as housing in the provision of green space.
Housing developers provide most private green space in Bekasi City. The maintenance depends on the Several studies have discussed the effect of green space on decreasing temperature. Yang et al. income of the residents, where lower-income people usually cover private green space with pavement (Lacan et al., 2020) to reduce maintenance efforts, expand terraces, and add garages. Homeowners implement potted plants for aesthetics when private green spaces are completely covered with pavement. Middle-to-upper-income people do not cover private green space with pavement and consider the necessity of aesthetics (Lacan et al., 2020).
Air temperatures in Bekasi City
The growth of Bekasi City is dense, causing an increase in relative humidity and air temperature. Therefore, UHI is higher, which makes the city environment uncomfortable, especially with tropical monsoon (Am) climate conditions and moderately high air temperatures and relative humidity.
This location was selected as a sample of rapid industrial city growth, with sloping geographic conditions. The city of Bekasi has a tropical monsoon (Am) climate with an average air temperature and relative humidity of 24 to 33 °C and ±78%, respectively. Additionally, human
activities such as transportation, households, and industry in urban areas affect air temperature (Lai and Cheng, 2010).
The outdoor air temperature is mostly uncomfortable throughout the year because of the climate (Ilmiawan, Zaki, Singh, & Khalid, 2024). High air temperature and relative humidity can also trigger skin problems such as rashes and fungal infections. Meanwhile, not all residents have artificial ventilation, thus, people may have to rely on electric fans. A comfortable outside air temperature has a significant influence on the need for electric fans for indoor cooling.
Methods
This research used the simulation software ENVI-met to analyze the private green space effects in different scenarios with climate conditions in Bekasi City. All scenarios featured variations of a standard area of (49 x 49) m2 in a housing complex as shown in Figure 1. The scenarios were created to test the effects of green space or building materials on reducing air temperature in a tropical monsoon climate. Previous research states that green space is able to reduce the air temperature (Zhang, Murray, & Turner, 2017). The optimal location and configuration of new green spaces were analyzed, with a reduction in LST of roughly 1 to 2 °C locally and 0.5 °C regionally, related to the cooling benefits in Phoenix, Arizona using geographic information systems, remote sensing, spatial statistics, and spatial optimization. Subsequently, building materials have a greater influence on increasing or decreasing air temperature (Yuan et al., 2021). According to this research, the building coverage ratio (BCR) is the most influential factor, which quantifies warming and cooling effects using the boosted regression tree (BRT) model to examine the relative contributions and margins of the factors on LST. Therefore, six scenarios were created to test the influence of green spaces and building materials in a tropical monsoon climate.
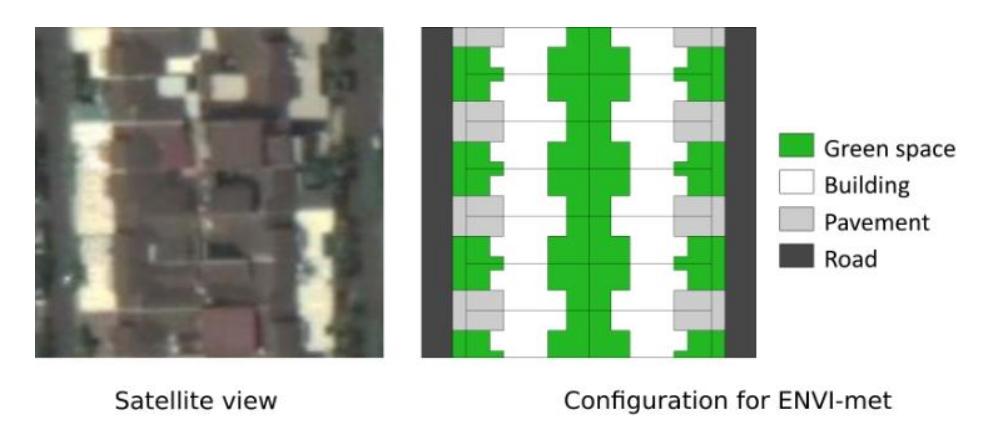
Figure 1. The satellite image from Google Maps.
The scenarios aimed to represent significant changes in air temperature when the soil-sealing and development levels are increased or decreased. Each scenario analyzed 14 housing units with a building and land area of 60 m2 and 126 m2 , respectively. A carport space of 16.5 m2 was included. The explanations of all scenarios are shown in Table 1.
Scenario 1 is the situation when the houses were still newly built according to the site plan of the developer. Reducing green space maintenance by soil-sealing (Scenarios 2 and 3) is widespread in low-income areas (Chalmin-Pui, Griffiths, Roe, & Cameron, 2019). Meanwhile, converting backyards into buildings (Sc enarios 4 and 5) is done for adding extra rooms, such as bedrooms, a laundry area, or a kitchen. Scenario 6 has more green space since half of the houses are vertically assembled into one another.
Scenario 1 Scenario 2 Scenario 3 Scenario 4 Scenario 5 Scenario 6 Description Green space in front yards and back yards (no soilsealing) Sealed front yards, greenspace only in back yards Soil-sealing in front yards and back yards Soil-sealing in front yards and back yards Green space in front yards built back yards Sealed front yards, builtup back yards Plot size (m2 ) 2,401 2,401 2,401 2,401 2,401 2,401 Green space (m2 ) 804.5 524.5 52 332 54 1,071.32 Pavement (m2 ) 315 595 1,067.5 315 595 478.18 First floor area (m2 ) 840.5 840.5 840.5 1,313 1,313 405 Building surface area (m2 ) 2,768.5 2,768.5 2,768.5 2,737 2,737 1,415 Building height (m) 6 6 6 7 7 10
Table 1. The scenarios
The percentages of green space from Scenarios 1, 2, 3, 4, 5, and 6 included 33.51%, 21.85%, 2.17%, 13.83%, 2.25%, and 44.62%, respectively. In addition, the percentages of pavement from Scenarios 1, 2, 3, 4, 5, and 6 were 13.12%, 24.78%, 44.46%, 13.12%, 24.78%, and 19.92%, respectively. The building ground floor area of Scenarios 1 to 3 was 35.01% of the land area. Scenarios 4 and 5 had a building ground floor area percentage of 54.69% of the total land area, while 6 had 16.87%.
A simulation uses models as research objects, paying close attention to interactions between model components in real life (Wang, 2013). This research started with a literature review regarding UHI, housing, and green space. A total of six scenarios were analyzed with different sizes and configurations of buildings, green space, and pavements. The site plan from the developer was used to match the size of the houses and yards in the simulation.
Using ENVI-met for the simulation
Much software is available for analyzing air temperature, namely RayMan, Ladybug-tools, and ENVI-met. RayMan is used to analyze PET (psychologically equivalent temperature), PMV (predicted mean vote), and SET (standard effective temperature). Besides climate and geographic data, individual information such as gender, age, height, weight, type of clothing, and activity are also needed. Therefore, RayMan is used to determine the thermal comfort of a group at a particular location instead of simulating the microclimate from 3D modeling.
Ladybug-tool is also used to simulate various microclimate elements, one of which is outdoor air temperature. However, there are differences between ENVI-met and Ladybug-tools analysis. ENVI-met was created specifically to simulate outdoor spaces, since the concept analyzes the interaction of vegetation with the microclimate. Meanwhile, Ladybug-tool simulates evapotranspiration seen from the green coverage ratio and plant albedo using UWG (Urban Weather Generator) (Ibrahim, Kershaw, & Shepherd, 2020). The software produces different results from ENVI-met (Elwy, Ibrahim, Fahmy, & Mahdy, 2018).
The analysis was carried out using a simulation method in the ENVI-met program to compare the conditions in Scenarios 1 to 6. ENVI-met is a computational fluid dynamics (CFD) program with Reynolds-averaged Navier-Stokes (RANS) calculations to obtain atmospheric conditions in an area (Crank, Sailor, Ban-Weiss, & Taleghani, 2018).
The deviation of the ENVI-met simulation results with measurements is 0.6% for air temperature (Salata, Golasi, de Lieto Vollaro, & de Lieto Vollaro, 2016) (Salata et al., 2016). Ensuring that the grid resolution is the same (2 x 2 m) in simulation scenarios can produce consistent results (Crank et al., 2018). The air temperature and humidity from the ENVI-met simulation results show a strong correlation between measured and modeled values (Acero & Arrizabalaga, 2018). The deviations from the real-life conditions in ENVI-met are 0.6% and 0.9% for air and mean radiant temperature, and 2.0% for relative humidity (Salata et al., 2016).
Each simulation scenario occurred on a (49 x 49) m2 or 2,401 m2 plot. Subsequently, the discussion compares the results with the literature to conclude the research. The simulation aims to obtain the potential air temperature in each scenario. The result is compared per scenario, time slot, and day to determine the significant difference between each scenario.
Each material component influences air temperature, as reported in Table 2. The most influential elements are emissivity, absorption, transmission, reflection, specific heat, thermal conductivity, density, roughness length, albedo, aerodynamic roughness length, and thickness. Each green space, pavement, and building material has different characteristics since the effect on air temperature is also varied.
The climate data for each of the analyzed dates are reported in Table 3. The climate data, covering the year 2020, was obtained from the literature. Simple forcing considers the minimum and maximum hourly air temperature and humidity data according to the duration of the simulation. For minimum and maximum air temperature, the concept starts at 05.00 and 16.00. Meanwhile, for minimum and maximum relative humidity, simple forcing starts at 04.00 and 16.00, according to the settings of ENVI-met, respectively.
The simulations were carried out on solstice days, June 21 and December 21, as well as the hottest and coldest temperatures, on October 3 and August 9, and when the sun is directly above the equinox on March 20. The times compared were 07.00, 12.00, and 17.00. The results were compared to determine which scenario had the highest temperature. In addition, the day and hour used to distinguish the results of one scenario from another are reported. The analysis time started at 04.00 and the duration was 16 hours.
Table 2. The materials used in the simulation.
| Pavement | Green space | Building | |||||
|---|---|---|---|---|---|---|---|
| Granite tiles (300 x 300 mm) | Asphalt road | Axonopus | Plastered brick walls (150 mm) | Float glass (6 mm) | Polycarbonate roof (carport) | Terracotta roofing | |
| Emissivity | 0.90000 | 0.90000 | 0.0000 | ||||
| (Frac) | |||||||
| Absorption | 0.05000 | 0.50000 | |||||
| (Frac) | |||||||
| Transmission | 0.30000 | 0.90000 | 0.00000 | ||||
| (Frac) Reflection | 0.05000 | 0.50000 | |||||
| (Frac) | |||||||
| Specific Heat | 750 | 840.00000 | |||||
| (J/kgK) | |||||||
| Thermal | 1.00000 | 0.81000 | |||||
| Conductivity | |||||||
| (w/m2k) | |||||||
| Density | 2,500 | 1700.00000 | |||||
| (kg/m3 ) | |||||||
| Roughness | 0.01000 | 0.01000 | 0.02000 | ||||
| Length (m) | |||||||
| Albedo Aerodynamic | 0.40000 | 0.20000 | 0.20000 | 0.02000 | |||
| Roughness | |||||||
| Length (m) | |||||||
| Thickness (m) | 0.50000 | 0.05000 | |||||
Table 3. The climate data for the simulation.
| March 20 | June 21 | August 9 | October 3 | December 21 | |
|---|---|---|---|---|---|
| Sunrise angle | 05.56 at 90° | 06.01 at 67° | 06:01 at 74° | 05:35 at 94° | 05.35 at 114° |
| Midday sun | 11.59 at 0° | 11.53 at 0° | 11:57 at 0° | 11:40 at 0° | 11.50 at 180° |
| angle | |||||
| Sunset angle | 18.02 at 270° | 17.46 at 293° | 17:53 at 286° | 17:46 at 266° | 18.04 at 246° |
| Midday sun | 84° | 60° | 68° | 88° | 73° |
| altitude | |||||
| Air | 24–32 °C | 24–32°C | 23–32°C | 24–33°C | 24–30°C |
| temperature | |||||
| range | |||||
| Wind direction | East | West | East | East | East |
| Wind velocity | 2.2 m/s | 2.2 m/s | 2.8 m/s | 2.4 m/s | 3.4 m/s |
| Relative | 45–97% | 38–95% | 29–98% | 41–96% | 40–95% |
| humidity | |||||
| Roughness | 0.5 | ||||
| length | |||||
| Time | 04.00–20.00 | ||||
| Location | Long: 106° 58' 59" Lat: -6° 16' 59" | ||||
Results
The simulation used the same materials in all scenarios.
March 20
The following are the results of the analysis for March 20 (Table 4).
Table 4. The results of the microclimate analysis for March 20
| Mean Air Temperature (°C) | ||||
|---|---|---|---|---|
| 07.00 | 12.00 | 17.00 | ||
| Scenario 1 | 25.47 | 30.02 | 30.98 | |
| Scenario 2 | 25.48 | 30.05 | 31.14 | |
| Scenario 3 | 25.52 | 30.02 | 31.24 | |
| Scenario 4 | 25.57 | 30.13 | 31.10 | |
| Scenario 5 | 25.58 | 30.18 | 31.16 | |
| Scenario 6 | 25.59 | 29.92 | 30.94 | |
The analysis for March 20 was from a height of 1.5 meters, as shown in Table 4. The hottest and coldest average temperature have a red color and green, respectively. At 7 a.m., Scenarios 1 and 6 had the lowest and highest average temperature of 25.47 °C and 0.16 °C, respectively. At 12 p.m., Scenarios 6 and 5 had the lowest and highest average temperature of 29.92 °C and 0.26 °C, respectively. Meanwhile, scenarios 6 and 3 had the lowest and highest average temperature of 30.94 °C and 0.3 °C at 5 p.m., respectively.
June 21
The following are the results of the analysis for June 21.
Table 5. The results of the microclimate analysis for June 21.
| Mean Air Temperature (°C) | |||
|---|---|---|---|
| 07.00 | 12.00 | 17.00 | |
| Scenario 1 | 25.38 | 29.98 | 30.86 |
| Scenario 2 | 25.39 | 30.03 | 30.96 |
| Scenario 3 | 25.43 | 29.99 | 31.05 |
| Scenario 4 | 25.57 | 30.08 | 30.95 |
| Scenario 5 | 25.58 | 29.99 | 31.05 |
| Scenario 6 | 25.28 | 30.06 | 30.88 |
The analysis for June 21 was from a height of 1.5 meters, as shown in Table 5. The hottest and coldest average temperature have a red and green color, respectively. At 7 a.m., Scenarios 6 and 5 had the lowest and highest average temperature of 25.28 °C and 0.3 °C, respectively. Scenarios 1 and 4 had the lowest and highest average temperature of 29.98 °C and 0.1 °C at 12 p.m., respectively. Meanwhile, at 5 p.m., Scenarios 1 and 5 had the lowest and highest average temperature of 30.86 °C and 0.19 °C, respectively.
August 9
The following are the results of the analysis for August 9.
| Mean Air Temperature (°C) | ||||
|---|---|---|---|---|
| 07.00 | 12.00 | 17.00 | ||
| Scenario 1 | 24.74 | 29.24 | 30.68 | |
| Scenario 2 | 24.75 | 29.29 | 30.70 | |
| Scenario 3 | 24.78 | 29.32 | 30.88 | |
| Scenario 4 | 24.80 | 29.42 | 30.75 | |
| Scenario 5 | 24.81 | 29.48 | 30.82 | |
| Scenario 6 | 24.80 | 29.18 | 30.59 | |
Table 6. The results of the microclimate analysis for August 9.
The analysis for August 9 was from a height of 1.5 meters, as shown in Table 6. The hottest and coldest average temperature have a red color and green color, respectively. At 7 a.m., Scenarios 1 and 5 had the lowest and highest average temperature of 24.74 °C and 0.07 °C, respectively. Meanwhile, at 12 p.m., Scenarios 6 and 5 had the lowest and highest average temperature of 29.18 °C and 0.3 °C, respectively. At 5 p.m., Scenario 6 and 3 had the lowest and highest average temperature of 30.59 °C and 0.29 °C, respectively.
October 3
The following are the results of the analysis for October 3.
Table 7. The results of the microclimate analysis for October 3.
| Mean Air Temperature (°C) | ||||
|---|---|---|---|---|
| 07.00 | 12.00 | 17.00 | ||
| Scenario 1 | 25.87 | 30.52 | 31.62 | |
| Scenario 2 | 25.88 | 30.54 | 31.68 | |
| Scenario 3 | 25.89 | 30.58 | 31.82 | |
| Scenario 4 | 25.90 | 30.68 | 31.72 | |
| Scenario 5 | 25.91 | 30.70 | 31.80 | |
| Scenario 6 | 25.92 | 30.52 | 31.58 | |
The analysis for October 3 was from a height of 1.5 meters (Table 7). The hottest and coldest average temperature have a red color and green color, respectively. At 7 a.m., Scenarios 1 and 6 had the lowest and highest average temperature of 25.87 °C and 0.05 °C, respectively. Scenarios 1 and 6 had the lowest average temperature of 30.52 °C, while 5 had the highest average of 0.18 °C at 12 p.m., respectively. At 5 p.m., Scenarios 6 and 3 had the lowest and highest average temperature of 31.58 °C and 0.24 °C, respectively.
December 21
The following are the results of the analysis for December 21.
Table 8. The results of the microclimate analysis for December 21.
| Mean Air Temperature (°C) | |||
|---|---|---|---|
| 07.00 | 12.00 | 17.00 | |
| Scenario 1 | 25.17 | 28.30 | 29.14 |
| Scenario 2 | 25.17 | 28.35 | 29.16 |
| Scenario 3 | 25.19 | 28.45 | 29.39 |
| Scenario 4 | 25.17 | 28.68 | 29.37 |
| Scenario 5 | 25.18 | 28.72 | 29.44 |
| Scenario 6 | 25.15 | 28.52 | 29.22 |
The analysis for December 21 as from a height of 1.5 meters, as shown in Table 8. The hottest and coldest average temperature have a red and green color. At 7 a.m., Scenarios 6 and 3 had the lowest and highest average temperature of 25.15 °C and 0.04 °C, respectively. Scenarios 1 and 5 had the lowest and highest average temperature of 28.3 °C and 0.42 °C at 12 p.m., respectively. At 5 p.m., Scenarios 1 and 5 had the lowest and highest average temperature of 29.14 °C and 0.3 °C, respectively.
Discussion
The difference in average air temperature between the scenarios was insignificant. The most striking difference occurred on December 21 at 12.00 p.m., which was a temperature difference of 0.42 °C between the scenarios with the highest and lowest average air temperatures. Even though the difference is not apparent, the scenarios with more green space had a lower average air temperature. The relatively small analysis area of (49 x 49) m2 may be the cause of this. Yu et al. found that green space can affect the microclimate when the area is larger than 5.6 hectares (Yu et al., 2020).
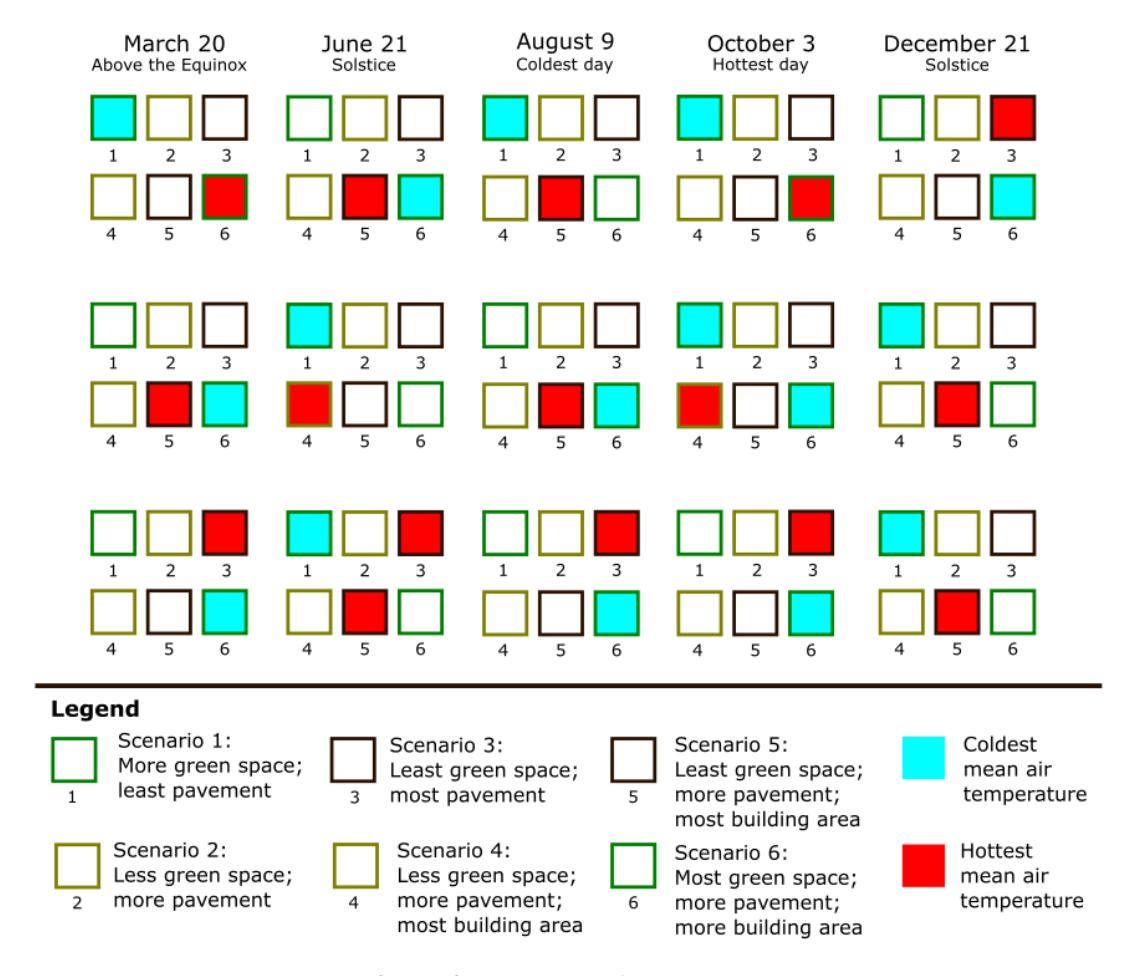
Figure 2. Summary of the analysis.
Scenarios with more green space had lower average air temperatures. In this context, Scenario 1 had the lowest average temperature (eight times), followed by Scenario 6 (seven times). These two scenarios had the most area of green space compared to the others. Even though Scenario 6
had more green space, while Scenario 1 had a lower average air temperature. This is caused by the larger pavement area in Scenario 6 compared to 1. Rui et al. reported that in Nanjing (China), with a humid subtropical climate (Cfa), grass and shrubs had a significant effect on thermal comfort and air pollution when compared to other ground covers (Rui, Buccolieri, Gao, Ding, & Shen, 2018).
The scenario with the most extensive pavement and building areas had the highest average air temperature. Scenarios 3 and 5 had the highest average temperature for five and seven times, respectively. Meanwhile, Scenario 5 drew on time with an average highest temperature of 7 a.m. to 5 p.m. The results show that Scenario 3 had more average highest temperatures at 5 p.m. Yuan et al. found that building area at 44.6% was the most influential aspect in cooling followed by green area (GCR) at 21.0% (Yuan et al., 2021). However, the scenario with the highest area of green space also had the highest average temperature. Scenario 6 had the highest average air temperature at 7 a.m. on March 20 and October 3. On the same date, Scenario 6 had the lowest average temperature at 12 p.m. Šír et al. mentioned the case where changes in air temperature for grass as ground cover fluctuate over a period (Šír, Tesař, Lichner, & Czachor, 2014). The building and pavement areas also affect an increase in air temperature. Scenario 6 had larger building and pavement areas than Scenario 1. In addition, the scenario with a pavement area that was not as wide as the others also had the hottest average air temperature. Scenario 4 had the highest average temperature on June 21 and October 3 at 12 p.m. The temperature was comparatively lower than in Scenario 5 and 3 at 5 p.m., respectively. Meanwhile, Scenario 4 had less pavement area than Scenarios 5 and 3. Scenarios 4 and 5 had the same building area and were the largest among the others. The angle of the sun can affect the exposed parts and an increase in building area increases air temperature (Yuan et al., 2021). In addition, air temperatures can increase because of transpiration. The results show that Scenario 4 had the highest average air temperature. Šír et al. found that grass can release heat during the day due to transpiration (Šír et al., 2014).
There is a complex relationship between the position of the sun, wind, surface area of the material, type of exposed material, building shape, and height. Scenario 1 had lower temperatures several times more compared to Scenario 6. This contrasts with the expectation of green space cooling the air temperature. Additionally, Scenario 6 had 11.11% more green space than 1 and the position of the sun in the simulation appears to affect the air temperature due to the amount of solar radiation (Shrestha, Thapa, and Gautam, 2019). The surface area and type of surface material exposed to solar radiation also affect the ambient air temperature. Scenario 1 had lower air temperatures compared to 6 during the solstices at 12:00 p.m. and 05:00 p.m. Subsequently, Scenario 1 had a lower air temperature than 6 at 07:00 p.m. on March 20, August 9, and October 3.
The wind at 07:00 p.m. had a higher air temperature than the surroundings in the simulation. The effect was more prevalent in Scenario 6 since the building shape was not varied. The wind bounces back to the surrounding area of the building in Scenario 6. This issue was also reported by Kabošová, Kmet', and Katunský, who analyzed wind flow on building shapes using Grasshopper on Rhinoceros. The results showed that the shape of the building surface affected the distribution of wind on the site (Kabošová, Kmet', & Katunský, 2020). Li, Liu, and Gao conducted research using a wind tunnel to test the effect of wind flow on building shapes. An Hshaped structure makes the airflow more intense than a rectangular shape (Li, Liu, & Gao, 2015). Therefore, Scenario 6 tended to be hotter than the others at 07.00 p.m. since the shape of the building affects the air temperature of the surroundings.
At 12.00 p.m. and 05.00 p.m., Scenario 6 had a lower air temperature than the others because of the presence of wind. This case also occurred in research conducted by Priyadarsini and Wong, who found that tall buildings among low-rise buildings could increase wind speed by 90% and reduce air temperature by 1 °C (Priyadarsini and Wong, 2005). Therefore, wind with a lower temperature than the surroundings increases the coldness of the environment. The height of the building has a greater role in influencing the air temperature of the surroundings than the shape of the building.
The surface area and type of exposed material affect air temperature due to interactions with solar radiation and wind. The types of materials in this research were buildings, sidewalks, or vegetation. Scenario 3 had the largest building and pavement surface area of 2,768.5 m² and 44.46% of land area. Meanwhile, Scenarios 5 and 4 had the largest building floor area of 54.69%. Scenario 5 did not have any green space but possessed the highest air temperature. This issue also appeared in the research by Ola et al., who analyzed building surface areas. The largest area contributed to the highest air temperature in all climate zones using Sefaira (Ola et al., 2021). The results suggest that exposed surface areas also affect air temperature.
Comparison with other studies
Several research have analyzed the influence of green space in tropical climates. Tukiran et al. examined five scenarios with varying tree coverage and density canopy in Penang, Malaysia, using on-site measurement and ENVI-met. According to the simulation results, reflective pavements on the ground and the addition of 20% trees with a very dense canopy reduced air temperature by a maximum of 1.16 °C (Tukiran, Ariffin, & Ghani, 2017). The investigation reported that ground surface and trees had an impact on air temperature.
Wong and Jusuf used on-site measurement to investigate the cooling effects within various green canyon formations in Singapore. According to the results, vegetation cover and the shading provided by structures and trees affect the coldness of canyons (Wong and Jusuf, 2010). This research showed that the effects of green space differed depending on the surroundings. In addition, several other studies examined private green space. Lacan et al. analyzed the conversion of private green space to non-green open space in low-density settlements in San José, California (Laćan et al., 2020). The results showed that 11% of green space in residential areas was converted to non-green open space. Meanwhile, Al-Kofahi et al. examined the distribution, type, and density of private green space in Irbid, Jordan (Al-Kofahi et al., 2019). In this research, 62% of housing units in Irbid had gardens and the distribution was uneven across districts. Tahvonen states that the distribution of private green space affected regional water infiltration in Vuores, Finland (Tahvonen, 2018). The appropriate scale and design of green plots were beneficial for stormwater management in Vuores.
Offered solutions for more comfortable outdoor space
Green space considers the level of heat emission in building and pavement materials. The built environment plays a more significant role than green space in influencing air temperature (Yuan et al., 2021). Therefore, more holistic innovations in the future need to consider the building and pavements materials since these factors affect temperature. Increasing the built environment is unavoidable due to space requirements and high population. The solution needs to be a multiangle method to overcome the complex problems of rapid urbanization.
Urban people spend more time outdoors when the air temperature is comfortable (L. Zhang et al., 2020). Outdoor activities can affect health positively since exposure to sunlight is important for the vitamin D needs of the body. Approximately one in three children in Jakarta, Indonesia, does not have sufficient exposure to sunlight (Pulungan, Soesanti, Tridjaja, & Batubara, 2021). People are motivated to exercise outdoors when the environment is beautiful and green (Kondo, Fluehr, McKeon, & Branas, 2018). In addition, green space also promotes outdoor physical activity, which positively affects health (Jennings & Bamkole, 2019). Outdoor space is more influential in enabling people to exercise (Lacharité-Lemieux et al., 2015). Therefore, the effect of green space on outdoor air temperatures must be considered.
Developers also need to focus on the contribution of improving the environment (Helbrecht & Weber-Newth, 2018). Future development should focus on the quality rather than the quantity of green space, as well as ensuring its addition in areas with limitations (Madureira, Nunes, Oliveira, & Madureira, 2018). Landscape designers should consider biodiversity in residential gardens and yards where several elements such as garden size, property size, and building permits are regulated (van Heezik, Freeman, Porter, & Dickinson, 2013). Collaboration between the government and the private sector can overcome the shortage of green space.
The community aspect also needs to be considered and caring for green space is considered difficult when there are no resources, energy, and time (Chalmin-Pui et al., 2019). Changing green space into pavements is an effort to reduce maintenance. In addition, public awareness of green space regulations can affect the change of green space into pavements.
Understanding public perceptions of the positive and negative qualities of the natural environment can be a significant consideration in making green space regulations (Drillet et al., 2020). Migrants have a lower place attachment (Łaszkiewicz, Kronenberg, & Marcińczak, 2018), affecting concern for the environment. The change from green space to pavement is lower in settlements of people with upper-middle income (Laćan, Moanga, McBride, & Butsic, 2020). In addition, green space should be integrated into reforestation and aesthetics to maximize the benefits (Ahmad & Simis, 2017).
Limitations
The present research only compared the potential air temperature in several scenarios. Even though the result can mathematically predict the material and spatial coverage impact, there may be several other aspects that impact the temperature. Human activities and vehicles may also influence the temperature. Moreover, the surrounding environment in the simulated scenario could also affect the result, such as when a public green space or a large body of water is nearby. This research only calculated the impact of private green space in housing. Moreover, there are also some disadvantages of using a simulation. First, software simulation is different from field measurement. The lack of climate data is an obstacle since the simulation only includes air temperature, wind speed, direction, and relative humidity. In addition, the temperature results are calculated mathematically. Controlled variables calculated mathematically cannot precisely simulate unpredictable atmospheric conditions. The result is unable to predict the air temperature with certainty. However, the influence of ground cover and the built environment in small-scale environmental areas can be understood by simulating the potential air temperature in private green spaces.
Conclusion
In conclusion, the problem of high air temperatures because of UHI is more complex than only a lack of green space. An increase in green space did not indicate a decrease in air temperature, especially when accompanied by large building and pavement areas. However, the scenarios with lots of green space had the lowest average air temperatures. The private green space in this research was in housing with a middle to upper-income demographic. Scenarios 1 and 6 had the lowest temperatures due to the area of green space. Meanwhile, Scenarios 3 and 5 had the highest average air temperature because of the largest building and pavement areas.
The type of material affected the high air temperature in the afternoon. The hottest scenarios in the morning may change in the afternoon and evening. This appeared in Scenario 6 on March 20 and October 3 at 7 a.m. However, Scenario 6 had the lowest average temperature at 12 p.m. and 5 p.m. on the same dates. The average temperature was the hottest in Scenario 4 on June 21 and October 3 at 12 p.m. On similar dates, Scenario 3 had the hottest average temperature at 5 p.m. Building and pavement materials have heat retention, hence heat received in the morning until noon will be released in the afternoon.
in Bekasi City has led to the development of vacant land with the increasing population. Bekasi City has a fairly high population density, reaching 12,000 people per km² in 2022 (Astika, 2023). This is due to the large number of factories in Bekasi area and the location of the city close to Jakarta, the capital city of Indonesia. The economic sector is the largest, with 16.96% in 2024 (Gayati, 2024). Meanwhile, the economic growth rate increased from 3.32% in 2021 to 4.96% in 2022 (Kurniawansyah, 2023). This has created an uneven population distribution because people appreciate areas with a vibrant economy. This also increases the potential for informal settlements due to the inadequate availability of affordable housing as a result of the diverse non-formal jobs found in a vibrant economy. Informal settlements trigger UHI due to the density of the population and building materials. Asbestos and zinc are often used for roofs in Indonesia (Laksono, 2022) while dense vehicle traffic causes the air temperature to become uncomfortable. As the city develops, existing green space is further managed and maintained, especially for aesthetics (Pearsall & Eller, 2020; Wu & Rowe, 2022). This issue could be carefully investigated to control urban development.