
Introduction
The transport mode share of motorcycles is 75.8% within the Jakarta Megapolitan Area (JICA & ALMEC Corporation, 2019a) and the share of private car shares is around 14.5%. Meanwhile, public transport shares continue to decline and Jakarta traffic congestion is worsening. The Provincial Government of Jakarta intends to change the Transportation Demand Management (TDM) strategy from an odd-and-even scheme to congestion charging. However, motorcycles have been exempted from the odd-even policy, which means that they might also be exempted from the congestion charging scheme. Exempting motorcycles from congestion charging may result in ineffectiveness of this policy to improve the performance of the transportation system in Jakarta. Therefore, it is worthwhile to study motorcyclists' response to the introduction of congestion charging.
Most existing studies on road pricing were mainly focused on automobiles, not motorcycles (Tsai et al., 2015). Most of them partially examined the effect of congestion charging. For example, they only examined modal shifting, such as the study by Agarwal and Koo (2016) regarding the effect of congestion charging on modal
1 Land Transportation Polytechnic Indonesia-STTD (*Corresponding author: yugi.hartiman@ptdisttd.ac.id)
2 Transport Policy Agency, MoT Indonesia
Journal of Regional and City Planning vol. 36, no. 1, page. 22-43, April 2025
shifting to public transport in Singapore. Other researchers examined the effect of congestion charging on modal shifting in Jakarta, Indonesia (Belgiawan et al., 2019; Harry Budiutomo Harmadi et al., 2015; Ilahi et al., 2019; Nanang & Tamin, 2009; Yudhistira, 2015; Yudhistira et al., 2017). Research on the effect of congestion charging on route diversion was conducted in Jakarta by Rizki et al. (2016). Meanwhile, the effect of congestion charging on telecommuting was investigated by Dissanayake (2008) in Bangkok, using the nested logit model. A recent study by Yugihartiman et al. (2023) in Jakarta included not only mode switching of transportation but also other travel behaviors, i.e., route changes and the options to not travel and work from home (WFH) but only for commuter trips by car. Chiou & Fu (2017) investigated both car and motorcycle usage in Taiwan, incorporating trip re-scheduling and modal shifting but not route diversion.
Due to the flexible characteristics of motorcycle operation, investigation of route diversion of motorcyclists is important. For Jakarta, replacing the odd-even scheme means that there will be corridor-based congestion charging, which makes it possible for motorcyclists to detour their route or do rat-running. This study aims to investigate the influence of congestion charging on motorcyclists, which is very specific to the case of Jakarta. The sample of the study were motorcyclists who usually pass through eight odd-even corridors, when the oddeven scheme is replaced by a congestion charging scheme. Accordingly, the study emphasized the analysis of link-based or corridor-based congestion charging. In the context of modelling the response related to commuter trips, this research provides novelty in modelling motorcyclist responses to congestion charging and incorporates not only mode switching of transportation but also route detours, and the options to not travel and WFH.
Literature Review
Motorcyclists and congestion charging
In some cases motorcycles are included in congestion charging, while in other cases they are excluded. Motorcycles are exempted from congestion charging in Bergen, London, Milan, and Stockholm because they do not cause congestion and are low in pollution (Baranzini et al., 2021). In Singapore, motorcycles are not exempted from the electronic road pricing (ERP) scheme, which means they have to pay a charge (Olszewski & Xie, 2005). Meanwhile, motorcycles in London must meet the Ultra Low Emission Zone (ULEZ) standards. The ULEZ standards are based on vehicle and emission type, which is EUR 3 for motorcycles, mopeds, motorized tricycles and quadricycles (L category). In Indonesia, according to Law No. 22/2009, Article 133 (Pemerintah Republik Indonesia, 2009) only individual vehicles and goods transportation vehicles can be subjected to congestion charging. However, in Article 70-71 PP 32/2011 (Pemerintah Republik Indonesia, 2011), if the road section volume to capacity ratio (v/c ratio) is >0.5 and there are public transportation services that comply with the minimum service standards, motorcycles may be prohibited from entering certain roads or lanes. In this case, local governments can regulate whether or not motorcycles are permitted to pass through certain streets. Another factor is that the proportion of motorcycle traffic on the main roads in Jakarta based on data from the Provincial Office for Transportation of Jakarta (Dinas Perhubungan, 2021) consists of motorcycles for more than 70%. Therefore, excluding motorcycles will result in the congestion charging scheme not being effective in improving traffic performance in Jakarta.
Chiou & Fu in their study in Taiwan, using a stated preference survey and an MNL model, found that when motorcycle commuters face congestion charging, 46-50% would keep using the road pricing routes, while 42- 47% would choose alternative routes (Chiou & Fu, 2017). Jou et al. (2007) did a study in Taiwan, where motorcycles constitute a large share of the total traffic volume, similar to Jakarta, and found that frequent travelers and high-income groups have a high willingness to pay the charge.
Empirical evidence from London's congestion charging scheme has shown that exempting motorcyclists resulted in motorbike traffic entering charging zones increased by 10-15%, while car traffic decreased by 30% in 2004 (Santos, 2005).
Effects of Congestion Charging on Route Diversion
As stated before, if congestion charging in Jakarta replaces the odd-even scheme, it means that link-based pricing will be implemented. Such a scheme enables travelers to choose alternative routes that are not subject to congestion charging. Considering the weaknesses in link-based pricing, a study in Jakarta investigated three ERP trial corridors and the possibility of commuters choosing alternative routes (route selection behavior) based on commuter trip length (Rizki et al., 2016).
Congestion charging schemes in Norway apart from Trondheim, namely in Oslo and Bergen, can be said to be link-based charging, but these were not aimed at decreasing traffic but to finance road infrastructure, including public transport infrastructure. Another variation of link-based charging is the type of road pricing applied in the USA, which is different from several European practices. In the USA, congestion charging is applied to high-occupancy vehicle (HOV) lanes to become high-occupancy toll (HOT) lanes, introduced for the first time in California in 1990. HOT lanes, also known as managed lanes, now comprise 52 sections in 15 states, over an approximate length of 3,000 km (Poole, 2020). HOT lanes are seen as successful in alleviating traffic jams on these lanes and reducing the travel time of public transport. Research in three cities, Atlanta, Miami, and Minneapolis (Pessaro et al., 2013), found that implementing HOT lanes reduced travel time by 17 minutes in Miami, 5 minutes in Atlanta, and 4.5 minutes in Minneapolis. With the decrease in travel time there was an increase in public transport passengers of 57% in Miami, 13% in Minneapolis, and 11% in Atlanta. Linkbased charging was also implemented at the Sydney Harbor crossing in Australia, successfully reducing traffic by 5% over the Sydney Harbor Bridge (Ockwell & Bullock, 2010).
Research Methods
Models
In this study, a probability choice model, namely the logit model proposed by McFadden (McFadden, 1974), was chosen. The probability of traveller n choosing alternative i is expressed as follows:
\[P_{ni} = Prob \left( U_{ni} + \varepsilon_{ni} > U_{nj} + \varepsilon_{nj} \,\forall \, j \neq i \right)\] \[(1)\]
\[\mathcal{V}_{ni} = Prob\left(\varepsilon_{nj} < \varepsilon_{ni} + U_{ni} - U_{nj} + \forall j \neq 1\right)\] \[\tag{2}\]
If is set (given), then
\[F(\varepsilon_{ni}) = exp^{\left(-exp^{-(\varepsilon_{ni}+U_{ni}-U_{nj})}\right)}\] (4)
After going through complex algebraic calculations, then
\[P_{ni} = \frac{1}{1 + \sum_{j} e^{-(U_{ni} - U_{nj})}}\] (5)
Journal of Regional and City Planning vol. 36, no. 1, page. 22-43, April 2025 DOI: 10.5614/jpwk.2025.36.1.2
\[P_{ni} = \frac{e^{U_{ni}}}{\sum_{j} e^{U_{nj}}}\]
(6)
where,
= probability that decision maker n chooses alternative i
, = utility of choosing alternative i, j
= unknown part of utility of choosing alternative i, j is between 0 and 1 and never has a value of exactly 0 or 1.
In the model, there is one generic variable, namely in-vehicle time (IVT). The congestion charging rates of using a motorcycle passing through the congestion charging corridor (Pmcc) and online motorbike taxis (Ojc) are considered to have the same characteristics. For mass public transportation, the TansJakarta busway (Tjc) and train (Trc) fares are considered to have the same characteristics. Other attributes are load factor, as a proxy for in-vehicle overcrowding (LF), and waiting time (WT).
Table 1. Alternatives, Attributes, and Utility Functions of Alternatives
| No | Alternative | Attributes | Utility Model |
|---|---|---|---|
| 1 | Motorcycle via alternative roads (Pmca) | In-vehicle time (IVT) | |
| 2 | Motorcycle via congestion charging corridor (Pmcc) | In-vehicle time (IVT) Congestion charging (CC) | |
| 3 | Bus Trans Jakarta busway (Tjc) | In-vehicle time (IVT) Fare (Fpub) Waiting Time (WT) Load factor (LF) | |
| 4 | Train (Commuterline, MRT, LRT) (Trc) | In-vehicle time (IVT) Fare (Fpub) Waiting Time (WT) Load factor (LF) | |
| 5 | Online motorbike taxis via congestion-charging corridor (Ojc) | In-vehicle time (IVT) Congestion charging (CC) Fare (Ftx) Waiting time (WT) | |
| 6 | WFH (No choice option) (wfh) | NA |
Therefore, there were six observed attribute coefficients , , , , , ), six alternative specific constants ( , , , , ), and one SDC coefficient ( or or or , or ), or one trip characteristics coefficient ( , or , or , or ). The Ojc alternative was used as the base model, so that the alternative specific constants (ASC) and socio-demographic constant (SDC) were not estimated in the model.
Table 2. Socio-Demographic and Trip Characteristics of Motorcyclist Commuters
| No | Variable | Variable's name |
|---|---|---|
| Socio-Demography Characteristics | ||
| 1 | Income | Inc |
| 2 | Motorcycle Ownership | MOwn |
| 3 | Dummy Job Type | d_JT |
| 4 | Age | Age |
| 5 | Dummy Sex | d_Sex |
| Trip Characteristics | ||
| 1 | Trip Length | Tlth |
| 2 | Trip Frequency | Tfq |
| 3 | Current Travel time | TT |
| 4 | Out-of-Pocket Costs | Opc |
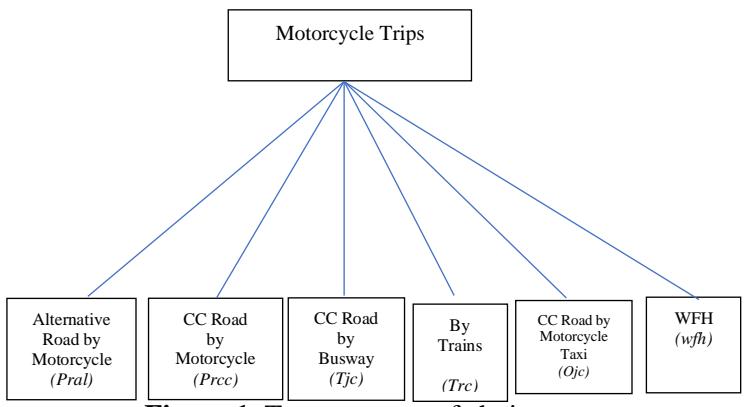
Figure 1. Tree structure of choices.
The following three models were chosen due to their computational simplicity and ease of interpretation (Ben-Akiva & Lerman, 1987; David A. Hensher, John M. Rose, 2005; McFadden, 1974, 2000; Train, 2009). Although many econometric software packages can handle complex statistical analysis, the multinomial logit model (MNL) is easy to interpret and can handle categorical data. The model explains the relationship between predictors and the dependent variable in terms of log odds, making it easier to assess how a change in a predictor influences the odds of choosing a specific category. MNL directly models categorical dependent variables, avoiding the need for arbitrary numerical coding of categories. Another advantage is that wellestablished assumptions like independence of irrelevant alternatives (IIA) are clearly defined, making it easier to validate the model's applicability.
g it easier to validate the model's applicability.
The latter advantage is also a limitation of MNL. The IIA assumption states that the odds ratio between any two outcomes is unaffected by the presence or characteristics of other alternatives, which some consider unrealistic in many contexts. Substitutable options will have correlated choices, which MNL cannot handle properly.
Three sets of models were developed, examining the observed variable on transport impedance, traveler characteristics, and trip characteristics.
1) Model 1 – Multinomial Logit Model (MNL)
The attributes related to alternative modes of transportation or travel routes for the multinomial logit model were: in-vehicle time (IVT), congestion charging rates (CC), mass public transport fares (Fpub), taxi fares (Ftx), and load factor (LF). Each alternative has different attributes.
2) Model 2 – Conditional Logit Model (CL) with traveler characteristics
The attributes related to travelers for the conditional logit model are: income level (Inc), private car ownership (COwn) or motorbike ownership (MOwn), as well as the dummy variable type of work (d_JType). These attributes were invariant or fixed because it is the same individual who chooses the alternatives available in each corridor.
3) Model 3., Conditional Logit Model (CL) with trip characteristics
The attributes related to trip characteristics for conditional logit model (CL) are: trip length (Tlth), trip frequency (Tfq), current travel time from origin to destination (TT), and current out-of-pocket costs (Opc) for the current trip from origin to destination. These attributes were also considered invariant for each trip-making commuter.
The part that could not be explained by a variable or attribute vector, which is the constant for each utility function, was assumed to be specific for all available alternatives; this is referred to as the alternative specific constant (ASC).
Questionnaire Design
Hypothetical situations were set, when congestion charging was applied at a certain level of transport impedances for each alternative, where each respondent chooses one alternative from a set of choices. Attribute values were first collected. These included travel time, toll fees, public transport fares as well as initial settings for congestion charging values based on surveys of previous travel time values.
Table 3. Stated Preference Choice Cards
| Route/mode Alternatives | Choose Alternative Route by Motorcycle | Choose Congestion Charging Corridors by Motorcycle | Choose Trans Jakarta Busway | Choose Train (Commuter Line, MRT, LRT | Choose Motorbike Taxi through Congestion Charging Corridors | Choose not to Travel |
|---|---|---|---|---|---|---|
| Pmca | Pmcc | Tjc | Trc | Ojc | wfh | |
| Travel time (minutes) | 45,60,75 | 15,20,25 | 15,20,25 | 10,20,30 | 15,20,25 | − |
| Congestion charging (thousand IDR) | − | 6, 7.5, 9 | − | − | 6, 7.5, 9 | − |
| Public transport fares (thousand IDR) | − | − | 3.5, 5, 6.5 | 3,5,10 | 25,35,45 | − |
| Waiting time (minutes) | − | − | 5,10,20 | 20,20,30 | 5,10,15 | − |
| Load factor (%) | − | − | 50,100,150 | 50,100,150 | − | − |
| I will choose | A | B | C | D | E | F |
− = Not relevant
In this study, scenarios were generated using Efficient Design with Software Choice Metrics Ngene, with the parameters estimated to be statistically efficient. With this software it is also possible to create blocking, or subset questions for each respondent, so that the respondent does not need to answer all the questions in that choice set or scenario but only one block of questions. The number of choice situations was 40 choices. The 40 sets of questions were divided into 10 blocks. Thus, each respondent only answered 4 scenarios or preferred situations, with each choice set consisting of 10 choices or alternatives. Respondents chose 1 out of 10 blocks, based on the last number of their cell phone number.
Sampling Method
The research objects were motorcyclists who passed through eight even-odd corridors. Sampling was done using purposive sampling by distributing questionnaire links through various social media. The survey was conducted for thirty days, from October to November 2022. The e-survey method was chosen due to the high internet penetration rate, which is around 85.5% in Jakarta, and more than 80% in nearby provinces, namely 82.4% in West Java, and 81.0% in Banten (Badan Pusat Statistik/BPS-Statistics Indonesia, 2020). Some respondents who were not included in the selected sample did not need to continue completing the stated preference questionnaire. Those who rode motorcycles and passed through the even-odd corridors were sampled and had to complete the questionnaire.
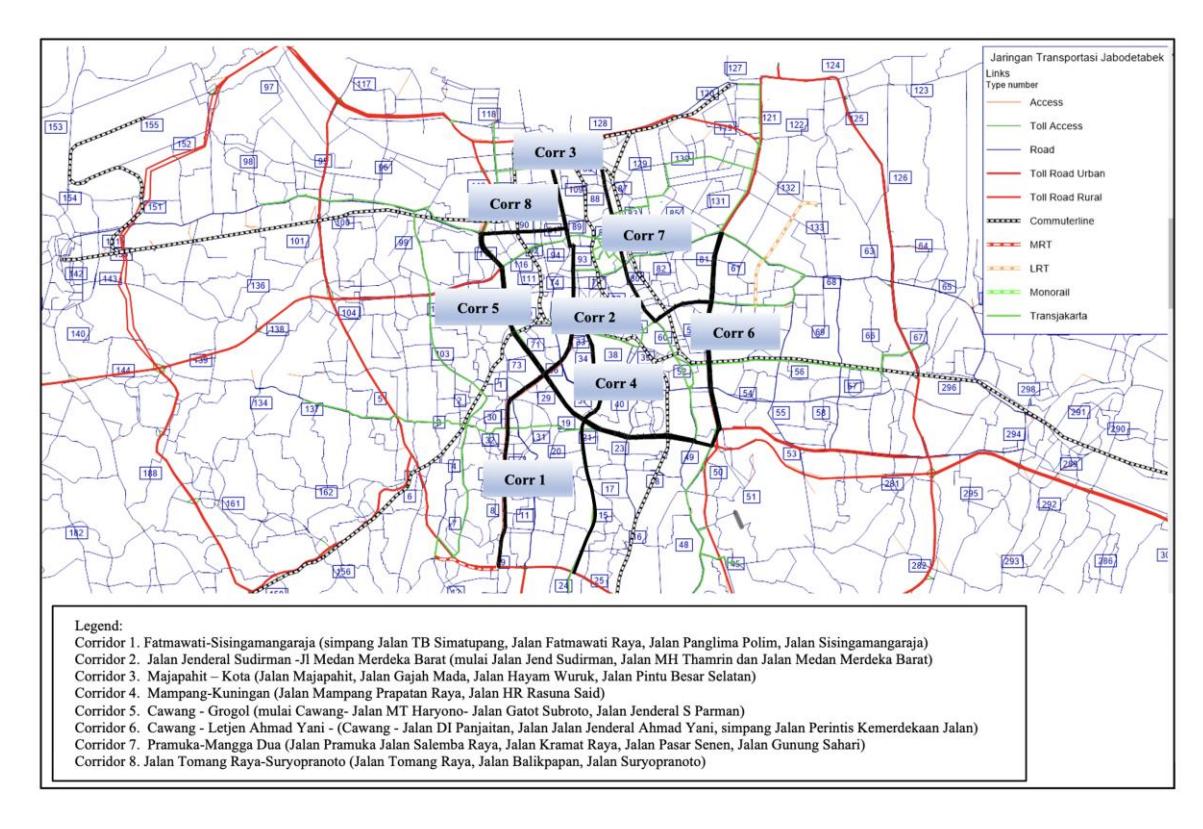
Figure 2. Odd-even corridors.
Population
The population consisted of motorcyclists passing through eight odd-even corridors. The daily average traffic volume, based on traffic count survey data from the local office of transportation, is presented in Table 4. The number of trips by motorcycle was estimated by multiplying the motorcycle volume by occupancy at 1.4 passengers per vehicle (JICA & ALMEC Corporation, 2019).
Table 4. Traffic Volume of Each Odd-Even Corridors, September 2021
| No | Corridor* | Motorcycle Volume (vehicles/day) | Commuter Trips by Motorcycle (persons/day) |
|---|---|---|---|
| 1 | Corridor 1 | 49,802 | 69,723 |
| 2 | Corridor 2 | 81,165 | 113,631 |
| 3 | Corridor 3 | 65,019 | 91,027 |
Journal of Regional and City Planning vol. 36, no. 1, page. 22-43, April 2025
| No | Corridor* | Motorcycle Volume (vehicles/day) | Commuter Trips by Motorcycle (persons/day) |
|---|---|---|---|
| 4 | Corridor 4 | 105,695 | 147,973 |
| 5 | Corridor 5 | 117,810 | 164,934 |
| 6 | Corridor 6 | 141,030 | 197,442 |
| 7 | Corridor 7 | 136,118 | 190,565 |
| 8 | Corridor 8 | 85,889 | 120,245 |
| Total | 782,527 | 1,095,538 |
Source: Analysis from SPLL Data, Dishub DKI Jakarta
The corridors refer to the odd-even schemes' corridors in Figure 2, which is in accordance with Governor's Regulation Number 88/019 about Amendment to Governor's Regulation Number 155/2018 on Traffic Restrictions with Odd-Even System. Every corridor is made up of stretches of road segments. The highest
Figure 3. Sampling framework.
(7)
where
B = bound of error = 5%
P = Q = moderate estimate of proportion = 0.5
D = B2/4 = 0.000625
traffic volumes along each corridor's road segments served as the representative traffic volumes.
Sample Selection
The number of Jabodetabek respondents who filled in the questionnaire was 2,125 respondents, of which 1,509 traveled to Jakarta. Of the 1,509 respondents who traveled to Jakarta, 29.87% (401 people) used public transportation, most of whom used trains (KRL, MRT, LRT), online motorcycle taxis (ojeks), and online taxis/taxi. Meanwhile, the largest proportion used a motorcycle, namely 41.35% (624 people) and 32.07% (484 people) used a private vehicle. Then, those who usually passed through the 8 corridors studied were 526 motorcyclists, however, 421 (77.11%) showed trading behavior. Meanwhile, 125 (22.89%) respondents always chose the same route, regardless of the values of the attributes. Nontrading behavior will affect the estimated coefficients (Rose et al., 2011). Therefore, the number of respondents who were included in the parameter estimates was 421 respondents, producing 1,684 data points. This sample number exceeds the minimum sample in simple random sampling (400 respondents).
\[n = \frac{(1,095,538)(0.5)(0.5)}{(1.095,538-1)(0.000625)+(0.5)(0.5)} = 400\] respondents
Research Findings And Discussion
Socio-Demographic Data
The socio-demographic characteristics of the respondents are shown in Table 5. Five socio-demographic groups were analyzed to see the heterogeneity of the respondents and their responses to congestion charging. The five groups were: income group, motorcycle ownership, dummy variable job type, age, and dummy variable sex. These relate to individuals' prejudices (or taste) towards the alternatives (David A. Hensher, John M. Rose, 2005). There are some studies on travel demand that examined similar socio-demographic characteristics (Amirnazmiafshar & Diana, 2022; Meester et al., 2024; Metz, 2012; Pourhashem et al., 2016).
The monthly income of about 81.23% of the motorcyclists was under IDR 7 million (USD 500). They were mostly young people (65.56%), and male. They mostly owned one motorcycle (75.77%), and 95.01 of them were mandated to be present in their workplaces.
Table 5. Socio-Demographic Characteristics of Motorcycle Respondents
| Motorcycle | |||
|---|---|---|---|
| No | Socio-Demographic Characteristics | Sample | % |
| Income Group/month | |||
| 1 | < IDR 3 million | 72 | 17.10 |
| 2 | IDR 4 million – IDR 7 million | 270 | 64.13 |
| 3 | IDR 8 million – IDR 13 million | 54 | 12.83 |
| 4 | IDR 14 million – IDR 20 million | 16 | 3.80 |
| 5 | IDR 21 million – IDR 30 million | 7 | 1.66 |
| 6 | > IDR 31 million | 2 | 0.48 |
| Motorcycle Ownership | |||
| 1 | 0 vehicles | 11 | 2.61 |
| 2 | 1 vehicle | 319 | 75.77 |
| 3 | 2 vehicles | 75 | 17.81 |
| 4 | > 2 vehicles | 16 | 3.80 |
| Job Type | |||
| 1 | Mandatory | 400 | 95.01 |
| 2 | Discretionary | 21 | 4.99 |
| Age | |||
| 1 | 15 – 35 | 276 | 65.56 |
| 2 | 36 – 55 | 139 | 33.02 |
| 3 | > 55 | 6 | 1.43 |
| Sex | |||
| 1 | Male | 319 | 61.22 |
| 2 | Female | 202 | 47.78 |
The heterogeneity of the responses was assessed according to the trip length of commuter trips, frequency of trips per week, current travel time, and out-of-pocket cost per day, as presented in Table 6. These trip characteristics were considered to influence the preferences of choosing transport mode and route under determined attributes (Jeong et al., 2022; Lucas et al., 2016; Miller et al., 2005).
Table 6. Trip Characteristics of Motorcycle Respondents
| No | Trip Characteristics | Motorcycle |
|---|
| Sample % | |||
|---|---|---|---|
| Trip length (Km) | |||
| 1 | < 5 | 44 | 10.45 |
| 2 | 6 – 10 | 52 | 12.35 |
| 3 | 11 – 20 | 102 | 24.23 |
| 4 | 20 – 30 | 111 | 26.37 |
| 5 | 31 – 40 | 51 | 12.11 |
| 6 | > 41 | 61 | 14.49 |
| Trip frequency/week | |||
| 1 | 1 – 2 | 93 | 22.09 |
| 2 | 3 – 4 | 46 | 10.93 |
| 3 | 5 | 158 | 37.53 |
| 4 | 6 – 7 | 124 | 29.45 |
| Travel time (minutes) | |||
| 1 | < 30 | 66 | 15.68 |
| 2 | 31 – 60 | 199 | 47.27 |
| 3 | 61 – 90 | 96 | 22.80 |
| 4 | 91 – 120 | 34 | 8.08 |
| 5 | >120 | 26 | 6.18 |
| Out-of-pocket costs (IDR)/day | |||
| 1 | <10,000 | 56 | 13.30 |
| 2 | 11,000 – 50,000 | 298 | 70.78 |
| 3 | 51,000 – 100,000 | 50 | 11.88 |
| 4 | >101,000 | 17 | 4.04 |
Respondents Opinion on Congestion Charging
The percentage of motorcycle users who agreed with the congestion charging scheme was 42.28%. This means that the majority of motorcyclists (57.72%) disagreed with the implementation of congestion charging. Acceptance of congestion charging was higher than in Jones (Jones, 1995) in London, where the respondents' acceptance initially was 30%, then rose to 57% when it was stated that the revenue from congestion charging was used to improve public transport services and improve pedestrian and cyclist facilities. With a similar method, Sunitiyoso et al. (2020) conducted research in Jakarta, which showed that in general the public accepted the implementation of congestion charging, at around 75%, and it increased to 85%, when the allocation of congestion charging revenue was informed to improve public transport services, connectivity, and environmental quality. As expected, the level of public acceptance increased in line with their income level and rejection of congestion charging schemes increased among low-income respondents. Out of people with an income lower than IDR 3 million, 69.44% disagreed, and out of motorcyclists with an income of IDR 4 million – IDR 7 million, 60% rejected the congestion charging scheme. This public opinion is an early indication of behavior towards the introduction of a congestion charging scheme in Jakarta.
Table 7. Opinion of Motorcyclists on Congestion Charging
| Do Not Agree | Agree | ||||||
|---|---|---|---|---|---|---|---|
| No. | Income Group (IDR) | Nos. of sample | % | Nos. of sample | % | ||
| 1 | < 3 million | 50 | 69,44 | 22 | 30.56 | ||
| 2 | 4 million –7 million | 162 | 60.00 | 108 | 40.00 | ||
| 3 | 8 million – 13 million | 25 | 46.30 | 29 | 53.70 | ||
| 4 | 14 million – I20 million | 4 | 25.00 | 12 | 75.00 | ||
| 5 | 21 million – 30 million | 2 | 28.57 | 5 | 71.43 | ||
| 6 | > IDR 31 million | 0 | 0.00 | 2 | 100.00 | ||
| 243 | 57.72 | 178 | 42.28 | ||||
Modelling Results
The NLOGIT6 output is shown in Table 2. The value of LL0 was calculated manually using the formula \(LL0 = N \ln \left(\frac{1}{nAlt_t}\right)\), where N is the number of observations (1,668 data points). Then, LL0 = -2988,6547. Meanwhile, the LL function and LL at constants only were the direct output from NLOGIT6.
Parameter Estimates of Multinomial Logit Model
Model 1 is a multinomial logit model that only includes the observed main attributes (alternative-specific attributes), without including socio-demographics or trip characteristic attributes. The model focuses on the influence of the measured variables inherent in each alternative. In other words, the model analyzes the decisions of the travelers based entirely on the characteristics of the alternatives themselves. The model is simple and focused, because it only considers the direct influence of the relevant alternative attributes. The preference analysis is clear on how the main attributes influence choice. Of course the model cannot capture individual differences in preferences due to the absence of socio-demographics and cannot analyze the broader context of choice (e.g., travel motivations).
In this model, public transport fare, load factor, and waiting time were not significant at \(\alpha = 0.05\). Then in Model 1a, waiting time was excluded from public transport. Fares and the load factor were also not significant at \(\alpha = 0.05\). In Model 1b, removing the load factor, the three predictor parameters (\(b_{ivt}\), \(b_{cc}\), \(b_{fpub}\)) were significant at \(\alpha = 0.05\) and \(\alpha = 0.01\). Five alternative specific constants (ASC) of six alternatives (\(a_{mca}\), \(a_{mcc}\), \(a_{tjc}\), \(a_{trc}\), \(a_{WFH}\)) were significant at \(\alpha = 0.01\). The ASC motorcycle taxi was used as the base model, not estimated. Thus, Model 1b, by removing the waiting time and load factor variables, was the best model for statistical parameter estimates.
The load factor as a proxy of the level of public transport overcrowding was not significant. This may be related to the income of the motorcyclists, where 81.23% had an income under IDR 7 million and 66.98% were frequent travelers (see Table 5) who do not consider the load factor to be a problem. As for 10 to 30 minutes waiting time, some travelers may not take it into consideration when commuting.
With a -2LL ratio of 51.36878, the overall model fit was higher than the \(\chi 2\) table at degree of freedom k=8 (15.5071). McFadden R<sup>2</sup> was 0.2132. This coefficient is relatively good, because as a rule of thumb, a McFadden Pseudo R<sup>2</sup> between 2 and 4 is good (Hensher et al., 2005).
From the modelling results of Model 1b, the coefficient of in-vehicle time, congestion charging levy, and mass public transport fares showed negative signs, which indicates that the attribute was the main impedance of urban travel. Travel time, congestion charging levy rates, and mass public transport fares significantly determine the utility for the traveler. Model 1b is a more efficient version of Model 1 that only includes the observed main attributes (alternative-specific attributes).
Table 8. Parameter Estimates and Goodness of Fit of Multinomial Logit Models (Model 1)
| Parameter Estimates | Mod | lel 1. | Mod | lel 1a. | Model 1b. | |||
|---|---|---|---|---|---|---|---|---|
| No | Coefficient | Standard | Coefficient | Standard | Coefficient | Standard | ||
| Coefficient | Error | Coefficient | Error | Coefficient | Error | |||
| 1 | \(a_{mca}\) | 3.59323*** | .27762 | 3.65640*** | .26748 | 3.70823*** | .26541 | |
| 2 | \(a_{mcc}\) | 3.22528*** | .37328 | 3.25338*** | .37210 | 3.26888*** | .37140 | |
| 3 | \(\overline{a_{tic}}\) | 1.62236*** | .37874 | 1.82648*** | .29112 | 2.12216*** | .21598 | |
Journal of Regional and City Planning vol. 36, no. 1, page. 22-43, April 2025
| Mod | lel 1. | Mod | lel 1a. | Mod | el 1b. | ||
|---|---|---|---|---|---|---|---|
| No | Parameter Estimates | Coefficient | Standard Error | Coefficient | Standard Error | Coefficient | Standard Error |
| 4 | \(a_{trc}\) | 1.33491*** | .46074 | 1.61043*** | .32445 | 1.92277*** | .25006 |
| 5 | \(a_{WFH}\) | 34938** | .17607 | 34938** | .17607 | 34938** | .17607 |
| 6 | \(b_{int}\) | 02562*** | .00424 | 02668*** | .00405 | 02757*** | .00401 |
| 7 | \(b_{cc}\) | 10786** | .04428 | 10881** | .04430 | 10853** | .04424 |
| 8 | \(b_{fpub}\) | 03911 | .03277 | 04926 | .03050 | 06269** | .02915 |
| 9 | \(b_{lf}\) | .25423* | .14860 | .21483 | .14106 | _ | _ |
| 10 | \(b_{wt}\) | .00754 | .00895 | _ | _ | _ | _ |
| N | 1668 | 1668 | 1668 | _ | |||
| K | _ | 10 | 9 | 8 | |||
| LL ( | β) | - | - | - | |||
| 2349.92641 | 2350.28189 | 2351.44365 | |||||
| LL(C | C) | -2377.1280 | -2377.1280 | -2377.1280 | |||
| LL(0) | )) | -2988.6547 | -2988.6547 | -2988.6547 | |||
| McF | adden R2 | .2137 | .2136 | .2132 | |||
| \(\chi^2\) | 54.40327 | 53.69230 | 51.36878 | ||||
| 2 | able | 18.307 | 16.619 | 15.5071 |
- = not relevant; *** = significant at 1% level; ** = significant at 5% level; * = significant at 10% level
Parameter Estimates of Conditional Logit Model by Socio-Demographic Characteristics
With this first group of conditional logit models, to examine the heterogeneity effect of different sociodemographics, five socio-demographic attributes were analyzed, namely income, motorcycle ownership, job type, age, and gender of the respondent. In Model 2, by including SDC income as a proxy for unobserved variables in terms of individual characteristics, the options of not to travel or WFH (\(a_{WFH}\)), the ASC WFH constant was not significant, at \(\alpha = 0.05\). Therefore, this alternative was excluded from the model, as was the CL Model 2a, resulting in a significant parameter of estimated income (Inc), at \(\alpha = 0.05\), with a \(b_{inc}\) coefficient of -0.04484, a standard error of 0.01760, and a Wald statistic \(b_{inc}/se\) of 2.548. Meanwhile, the SDC of motorcycle ownership (Mown) produced a parameter estimate of \(b_{mo}\) -0.49215, with a standard error of 0.16889 and a Wald statistic \(b_{mo}/se\) of 2.914. The variables job type, age, and sex were not significant. The option not to travel or WFH was also not significant. This was due to the small number of data points for this alternative; they consisted of only 5.99% of discretionary jobs (see Table 5), with the distinct characteristics of professional freelancers and daily contract workers.
Model 2, which is a conditional logit model, included not only the observed main attributes (alternative-specific attributes) but also socio-demographic variables. By including socio-demographic variables (income, motorcycle ownership, job type, age, and sex), the model could capture preferences that vary across individuals. This was intended to address preference heterogeneity as well as to improve prediction accuracy. Tables 9a and 9b show that model Model 2a (SDC Income) and Model 2b (SDC Motorcycle Ownership) include socio-demographic factors that best represent travellers' preferences toward congestion charging.
Parameter Estimates of the Conditional Logit Model by Trip Characteristics
Model 3, which is a conditional logit model that not only includes the observed main attributes (alternative-specific attributes) and trip characteristic attributes but also several key advantages that can be obtained, such as addressing preference heterogeneity, explaining contextual factors of travel, and improved prediction accuracy.
With the second group of conditional logit models, five characteristics were analyzed to examine travel characteristics, namely weekly trip frequency (btfq), commuter trip length (btl), existing travel time (btt), and out-of-pocket costs (bopc). Referring to the parameter estimation results shown in Table 10, only weekly trip frequency was significant, at α = 0.05, with a btfq coefficient of -0.11466 and a standard error of 0.05841, and a Wald statistic btfq⁄se of 1.963. This is due to 66.9% of the respondents being frequent travelers (see Table 5). For the other travel characteristics, the estimation parameters were not significant. Therefore, the best model considering trip characteristics was Model 3a, where the weekly trip frequency is included in the model.
Table 9. Parameter Estimates and Goodness of Fit of Conditional Logit Model by Socio-Demographic Characteristics (Model 2)
| No | Paramete | Model 2 | Model 2a | Model 2b | Model 2c | Model 2d | Model 2e | ||||||
|---|---|---|---|---|---|---|---|---|---|---|---|---|---|
| r | (SDC Income) | (SDC Income) | (SDC Motorcycle | (SDC Dummy Job | (SDC Age) | (SDC Sex) | |||||||
| Estimate | Ownership) | Type) | |||||||||||
| s | Coefficient | Standar | Coefficient | Standard | Coefficient | Standard | Coefficient | Standard | Coefficient | Standard | Coefficient | Standard | |
| d Error | Error | Error | Error | Error | Error | ||||||||
| 1 | 4.04343*** | .29876 | 4.04817*** | .30150 | 4.38238*** | .36029 | 3.84287*** | .56642 | 3.64045*** | .40978 | 3.63552*** | .35843 | |
| 2 | 3.59935*** | .39503 | 3.64643*** | .39752 | 3.98180*** | .44373 | 3.44538*** | .62216 | 3.24349*** | .48529 | 3.23871*** | .44266 | |
| 3 | 2.45663*** | .25571 | 2.47164*** | .25706 | 2.80560*** | .32381 | 2.26687*** | .54365 | 2.06457*** | .37843 | 2.05944*** | .32250 | |
| 4 | 2.25544*** | .28474 | 2.27518*** | .28613 | 2.61118*** | .34768 | 2.07217*** | .55830 | 1.86997*** | .39862 | 1.86478*** | .34627 | |
| 5 | 01516 | .22300 | − | − | − | − | − | − | − | − | − | − | |
| 6 | 02759*** | .00401 | 02789*** | .00406 | 02789*** | .00406 | 02787*** | .00406 | 02787*** | .00406 | 02788*** | .00406 | |
| 7 | 10799** | .04424 | 11532*** | .04458 | 11549*** | .04458 | 11580*** | .04458 | 11587*** | .04458 | 11590*** | .04458 | |
| 8 | 06268** | .02915 | 06745** | .02928 | 06742** | .02928 | 06743** | .02928 | 06744** | .02927 | 06742** | .02927 | |
| 9 | 04704*** | .01751 | 04484** | .01760 | − | − | − | − | − | − | − | − | |
| 10 | − | − | − | − | 49215*** | .16889 | − | − | − | − | − | − | |
| 11 | − | − | − | − | − | − | 12264 | .52535 | − | − | − | − | |
| 12 | − | − | − | − | − | − | − | − | .06376 | .23037 | − | − | |
| 13 | − | − | − | − | − | − | − | − | − | − | .11204 | .29516 | |
| N | 1668 | 1613 | 1613 | 1613 | 1613 | 1613 | |||||||
| K | 9 | 8 | 8 | 8 | 8 | 8 | |||||||
| LL(B) | -2348.4545 | -2106.7587 | -2105.6279 | -2109.4428 | -2109.4323 | -2109.4004 | |||||||
| LL(C) | -2377.1280 | -2205.4179 | -2205.4179 | -2205.4179 | -2135.5726 | -2135.5726 | |||||||
| LL(0) | -2988,6547 | -2596,0234 | -2596,0234 | -2596,0234 | -2596,0234 | -2596,0234 | |||||||
| 2 McFadden R | .2142 | .1885 | .18890 | .1874 | .1874 | .18744 | |||||||
| 2 χ | 57.34707 | 57.34707 | 57.34707 | 57.34707 | 57.34707 | 57.34707 | |||||||
| 2 χ | Table | 16.619 | 15.507 | 15.507 | 15.507 | 15.507 | 15.507 | ||||||
– = not relevant; *** = significant at 1% level; ** = significant at 5% level; * = significant at 10% level
Table 10. Parameter Estimates and Goodness of Fit of Conditional Logit Model by Trips Characteristics (Model 3)
| Parameter | Model 3a | Model 3b | Model 3c | Model 3d | |
|---|---|---|---|---|---|
| No | Estimates | (Weekly Trip | (Trip Length) | (Current Travel Time) | (Out-of-pocket costs) |
| Freque | ncy) | |||||||
|---|---|---|---|---|---|---|---|---|
| Coefficient | Standard Error | Coefficient | Standard Error | Coefficient | Standard Error | Coefficient | Standard Error | |
| 1 \(a_{mca}\) | 4.28732*** | .40123 | 3.60809*** | .32382 | 3.91646*** | .34546 | 3.53411*** | .31410 |
| \(a_{mcc}\) | 3.89203*** | .47885 | 3.21004*** | .41624 | 3.52070*** | .43344 | 3.13670*** | .40822 |
| \(a_{tic}\) | 2.71309*** | .36973 | 2.03142*** | .28386 | 2.34131*** | .30813 | 1.95839*** | .27181 |
| \(a_{trc}\) | 2.51621*** | .39007 | 1.83701*** | .31043 | 2.14676*** | .33321 | 1.76423*** | .29950 |
| \(b_{int}\) | 02783*** | .00406 | 02789*** | .00406 | 02786*** | .00406 | 02788*** | .00406 |
| \(b_{cc}\) | 11583*** | .04457 | 11582*** | .04458 | 11592*** | .04458 | 11583*** | .04458 |
| 7 \(b_{fpub}\) | 06738** | .02928 | 06743** | .02927 | 06743** | .02927 | 06751** | .02928 |
| 8 \(\overline{b_{tfq}}\) | 11466** | .05841 | _ | _ | - | _ | _ | _ |
| 9 \(b_{t1}\) | _ | _ | .00546 | .00854 | _ | _ | _ | _ |
| \(b_{tt}\) | _ | _ | _ | _ | 00325 | .00364 | _ | _ |
| \(\overline{b_{opc}}\) | _ | - | _ | _ | _ | _ | .00552 | .00491 |
| N | 1613 | 1613 | 1613 | 1613 | ||||
| K | 8 | 8 | 8 | 8 | ||||
| LL(B) | -2107.4220 | -2109.2655 | -2109.0817 | -2108.7748 | ||||
| LL(C) | -2135.5726 | -2135.5726 | -2135.5726 | -2135.5726 | ||||
| LL(0) | -2596.0234 | -2596.0234 | -2596.0234 | -2596.0234 | ||||
| McFadden R2 | .1882 | .1875 | .1876 | .1877 | ||||
| \(\chi^2\) | -56.3012 | -52.6142 | -52.9818 | -53.5956 | ||||
| \(\chi^2\) Table | 15.507 | 15.507 | 15.507 | 15.507 |
- = not relevant; *** = significant at 1% level; ** = significant at 5% level; * = significant at 10% level
Table 11. Comparison of the Significance of Parameter Estimates with Previous Similar Research
| No | Attributes | Motorcycle (Yugihartiman et al., 2023) | Car (Yugihartiman et al., 2023) | All Commuters (Ilahi et al., 2021) | Car and Motorcycle (Rizki et al., 20016) | All Commuters (Belgiawan et al., 2018) | Motorcycle (Chiou et al., 2016) | ||||||
|---|---|---|---|---|---|---|---|---|---|---|---|---|---|
| sign | significance | sign | significance | sign | significance | sign | significance | sign | significance | sign | significance | ||
| 1 | In-vehicle time | _ | sig | _ | sig | - | sig | - | sig | - | sig | _ | sig |
| 2 | Congestion charging | - | sig | - | sig | - | sig | - | sig | - | sig | - | sig |
| 3 | Public transport fare | _ | sig | _ | sig | _ | sig | n/a | n/a | _ | sig | n/a | n/a |
| 4 | Waiting time | + | insig | n/a | n/a | n/a | n/a | n/a | n/a | _ | sig | n/a | n/a |
| 5 | Load factor | + | insig | _ | insig | n/a | n/a | n/a | n/a | n/a | n/a | n/a | n/a |
| 6 | Income | _ | sig | _ | insig | - | sig | - | sig | n/a | n/a | + | sig |
Journal of Regional and City Planning vol. 36, no. 1, page. 22-43, April 2025 DOI: 10.5614/jpwk.2025.36.1.2
| No | Attributes | Motorcycle (Yugihartiman et al., 2023) | Car (Yugihartiman et al., 2023) | All Commuters (Ilahi et al., 2021) | Car and Motorcycle (Rizki et al., 20016) | All Commuters (Belgiawan et al., 2018) | Motorcycle (Chiou et al., 2016) | ||||||
|---|---|---|---|---|---|---|---|---|---|---|---|---|---|
| sign | significance | sign | significance | sign | significance | sign | significance | sign | significance | sign | significance | ||
| 7 | Motorcycle | sig | sig | n/a | n/a | n/a | n/a | n/a | n/a | n/a | n/a | ||
| Ownership | |||||||||||||
| 8 | Dummy_Job type | insig | insig | n/a | n/a | n/a | n/a | n/a | n/a | sig | |||
| 9 | Age | insig | n/a | n/a | sig | n/a | n/a | n/a | n/a | sig | |||
| 10 | Dummy_Sex | insig | n/a | n/a | sig | insig | n/a | n/a | n/a | n/a | |||
| 11 | Trip Frequency | sig | n/a | n/a | n/a | n/a | n/a | n/a | n/a | n/a | sig | ||
| 12 | Trip Length | insig | n/a | n/a | sig | sig | n/a | n/a | n/a | n/a | |||
| 13 | Current travel time | insig | n/a | n/a | n/a | n/a | n/a | n/a | n/a | n/a | n/a | n/a | |
| 14 | Out-of-pocket costs | insig | n/a | n/a | n/a | n/a | n/a | n/a | n/a | n/a | n/a | n/a | |
| 15 | WFH | insig | n/a | n/a | n/a | n/a | n/a | n/a | n/a | n/a | n/a | n/a | |
n/a = not relevant; sig = significant; insig = insignificant
Comparison with Recent Research Results
It was very difficult to compare the results of the present study with previous research, because the response of motorcyclists to congestion charging in Jakarta has not been specifically examined before. The study findings did not differentiate whether the respondents were motorbike users or car users in Yugihartiman et al. (2023), Rizki et al. (2016), Ilahi et al. (2019), Belgiawan et al. (2019), Chiou & Fu (2017). Only Chiou & Fu (2017) made a distinction between motorcycle and private car users in Taipei, Taiwan in 2016 with MNL.
In-vehicle time, congestion charging, and public transport fare were three attributes that consistently showed significance in the six studies compared and their coefficients had negative signs. Likewise, Rizki et al. did not examine public transportation fares because they focused on route diversion. Income was significant in all four studies, except for Yugihartiman et al. (2023) for car commuters. Car ownership was significant in the study of Yugihartiman et al. (2023) but gave a different sign: for motorcycles it gave a negative sign, while for cars it gave a positive sign. In this case, it made sense, in a situation where motorcyclists were able to divert and do rat-running. For weekly trip frequency, this study and the results of Chiou et al. showed significance and negative signs. In other words, more frequent trips can reduce the probability of entering a congestion charging corridor.
Utility and Probability of Each Alternative
Estimating the probability of each alternative was carried out by entering the level of congestion charging for motorcycle users with an initial setting value of IDR 7,500. Other values were calculated based on base value and ceteris paribus.
Table 12. Utilities and Probabilities of Each Alternative Mode and Route
| No | Alternatives | Utility Unit | % Probability | |
|---|---|---|---|---|
| 1 | Motorcycle via alternative | Pmca | 2.06730 | 35.46 |
| 2 | Motorcycles via congestion charging road | Pmcc | 1.90675 | 30.20 |
| 3 | TransJakarta via congestion charging road | Tjc | 1.31224 | 16.66 |
| 4 | Trains via congestion charging road | Trc | 1.07490 | 13.14 |
| 5 | Motorbike taxis via congestion charging road | Ojc | -1.18248 | 1.38 |
| 6 | Choosing WFH | wfh | -0.34938 | 3.16 |
| 100 |
The utility of an alternative was measured in units of utility. Therefore, the utility of an alternative is only meaningful when compared to other utilities (David A. Hensher, John M. Rose, 2005). In this case, the difference in relative utility between alternatives shows the importance of an alternative compared to the alternatives being compared.
The probability of each alternative in Table 12 shows that when a congestion charge of IDR 7,500 was applied to motorcycles, 30.20% of respondents were willing to pay. Meanwhile, 35.46% did route diversion, 29.80% switched to mass transit, and a very small number, i.e., 1.36%, chose online motorcycle taxis. As the number of those who did not commute and carried out activities outside the congestion charging zone was 3.16%.
Table 13 showed a comparison of the results of probability estimation in three studies, both for motorcycles and private cars in the cities of Jakarta (Indonesia) and Taipeh (Taiwan). In both cities, the response to motorbike commuters showed the same number of travelers who would continue to use the charging corridor, namely around 30%. The rest shifted to off-peak hours (Taipeh) and diverted to alternative routes (Jakarta). This is because in Jakarta, the congestion charging scheme is assumed to be implemented over the whole day, because congestion in Jakarta occurs throughout the day. For those who switched to public transportation, motorcyclists in Jakarta were more responsive than motorcyclists in Taipeh.
Table 13. Comparison Probability Response among Studies
| Yugihartiman | Yugihartiman | ||||
|---|---|---|---|---|---|
| Chiou et al. | et al. | et al. | |||
| (Taipeh – 2016) | (Jakarta – | (Jakarta – | |||
| No | Travel choices | 2023) | 2023) | ||
| Car | Motorcycle | Car | Motorcycle | ||
| (n = 710) | (n = 628) | (n = 401) | (n = 421) | ||
| (%) | (%) | (%) | (%) | ||
| 1 | Pay the charge | 32.1 | 28.3 | 48.99 | 30.20 |
| 2 | Shift to off-peak hours/cancel | 37.2 | 42.0 | n/a | n/a |
| the trip | |||||
| 3 | Shift to public transportation | 13.5 | 20.9 | 18.56 | 29.80 |
| 4 | Shift to motorcycle | 17.2 | n/a | 4.70 | n/a |
| 5 | Shift to bikes/walk | n/a | 8.8 | n/a | n/a |
| 6 | Route diversion | n/a | n/a | 22.87 | 35.46 |
| 7 | Shift to motorcycle taxi | n/a | n/a | 3.50 | 1.38 |
| 8 | Decide not to travel | n/a | n/a | 1.22 | 3.16 |
| 100.0 | 100.0 | 100.0 | 100.0 |
The empirical evidence of the effectiveness of congestion charging showed that the average traffic reduction was 23.5% and the shift of private vehicle users to public transportation was an average of 12% (Provonsha & Sifuentes, 2018; Santos, 2005).
Table 14. Effectiveness of Congestion Charging (Evidence from Some Countries)
| No | Congestion Charging Impact | London | Stockholm | Milan | Singapore | Average |
|---|---|---|---|---|---|---|
| 1 | Car traffic reduction | 14%-20% | 18%-21%, | 17%-38,5% | 15%-45% | 23.5% |
| 2 | Shift to public transport | 10% | 4-5% | 12,5% | 21% | 12% |
Source: Modified from Provonsha & Sifuentes, 2018; Santos, 2005
Policy Implications
From the modelling results, in general, motorcycles are sensitive to congestion charging. Due to the large amount of traffic, excluding motorcycles from congestion charging will greatly reduce the effectiveness of the congestion charging scheme. However, implementing congestion charging on a link or corridor basis creates many route diversions, which implies moving congestion from the congestion charging corridor to areas outside the restriction area. The application of link-based congestion charging was predicted to cause a high probability of route diversion to alternative roads, therefore proper traffic management implementation is required, in such a way that private cars and motorcycles do not pass through neighborhood roads. However, motorcyclists mostly are from the low- and middle-income groups, so it is necessary to provide concessionary fares for public transport in Greater Jakarta, and provide free parkand-ride to encourage motorcycle users to switch to public transport.
The probability of modal shifting was quite high. To achieve effectiveness of the implementation of transportation demand management, the application of congestion charging as a scheme that encourages not using private vehicles (push strategy), including motorcycles, must be implemented simultaneously and integrated in one strategy package with attractive schemes for people to use public transportation (pull strategy). For example, by expanding the existing service network and service levels as well as by introducing complementary schemes, such as providing park-and-ride facilities for pedestrians and the like.
Another policy implication is that active involvement of all stakeholders is required through employer-based TDM, where office managers and building managers as well as other land use managers that attract many trips are stimulated to participate in organizing trips to their offices, buildings or places of activity, to limit the use of private vehicles. This may be carried out by provision of office buses, car-pooling, parking restrictions and the like, and being able to manage employee work time through flexible working time arrangements, working-fromanywhere, and provision of co-working spaces.
Conclusion
As hypothesized, congestion charging will greatly affect motorcyclists' behavior within Jakarta. According to the models, the tendency for route diversion is very high – higher than switching modes to public transport. Therefore, choosing a corridor-based congestion charging scheme, even though the main road network is relatively concentric, still allows motorcycle traffic to be diverted to alternative roads, which may reduce the effectiveness of congestion charging. Although the results may not exactly reflect the distribution of traffic all over road networks, the estimated probabilities indicate conditions that are likely to occur.
Imposing congestion charging on Jakarta's main corridors results in a high response from motorcycle commuters. Based on the multinomial logit model, when a congestion charge of IDR 7,500 is applied to motorcycles only 30.20% of motorcycle travelers were willing to pay, Meanwhile, 35.46% did route diversion, 29.80% switched to mass transit, and a very small number (1.36%) chose using online motorcycle taxis. Further, 3.16% chose not to travel or carry out activities outside the congestion charging area. Accordingly, when the rate of congestion charging increases, the marginal effects of motorcycle commuters will have a greater probability of choosing alternative routes and not switching to public transport.
With these findings, implementing the fiscal instrument of TDM, either on a corridor basis or on a link basis, the Jakarta government must anticipate controlling all alternative roads and ensure a sufficient mass public transportation service level. Other researchers are encouraged to study the application of congestion charging to commuters traveling by motorcycle on another basis of congestion charging implementations, such as on a cordon or area basis.