
Introduction
Cities or urban areas are dynamic and complex systems that continuously evolve, challenging traditional notions of urban equilibrium (Batty, 2005, 2017; Batty & Cheshire, 2011; Medda et al., 2009). This dynamic nature presents significant challenges for urban planners in understanding and managing ongoing changes. To comprehend and plan for dynamic urban
2 PT. Sagamartha Ultima Indonesia, Malang, Indonesia
3 Lecturer, Department of Urban and Regional Planning, Institut Teknologi Sepuluh Nopember (ITS), Surabaya, Indonesia
environments, a complex systems approach is essential, acknowledging that urban areas consist of various interconnected elements (Batty, 2009; Baynes, 2009; Nel et al., 2018).
One crucial element in urban dynamics is energy consumption. Equitable and efficient energy distribution poses a key challenge in development planning, given the ever-increasing energy demands associated with urban growth. Energy efficiency has become a global policy objective (SDG 7) (Di Foggia, 2018; Zakari et al., 2022), aiming to reduce carbon dioxide (CO2) emissions (Vehmas et al., 2018). Energy efficiency is seen as one of the solutions to environmental issues (Ibrahim et al., 2023; Radzi & Hassan, 2020). A high level of energy efficiency indicates more sustainable and effective energy consumption (Muniz et al., 2023; Soltangazinov et al., 2020). Conversely, energy consumption is considered inefficient when it requires more energy input than necessary, rendering it unsustainable. However, a major challenge in contemporary urban studies lies in determining which parts of the urban system need optimization or energy efficiency improvements due to energy inefficiency.
The physical configuration of urban areas, known as urban morphology, significantly influences energy consumption levels in urban regions. Factors such as population density, the shape and layout of buildings, and road networks all play vital roles in determining energy consumption rates (Galal, 2019; Li et al., 2024a; Osorio et al., 2017; Tsirigoti & Tsikaloudaki, 2018). Beyond merely understanding the current physical structure of cities, urban morphology studies also aim to analyze how these structures change over time. Using a complex systems approach, researchers can track these dynamic changes and identify emerging trends in energy efficiency or inefficiency based on specific morphological characteristics.
Previous studies have highlighted the significant impact of urban morphology on energy consumption in urban environments. Osorio et al. found that urban characteristics, particularly population density, have a substantial effect on energy consumption in the UK, showing that higher-density areas achieve better energy efficiency (Osorio et al., 2017). Sharlin and Hoffman focused on Seattle, revealing that increasing horizontal building density and reducing height variation led to lower residential energy consumption, emphasizing the spatial dependence of energy use (Sharlin & Hoffman, 1984). Chen et al. demonstrated the spatial relationships between urban morphology indicators and energy consumption, stressing the importance of factors such as building height and vegetation in energy modeling (Chen et al., 2020). Li et al. proposed a framework utilizing spatial proximity analysis and explainable artificial intelligence (AI) to assess urban morphological factors affecting energy consumption, identifying 26 influential urban morphology factors (Li et al., 2024b). Salat analyzed energy consumption in Paris' building stock, revealing that urban morphology has a significant impact on energy efficiency and CO2 emissions (Salat, 2009). Collectively, these studies underscore the need for a comprehensive approach to urban energy modeling that considers the multifaceted interactions between urban morphology and energy consumption.
Despite the growing body of research introducing more factors and tools for urban energy modeling, physical relationships at this level often remain limited due to a lack of consideration for human activity dynamics and the spatial distribution of populations within morphological hierarchies. The present study addressed the empirical knowledge gap by complementing energy efficiency evidence with dynamic human activities represented by nighttime light (NTL) satellite imagery proxies and spatial population distribution data sourced from Big Data.
This method requires further development by linking urban form and energy consumption patterns. Urban morphology is shaped by human activities; the higher the intensity of human activities in a given urban area, the more changes and developments occur in that area's morphology. In a more complex assertion, Frolking et al. argued that human activities contribute to the dynamics of urban morphology and its structural evolution, ultimately
influencing energy use (Frolking et al., 2013). One proxy capable of illustrating human activity and classifying urban morphology is NTL.
This research attempted to use NTL as a tool to accelerate and simplify energy use mapping across various urban morphology hierarchies. NTL can provide a visual representation of artificial light intensity, serving as an indicator of human activity and energy consumption in an area in real time. Researchers worldwide have used NTL data to study urban morphology structures (Han et al., 2018; Z. Yang et al., 2021), as highlighted by previous studies (Afrianto & Graha, 2023; Afrianto & Hariyanto, 2022; Frolking et al., 2013; J. Yang et al., 2022). This is because NTL reflects the intensity of human activity in specific areas (Spinosa, 2022). Furthermore, Light Pollution Maps derived from NTL data have been widely applied in the electricity sector for purposes such as tracking electrification access, mapping transmission and distribution lines, estimating grid stability, and assessing electricity consumption (Baldwin et al., 2017; Falchetta & Noussan, 2019; Lee, 2021; Townsend & Bruce, 2010).
This study sought to explore potential interventions to reduce energy inefficiency across various urban morphology levels. For instance, planning at certain morphological levels that prioritizes public transportation, energy-efficient buildings, and green space development can contribute to reducing overall energy consumption. Moreover, a deeper understanding of how urban morphology influences energy consumption patterns can equip policymakers with insights to design more effective strategies for achieving sustainability goals.
Ultimately, this study aims to offer a new perspective on spatial planning, where electricity planning no longer solely relies on static population data but also considers human activity dynamics as part of urban morphology characteristics. By analyzing the relationship between morphological hierarchies and energy consumption patterns, the outcomes of this research are expected to assist urban planners in designing more efficient and sustainable energy models to meet future urban energy demands.
Literature Review
Energy Efficiency
Population and its activities are the two main factors driving energy demand in urban areas, directly influencing energy consumption levels (Akcin et al., 2016; Arbabi & Mayfield, 2016; Osorio et al., 2017). The larger the population and the more diverse the activities, the greater the energy needed to support various aspects of life. Therefore, a deep understanding of population distribution patterns and activity dynamics is crucial in designing efficient and sustainable energy management strategies.
Previous studies have shown that higher population size and density correlate with better energy efficiency and lower per capita consumption (Arbabi & Mayfield, 2016; Osorio et al., 2017). However, consumption patterns differ between urban and rural areas, with rural regions generally exhibiting distinct patterns in gas, electricity, and transportation usage (Arbabi & Mayfield, 2016; Pachauri, 2012).
Urban areas account for 75% of total global energy consumption and produce 70% of greenhouse gas emissions, making energy optimization an urgent matter (Klemm & Wiese, 2022). This situation poses significant challenges for urban energy systems in achieving sustainability and efficiency. Energy efficiency refers to the extent to which energy is effectively used to produce the desired output (Lin & Zhai, 2023). The higher the energy efficiency, the less energy is required to generate the same amount of output, thereby reducing energy use, costs, greenhouse gas emissions, and air pollution.
Urban Morphology
Urban morphology refers to the physical structure of a city that is constantly changing and updating as a result of urbanization processes (Guo et al., 2022). From that understanding, Nuraini argues that the study of morphology is very focused on urban areas (Nuraini, 2019). Urban morphology is also seen as something that reflects the complex interaction between humans and the urban environment (Yoshida & Omae, 2005). Dempsey et al., explain that urban morphology specifically includes not only a number of physical features but also nonphysical characteristics, such as size, shape, scale, density, land use, building type, block layout, and distribution of green spaces (Dempsey et al., 2008).
Describing and characterizing urban morphology has resulted in many methods being documented in various scientific publications. Pryor provided a terminology gradation between urban and rural at the level of morphology (Pryor, 1968). Urban morphology is divided into six categories, i.e., City Center, Inner Urban, Sub Urban, Urban Fringe, Urban Periphery, and Rural Hinterland. At each level, differences in shape, size, and composition will exist as a representation of the living organism of the city. The concept created by Pryor is a spatial reflection of the urbanization process, which ultimately reveals the relationship between urban and rural areas (Mardiansjah et al., 2021). Figure 1 illustrates these morphology levels graphically. This research attempted to use the concept of urban morphology hierarchy put forth by Pryor.
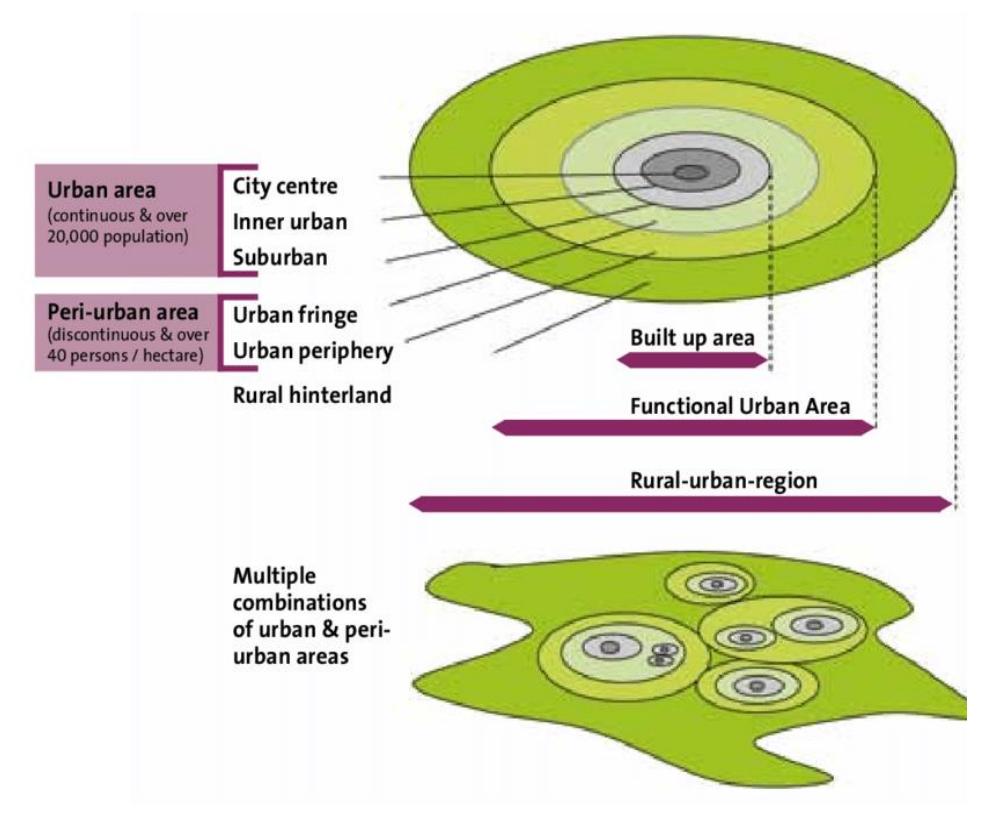
Figure 1. Urban morphology hierarchy. Source: (Pryor, 1968)
Several previous studies have explored the relationship between urban morphology and energy consumption (Juan et al., 2021; Lan et al., 2022; Loeffler et al., 2021; Tsirigoti & Bikas, 2017; Wang et al., 2021; Xie et al., 2023). However, this study differs from earlier research in terms of both terminology and research scale. In terms of terminology, previous studies generally define and discuss urban morphology separately from various physical form factors and city layouts, such as building proportions, distances between buildings, population density, and other physical patterns. In contrast, this study conceptualized urban morphology as the spatial structure of urban areas, incorporating various hierarchical levels, including comparisons between urban and surrounding rural areas, ultimately forming a system and pattern (Russwurm, 1975). Regarding the scale, previous studies only focused on the scale of one building, one block, or one specific urban neighborhood. This may lead to a lack of accuracy in generalizing research results to a larger scale, such as the urban or administrative city level.
The findings of Urquizo et al. (2017) indicate that at the City Center level, a high plot ratio leads to substantial energy consumption for interior temperature control, whereas in the Inner Urban zone, uninsulated solid‐walled terrace houses exhibit significant heat loss ratios, making solid wall insulation retrofits a priority intervention; in the Suburban area, although energy intensity per unit area decreases with reduced building massing, larger room sizes actually increase total energy consumption for heating and cooling; furthermore, in the Urban Fringe, more varied building orientations and optimal solar exposure create significant potential for rooftop solar panel installations; and at the Rural Hinterland level, a very low plot ratio results in the lowest energy demand per square meter while simultaneously offering opportunities for ground‐source heat pump implementation and community microgrid development. From Urquizo et al.'s findings, we can see that these consumption patterns and energy intervention potentials align with Pryor's (1968) urban morphology gradation, which classifies areas from the city center to the countryside based on density and spatial use characteristics (Pryor, 1968; Urquizo et al., 2017).
The use of quantile classification to delineate Pryor's six morphology levels ensures that each category from the City Center to the Rural Hinterland has a comparable number of observations, thereby avoiding empty or overly large categories and enabling balanced energy‐use analysis (Urquizo et al., 2017). This classification also establishes a consistent benchmark across sub‐areas with diverse morphologies, allowing energy intensity comparisons between inner and outer zones to be made at the same scale (Urquizo et al., 2017). Furthermore, since Estiri (2016) demonstrates the power of quantile‐based regression to capture non‐linear variations in residential energy consumption across different housing types and densities, applying quantile classification to Pryor's gradation permits similar advanced statistical modeling within each morphological zone, yielding more nuanced insights than equal‐interval or natural‐breaks schemes (Estiri, 2016).
Material and Methods
In the initial stage, this research conducted a correlation analysis to examine the extent of the relationship between electrification statistical data from the National Statistics Agency and the amount or intensity of light pollution. The higher the correlation coefficient, the greater the likelihood that the Light Pollution Map can be used to identify energy consumption patterns at various levels of morphology.
Furthermore, this research utilized various spatial analyses, particularly for data preprocessing. Zonal statistics, as one of the spatial analysis techniques, was intensively used in this study to calculate the statistical values of NTL and WorldPOP, determined by sub-district administrative boundary polygons and urban morphology categories. In zonal statistics, the data analyzed comes from raster data (e.g., satellite imagery). Additionally, spatial analysis, such as raster-tocontour conversion, is also conducted to visualize the urban morphology. Ultimately, this research produced a delineation of urban morphology, urban morphology based on population, urban morphology based on energy consumption, and urban morphology based on energy efficiency levels.
Area of Study
This study focused on researching the area of Malang City. Malang City is a city in East Java Province (Figure 2) that is renowned for its strong reputation in business, tourism, and education. Based on this, Malang City has a complex land-use pattern, encompassing not only residential areas but also zones for trade and services, education, and offices. As the secondlargest city in East Java Province after Surabaya, Malang City has experienced rapid growth and a high rate of urbanization. Although it is not the most populous city in East Java, its diverse and dynamic activities make Malang City a popular destination for migrants to settle. This dynamic development makes Malang City a relevant subject for study, particularly in understanding and analyzing urban morphology.
Moreover, according to a 2021 report by InRIX, a global traffic data analysis company, Malang City was listed among the top five most congested cities in Indonesia. This fact highlights the significant pressure on the city's transportation infrastructure due to high population density and economic activity, which are closely linked to energy consumption patterns. The congestion and density not only reflect challenges within the transportation system but also illustrate how energy is intensively consumed – from mobility and lighting to domestic and commercial needs.
By selecting Malang City as the study area, this research aimed to provide a deeper understanding of the relationship between urban morphology and energy efficiency. It is also expected to contribute to the development of more effective data-driven policies, particularly in enhancing energy efficiency and promoting more sustainable urban development. Therefore, this study not only reflects the empirical conditions of Malang City but also paves the way for implementing adaptive policies and strategies for a better urban future.
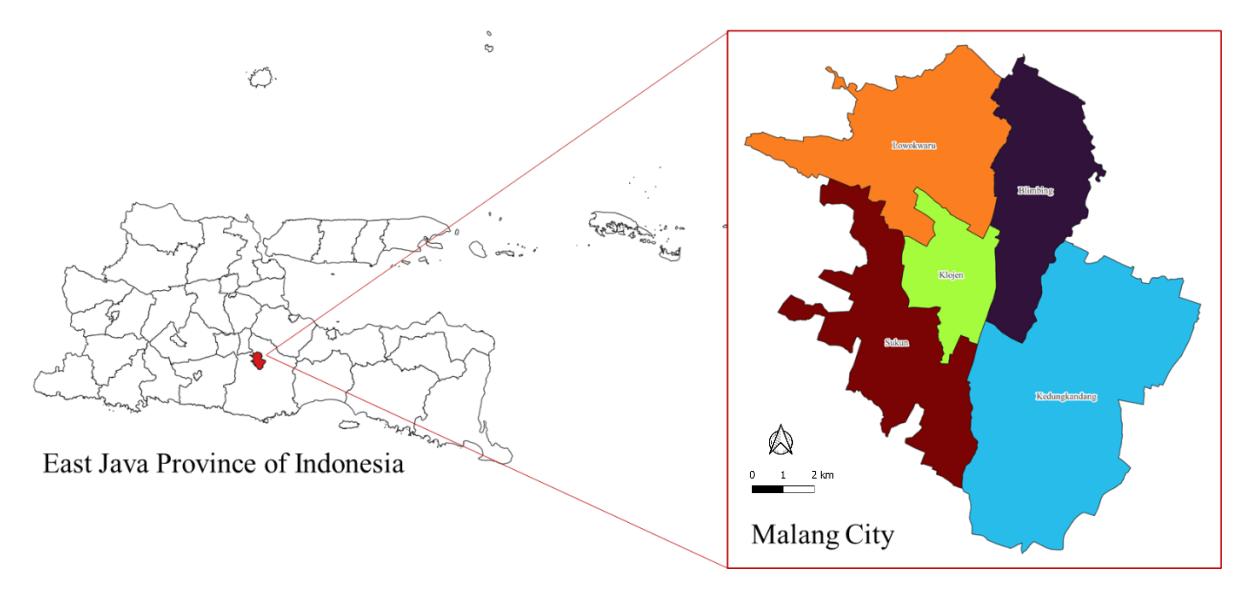
Figure 2. Study area orientation. Source: Author, 2022
Data Sources
The data for this study was gathered from a variety of sources. GADM.org provided administrative area data at the level 3, while WorldPOP.org provided population data from 2012 to 2021. The NTL data, which is Light Pollution Map data 2012-2021, was obtained from
VIIRS data, which was processed and downloaded from lightpollutionmap.info. Another data set is the Malang City installed electricity capacity data 2018-2021 obtained from the National Statistics Agency website. Table 1 contains information about the dataset used in this study.
| Component | Description Data | Data Type and Resolution | Source |
|---|---|---|---|
| Population | Population data, statistically zoned to produce population data at each morphological level | Raster, 100 m | WorldPOP 2021 |
| Electricity | Tabular data of installed electricity capacity (Kwh) | - | BPS Kota Malang, 2022 |
| Light Pollution Map | Used as a proxy for electrification approach and also as a criterion in determining urban morphological categories or hierarchies | Raster, 500 m | lightpollutionmap.info, 2022 |
| Administrative boundaries | Administrative boundaries of Malang City | - | GADM.org, 2022 |
Main Analysis
In this study, energy consumption efficiency was calculated by integrating electrification data (watt/cm².str), population, land area, and nighttime light intensity (Nighttime Light/NTL) to provide an overview of how well electricity is distributed and utilized according to the activities occurring in a given area. By understanding this efficiency, we can assess whether energy consumption aligns with the actual needs of the community and economic activities.
Energy consumption efficiency is calculated using the following formula:
Energy Consumption Efficiency = \[\frac{\text{Electrification (Watt/cm}^2.str)}{\text{Population} \times \text{Area} \times \text{NTL}}\]
This formula reflects the relationship between the amount of energy consumed, population density, geographic scale, and the level of nighttime activity as indicated by artificial lighting. The results of energy efficiency calculations can be interpreted as follows:
- High efficiency value: The higher the efficiency value, the better electricity is utilized according to activities. This means that the energy consumed is more proportional to the population size, land area, and activity levels reflected by nighttime light imagery.
- Low efficiency value: If efficiency is low, there is high electricity consumption but relatively low activity. This condition indicates energy wastage, such as excessive lighting or underutilized electrical infrastructure.
The activity-based energy consumption efficiency approach plays a crucial role in urban energy planning. Some of its applications include:
- This analysis helps identify areas with unbalanced energy distribution, whether due to over-supply (excess supply) or under-utilization (suboptimal usage).
- The results of the analysis can be used to formulate more effective electrification policies, ensuring that electricity is allocated based on the actual needs of each region.
- By comparing electricity consumption and activities detected through NTL, we can evaluate whether a region has an electricity supply surplus relative to its economic activity level.
For example, if a city center shows high electricity consumption but low NTL values, this may indicate energy wastage, such as inefficient public lighting. Conversely, if an industrial or commercial area has high energy efficiency, it means electricity is productively used to support significant economic activities. With this approach, policymakers can develop data-driven energy-saving strategies, improve electricity distribution systems and promote more efficient electricity use to achieve sustainable development goals (SDG-7).
Research Flow
The research flow is a well-structured and systematic process undertaken by researchers to conduct a study or investigation. This flow includes a series of interconnected steps that guide researchers from the initial research question to the final conclusions and recommendations. The process begins with the formulation of clear research questions or objectives, followed by an extensive review of existing literature to understand current knowledge and identify research gaps. Based on this foundation, researchers develop hypotheses or research goals that provide a framework for the study.
The researchers then design the study, selecting appropriate methodologies and defining variables, sample populations, and data collection procedures. Data collection is carried out while ensuring the validity and reliability of the methods used. The collected data is then analyzed using suitable techniques, leading to the interpretation of results and their discussion within the context of the research questions. The research flow concludes with a summary of key findings, their significance, and potential future directions. Throughout the process, researchers maintain careful documentation and consider the ethical implications of their work. By following this systematic flow, researchers ensure the quality and coherence of their studies, contributing to the advancement of knowledge in their respective fields.
This research began with the collection of spatial and tabular data. Within the administrative boundaries of Malang City, raster data obtained from WorldPop for population data and the Light Pollution Map for NTL imagery data underwent zonal statistical processes and clipping. The next step was to examine the relationship between electricity data obtained from the Central Statistics Agency of Malang City and the values from the Light Pollution Map. The resulting values explain the strength of the relationship between these two variables.
After calculating the correlation values, the program generated morphology level maps from 2012 to 2021 using the six-quintile morphology class (Raster to Contour). The next step involved reprocessing zonal statistics before incorporating WorldPop and Light Pollution Map data to analyze data patterns at each morphology level. The results from the previous steps were then compared in a radar chart to obtain the average energy usage level – the average level of energy consumption and per capita energy consumption. The research flow used in this study is illustrated in the chart shown in Figure 3 below.
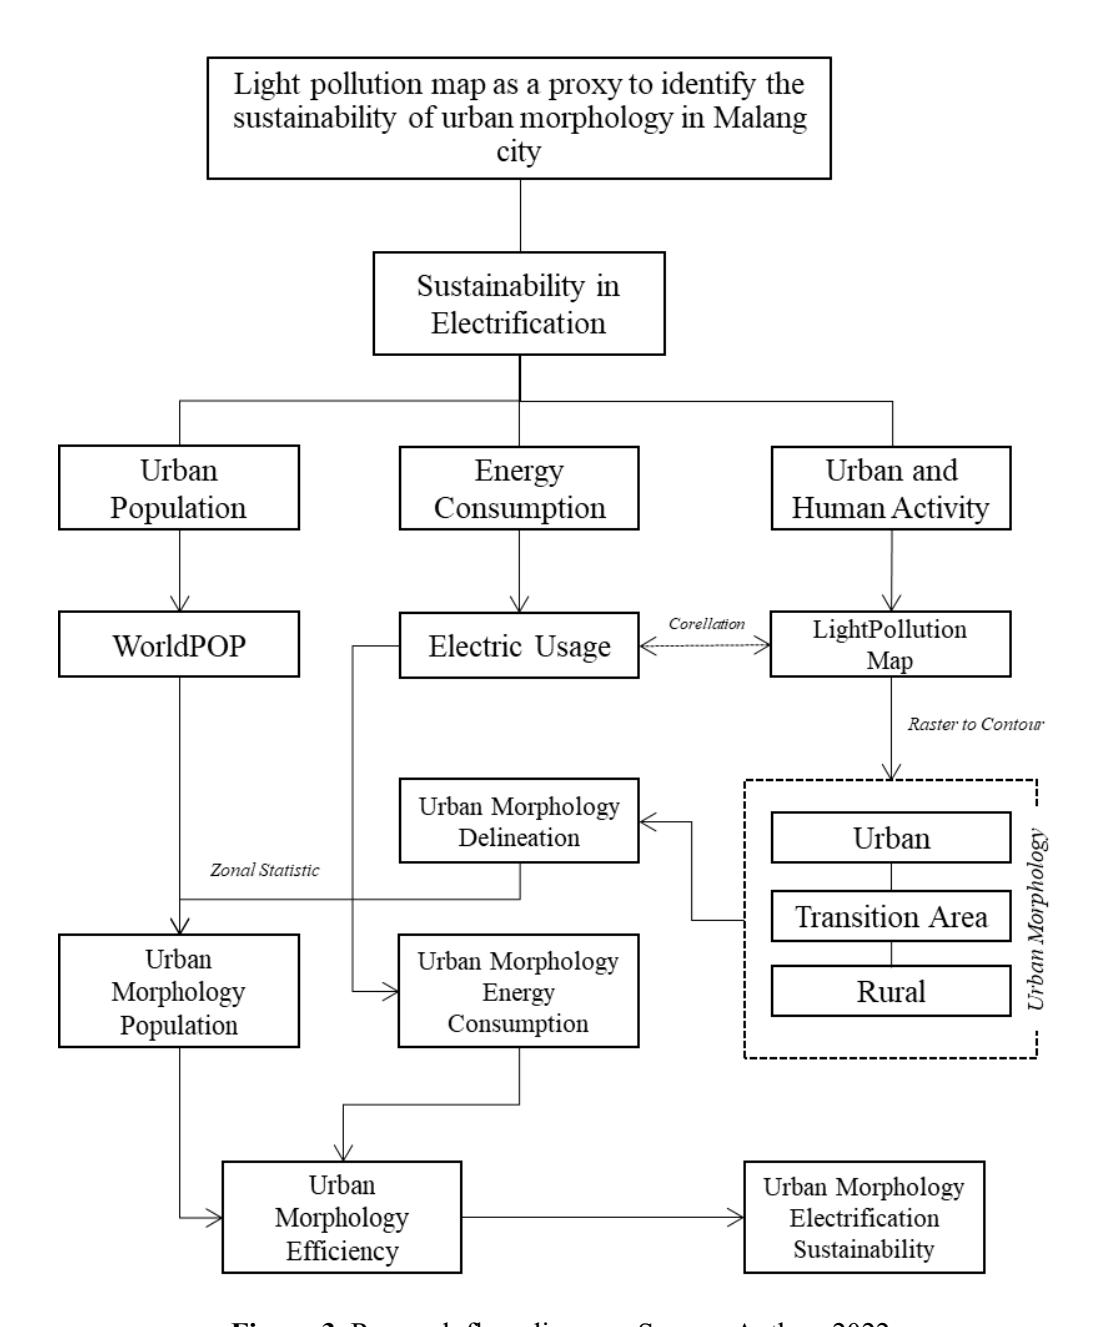
Figure 3. Research flow diagram. Source: Author, 2022
Result and Discussion
Electrification Correlation and Light Pollution Map
As an initial step to assess whether the Light Pollution Map could be used as a proxy for evaluating electrification levels, a correlation process was carried out. The Light Pollution Map obtained was tabulated or zonal statistics based on district boundaries. Table 2 shows that the largest energy consumption from 2018 to 2021 was in Lowokwaru District, amounting to 255,344,374 VA in 2018 and decreasing to 172,887,270 VA in 2021. Interestingly, Klojen District, which is the center of economy, government, history, and culture in Malang City, has the lowest energy consumption among other districts. Another unique finding is that the light intensity on the Light Pollution Map per district, converted into units (watt/cm2.str), has the same low to high-ranking value as the electrification data of Malang City sourced from the
National Statistics Agency website. Table 2 shows a comparison between electrification map data and light pollution data.
Table 2. Malang City electrification by district.
| 2018 | 2021 | |||
|---|---|---|---|---|
| Light Pollution Map (watt/cm2 .str) | Installed Power (VA) | Light Pollution Map (watt/cm2 .str) | Installed Power (VA) | |
| Kedungkandan | 1,243.62 | 200,413,771 | 1,274.13 | 128,545,866 |
| g | ||||
| Sukun | 1,065.53 | 158,401,894 | 1,008.53 | 98,168,492 |
| Klojen | 930.16 | 108,024,738 | 838.78 | 69,309,249 |
| Blimbing | 1,284.66 | 229,396,419 | 1,157.84 | 92,829,453 |
| Lowokwaru | 1,628.78 | 255,344,374 | 1,445.03 | 172,887,270 |
| Malang City | 6,152.75 | 951,581,196 | 5,724.32 | 561,740,330 |
As shown visually in Figure 4, the light intensity on the Light Pollution Map is concentrated in the central (Klojen) and northern (Lowokwaru) regions. Klojen and Lowokwaru are two districts with high strategic importance in Malang City. Klojen is the center of government, economy, history, and culture in Malang, while Lowokwaru is a business and trading area that also has several shopping centers and offices. In addition, both districts are also centers of education in Malang City. Due to their strategic roles, both districts are centers of human activities that are very crowded, especially at night. This is indicated as a factor that causes the high intensity of light or light pollution in Klojen and Lowokwaru districts.
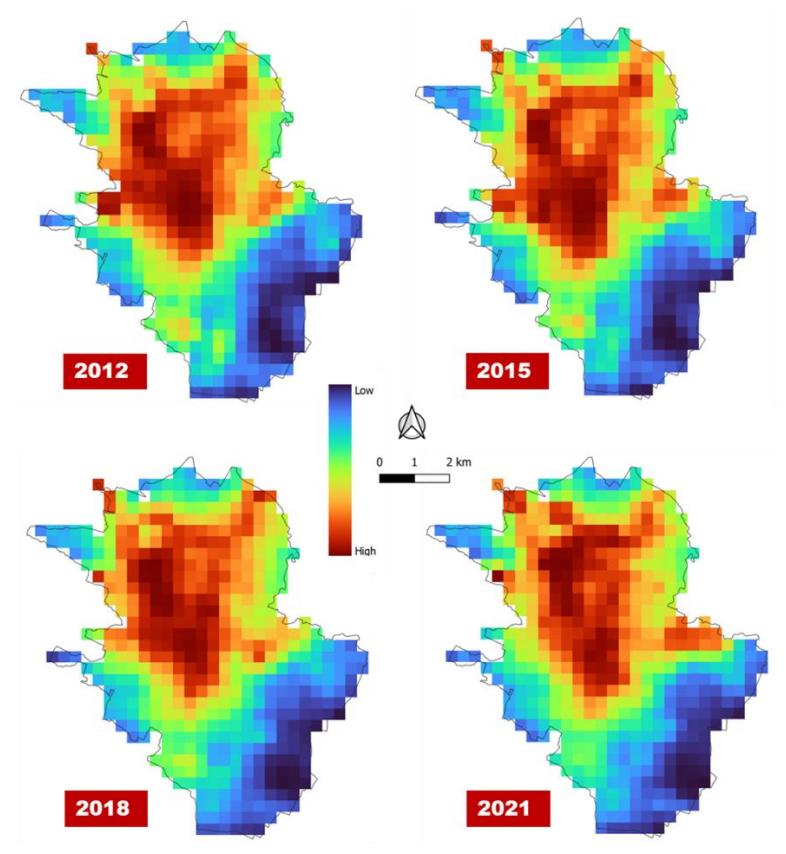
Figure 4. Light Pollution Map. Source. Author, 2022
Based on the correlation results between the light intensity from the Light Pollution Map and electrification (Table 3), it can be seen that these two variables have a positive correlation
relationship. This means that if the value of light intensity increases, the value of electrification will also increase (or vice versa). Moreover, both variables have a very strong correlation value. In 2018, the correlation coefficient value was 0.94, while in 2021 it was 0.95. These correlation results showed that the light intensity value from the Light Pollution Map could be used as an indicator for calculating electrification. Ultimately, the researchers could calculate electrification in Malang city at the level of its urban morphology using the Light Pollution Map data.
Table 3. Correlation of Light Pollution Map and electrification.
| 2018 | ||
|---|---|---|
| Light | Installed Power | |
| Pollution Map | (VA) | |
| Light Pollution Map | 1 | |
| Installed Power (VA) | 0.94 | 1 |
| 2021 | ||
| Light | Installed Power | |
| Pollution Map | (VA) | |
| Light Pollution Map | 1 | |
| Installed Power (VA) | 0,95 | 1 |
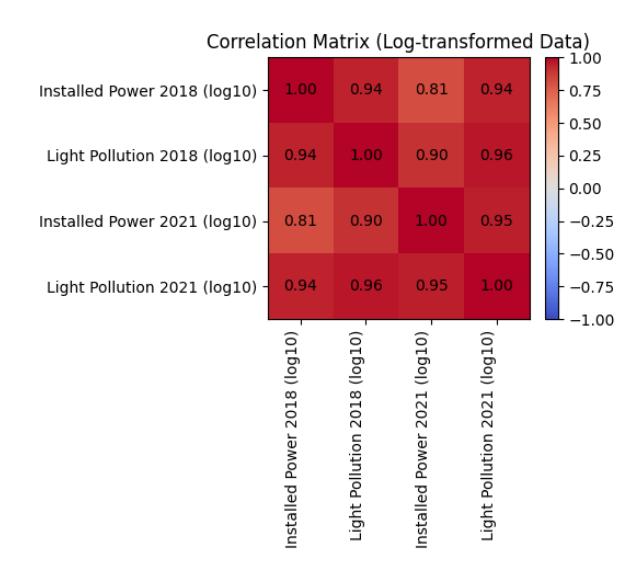
Year 2018:
Correlation Coefficient (r): ~0.94
P-value: ~0.016
Year 2021:
Correlation Coefficient (r): ~0.95
P-value: ~0.012
Electrification Rate based on Morphology The morphology hierarchy of an urban area
refers to the spatial structure of a city or urban region, which can be classified into several levels or zones based on physical and socio-economic characteristics. Each zone or region has differences in terms of function, population density, economic activity, availability of public facilities, and types of social and cultural activities. In this study, the morphology hierarchy division of Malang City was based on the intensity of night lights, and areas in Malang were grouped based on the level of light intensity measured on the Light Pollution Map.
The morphology hierarchy was classified into six categories, i.e., (1) City Center; (2) Inner Urban; (3) Suburban; (4) Urban Fringe; (5) Urban Periphery; and (6) Rural Hinterland. The classification of urban morphology into six hierarchical levels in this study was based on the framework proposed by Pryor (1968), as described in the literature review section. The city center is the center of the city or Central Business District (CBD), which usually has dense activities related to government, business, trade, tourism, and culture. Public facilities and transportation are generally complete and adequate in this area. The Inner Urban zone, which borders directly on the CBD, is an area with high population density, diverse economic activities, and high social and cultural diversity. Suburban areas are considered to be outside the inner urban area, with lower population densities, and are generally used as residences for middle to upper-income residents. The most unique area is the Urban Fringe, which is located between suburban and urban periphery areas, usually around the city but still has many empty lands and unregulated land use. In addition, the Urban Periphery area is located outside the city, with a lower population density, fewer economic activities, and generally used as a more remote and isolated residential area. Finally, the Rural Hinterland area has very low population densities and still has agricultural activities.
These differences affect the intensity of night lights in each zone or area in the urban morphology hierarchy. For example, there is a well-known stigma that city centers will have high night light intensity due to the dense business and night-time activities, while rural hinterlands will have low night light intensity due to the low population density and fewer economic activities. In terms of the morphology area classification in Malang City (Table 4), the rural hinterland area has the highest area at 37.77 percent between 2012 and 2022, followed by urban fringe 21.26 percent, urban periphery 17.81 percent, suburban 13.97 percent, urban inner 5.95 percent, and city center lows 3.23 percent.
Table 4. Area based on morphology (ha).
| Year | Rural | Urban | Urban | Sub | Inner | City |
|---|---|---|---|---|---|---|
| Hinterland | Periphery | Fringe | Urban | Urban | Center | |
| 2012 | 3,272.84 | 1,565.30 | 2,214.92 | 2,256.63 | 1,355.06 | 330.19 |
| 2013 | 6,056.83 | 2,595.48 | 1,358.55 | 658.39 | 252.18 | 73.51 |
| 2014 | 5,019.50 | 2,007.70 | 2,045.97 | 942.18 | 636.96 | 342.63 |
| 2015 | 4,358.53 | 1,523.28 | 1,805.35 | 1,625.65 | 769.48 | 912.65 |
| 2016 | 4,833.93 | 1,876.61 | 2,269.30 | 1,191.01 | 610.36 | 213.73 |
| 2017 | 4,201.38 | 1,495.63 | 1,921.94 | 1,887.39 | 723.32 | 765.26 |
| 2018 | 4,078.24 | 1,647.54 | 2,154.05 | 1,840.09 | 854.42 | 420.60 |
| 2019 | 3,106.34 | 2,279.21 | 3,553.56 | 1,576.24 | 367.99 | 111.59 |
| 2020 | 2,449.33 | 2,637.93 | 3,715.17 | 1,848.36 | 320.57 | 23.57 |
| 2021 | 3,272.84 | 1,565.30 | 2,214.92 | 2,256.63 | 1,355.06 | 330.19 |
| Average | 4,152.99 | 1,958.74 | 2,337.65 | 1,536.22 | 654.48 | 354.86 |
| Percentage | 37.77% | 17.81% | 21.26% | 13.97% | 5.95% | 3.23% |
Figure 5 illustrates the spatio-temporal morphology of Malang City, which shows that the city's morphology tends to be dynamic rather than static. In 2012, the center of Malang City was located in the area around Alun-Alun Kota/Kidul, but in 2015, the central area of the city underwent a significant expansion from Klojen towards Lowokwaru. This was indicated by the intensive development in Lowokwaru, which experienced rapid growth in terms of settlements and businesses. This growth led to an increase in socio-economic activities in the area and ultimately affected the development of the city's core center. The Malang City Government has also paid special attention to the development of Lowokwaru as a strategic area for development. This is evident from the construction of office buildings, hotels, and shopping centers in the area, which further enhance its attractiveness. From 2018 to 2021, there has been a shift in the center of Malang City, with the formation of a polycentric urban pattern, where there are two poles of growth centers. Interestingly, the center of the city in Klojen has undergone a significant reduction in area, while the center of the city in Lowokwaru, particularly around the Soekarno Hatta corridor, has experienced significant expansion. Researchers argue that such a dynamic morphology of the city also indicates that the energy use pattern of a city will change according to the tendency of human activities at a certain time. This is consistent with the theory examined by researchers, where previous studies have stated that population and its activities play a crucial role in driving energy demand in urban areas, which directly affects energy consumption (Akcin et al., 2016; Arbabi & Mayfield, 2016; Osorio et al., 2017).
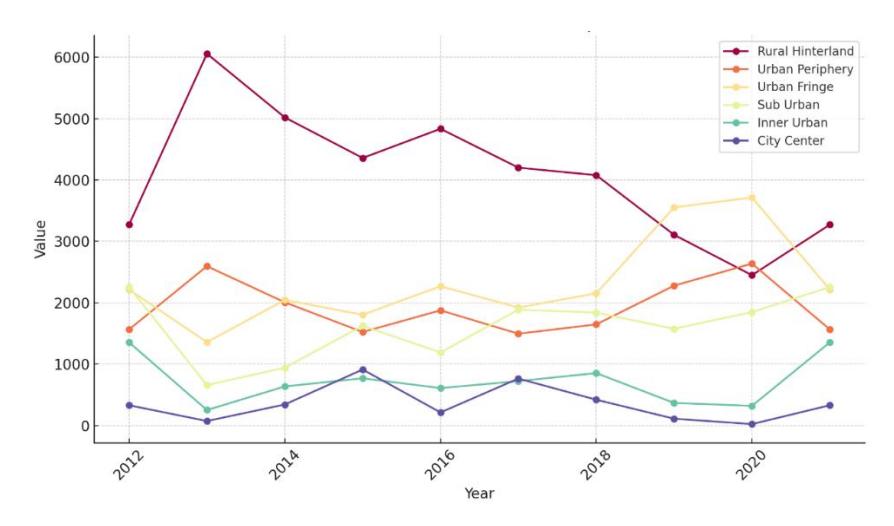
Figure 5. Trends in different urban zones over time (area in ha). Author, 2022
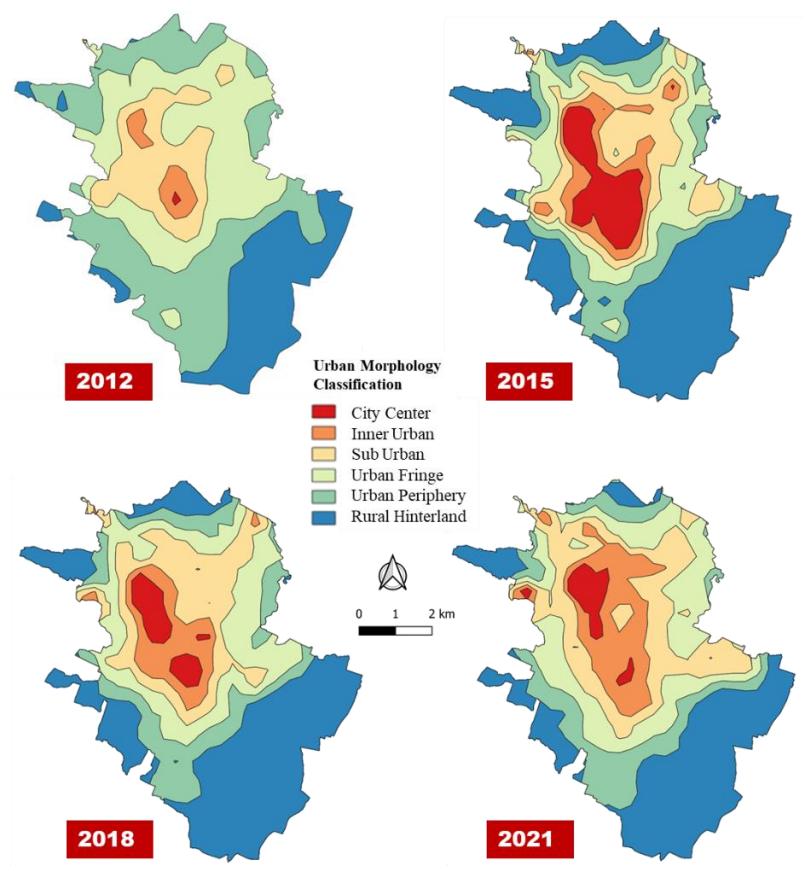
Figure 6. Malang city morphology. Author, 2022
From the population aspect, the resulting morphological map was then processed by zonal statistics in the GIS, so that the total population of each morphological category was obtained. The results of population mapping in the morphological category (Table 5) show that the largest population occupies the Urban Fringe area as much as 28.25 percent and the lowest occupies the City Center area as much as 7.08 percent. The urban fringe in Malang City has a higher population compared to the city center because the urban fringe is a larger area with more land available for housing development. On the other hand, the city center tends to have strict land
use limitations and is usually used for business, trade, or industry purposes. The limited land in the city center can hinder housing development, resulting in a lower population compared to the urban fringe. Additionally, the urban fringe tends to be more affordable compared to the city center, which can attract residents to live there. These factors combined explain why the urban fringe in Malang City has a higher population than the city center.
Table 5. Total population based on morphology (person).
| Year | Rural | Urban | Urban | Sub | Inner | City |
|---|---|---|---|---|---|---|
| Hinterland | Periphery | Fringe | Urban | Urban | Center | |
| 2012 | 95,752 | 84,952 | 207,497 | 288,563 | 199,435 | 53,796 |
| 2013 | 282,041 | 332,402 | 170,570 | 111,766 | 26,333 | 12,145 |
| 2014 | 208,856 | 203,833 | 255,091 | 117,808 | 95,858 | 70,311 |
| 2015 | 166,958 | 130,155 | 198,622 | 198,057 | 98,126 | 167,322 |
| 2016 | 211,164 | 186,416 | 287,023 | 132,661 | 96,942 | 55,156 |
| 2017 | 174,153 | 99,583 | 238,991 | 186,465 | 121,924 | 156,558 |
| 2018 | 159,830 | 138,944 | 257,471 | 199,683 | 155,389 | 69,618 |
| 2019 | 112,746 | 152,974 | 398,804 | 262,652 | 39,962 | 27,633 |
| 2020 | 52,150 | 187,295 | 445,661 | 262,644 | 56,524 | 3,673 |
| 2021 | 116,120 | 97,936 | 229,978 | 305,931 | 206,668 | 56,065 |
| Average | 162,628 | 168,506 | 273,303 | 195,589 | 98,944 | 68,468 |
| Percentage | 16.81% | 17.42% | 28.25% | 20.22% | 10.23% | 7.08% |
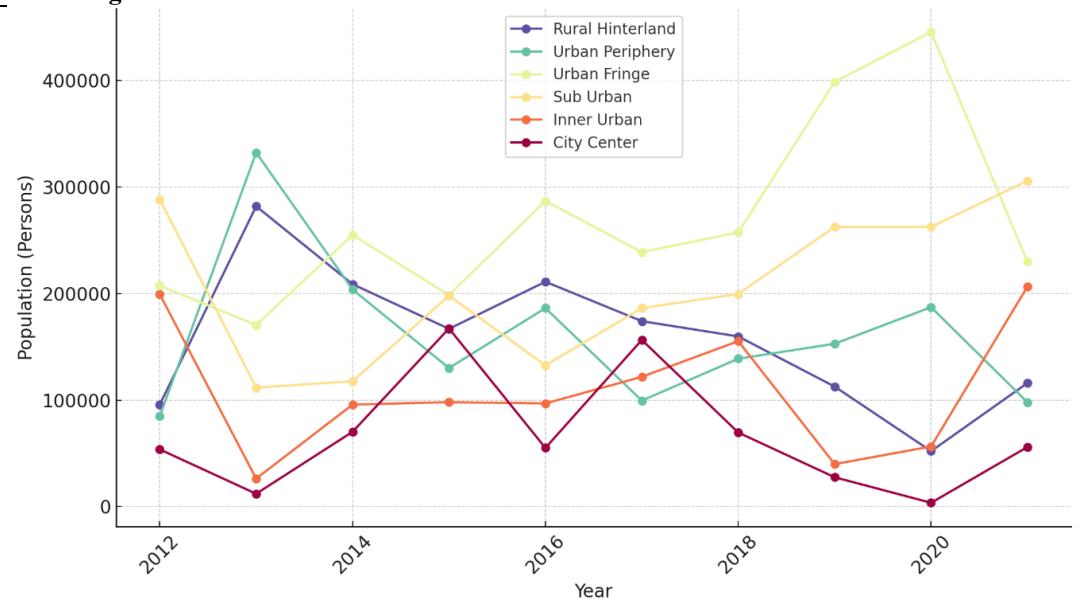
Figure 7. Population trends in different urban zones over time. Author, 2022
The energy consumption rate at each morphology level can be seen in Table 6. The highest average energy consumption during the period from 2012 to 2021 was in the suburban areas, while the lowest was in the city center. This is due to the fact that, as previously explained, the suburban areas have the largest area and population. In addition, urban fringe tends to have more and larger houses and buildings than the city center, resulting in a greater need for electricity. Because of the more affordable land prices, the urban fringe of Kota Malang also becomes the residence of people with lower incomes. As a result, their ability to access energyefficient technologies such as solar panels or heat pumps is also lower. Researchers also argue that the city center has a lower energy consumption rate due to building factors. If the area is dominated by buildings designed efficiently and equipped with energy-saving technologies such as the use of LED lights and other energy-efficient equipment, then its energy consumption can also be lower.
Table 6. Electrification rate based on morphology (watt/Cm2.str).
| Rural | Urban | Urban | Sub | Inner | City | |
|---|---|---|---|---|---|---|
| Year | Hinterland | Periphery | Fringe | Urban | Urban | Center |
| 2012 | 395.53 | 373.90 | 997.03 | 1.101.75 | 969.25 | 350.75 |
| 2013 | 1.138.89 | 1131.00 | 848.17 | 400.36 | 203.96 | 126.47 |
| 2014 | 939.42 | 941.27 | 1083.64 | 711.63 | 609.69 | 379.01 |
| 2015 | 851.49 | 703.02 | 1013.29 | 1146.15 | 626.45 | 1084.80 |
| 2016 | 956.94 | 872.24 | 1210.99 | 928.89 | 501.30 | 261.01 |
| 2017 | 874.39 | 645.95 | 1147.89 | 1328.35 | 590.81 | 841.95 |
| 2018 | 873.13 | 741.15 | 1209.69 | 1274.17 | 806.74 | 473.76 |
| 2019 | 672.44 | 948.95 | 2488.42 | 1507.80 | 433.11 | 193.57 |
| 2020 | 438.74 | 1022.37 | 2438.72 | 1426.12 | 431.62 | 32.30 |
| 2021 | 802.23 | 615.03 | 1418.61 | 1509.70 | 1160.13 | 423.02 |
| Average | 794.32 | 799.49 | 1.385.65 | 1.133.49 | 633.31 | 416.67 |
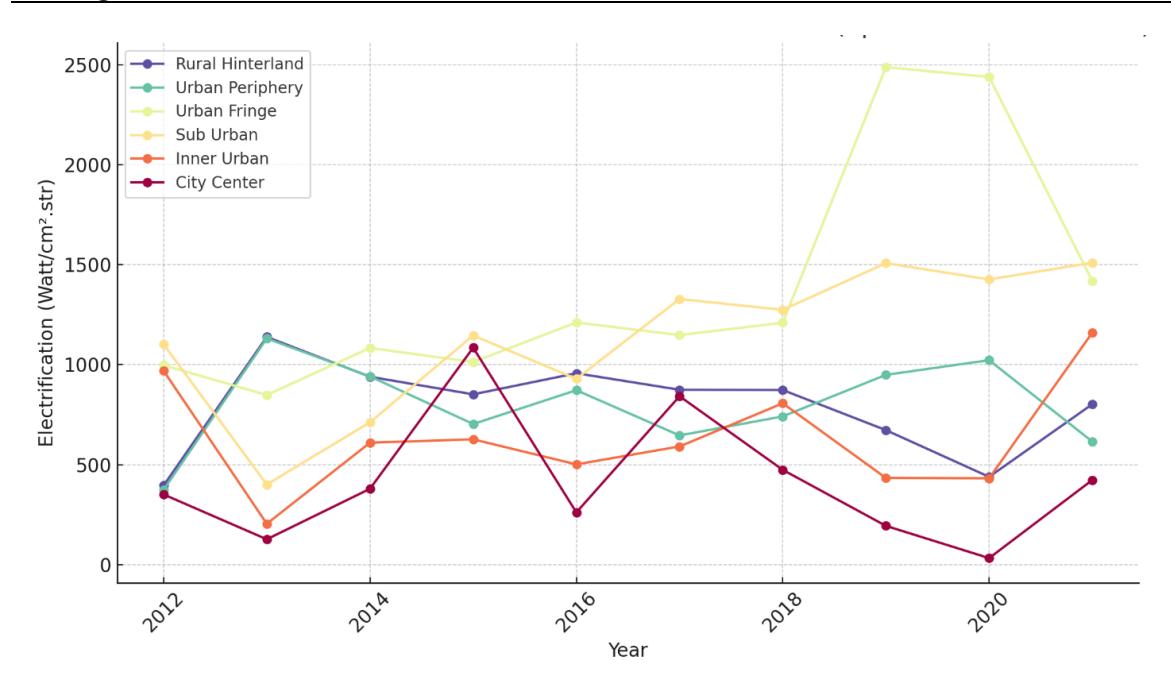
Figure 8. Electrification trends in different urban zones over time. Author, 2022
On the basis of the average pixel value of light intensity in the Light Pollution Map (Table 7), it is known that the areas of the City Center have the highest average light intensity, while the areas of the Rural Hinterland have the lowest average light intensity. This study also showed that the City Center is the hub of human activity, while the intensity of human activity is significantly lower in Rural Hinterland areas. According to the Light Pollution Map, there is a positive association between the average nighttime light intensity and the intensity of human activity. This correlation was shown to be positive. Human activities, such as the use of streetlights, building lights, and vehicle lights, have an effect on the intensity of the light that is present throughout the nighttime hours. Areas that are far from human activity centers and urban areas, such as rural hinterland areas, have lower light intensity at night due to the minimal use of lights. On the other hand, areas that have a high human activity intensity, such as the city center, industrial areas, and shopping areas, typically have a high light intensity at night. Additionally, this is due to the fact that domestic activities are typically the primary focus in rural hinterland communities. As a result, the likelihood that the nighttime light intensity on the Light Pollution Map in a particular location will likewise be higher is proportional to the level of human activity that is present in that area.
Table 7. Average light intensity based on morphology (watt/Cm2.str).
| Year | Rural Hinterland | Urban Periphery | Urban Fringe | Sub Urban | Inner Urban | City Center |
|---|---|---|---|---|---|---|
| 2012 | 2.59 | 5.75 | 8.82 | 11.24 | 15.14 | 18.46 |
| 2013 | 4.07 | 9.42 | 12.29 | 15.40 | 18.54 | 21.08 |
| 2014 | 4.07 | 9.60 | 12.46 | 15.14 | 18.48 | 23.69 |
| 2015 | 4.19 | 9.63 | 12.51 | 15.28 | 18.42 | 23.58 |
| 2016 | 4.27 | 9.69 | 12.36 | 15.23 | 18.57 | 21.75 |
| 2017 | 4.37 | 9.79 | 12.61 | 15.45 | 18.46 | 22.76 |
| 2018 | 4.37 | 9.79 | 12.61 | 15.45 | 18.46 | 22.76 |
| 2019 | 4.54 | 9.49 | 14.99 | 20.10 | 25.48 | 32.26 |
| 2020 | 3.92 | 8.31 | 13.70 | 18.05 | 22.72 | 29.12 |
| 2021 | 5.24 | 9.46 | 12.55 | 15.41 | 18.13 | 22.26 |
| Average | 4.16 | 9.09 | 12.49 | 15.67 | 19.24 | 23.77 |
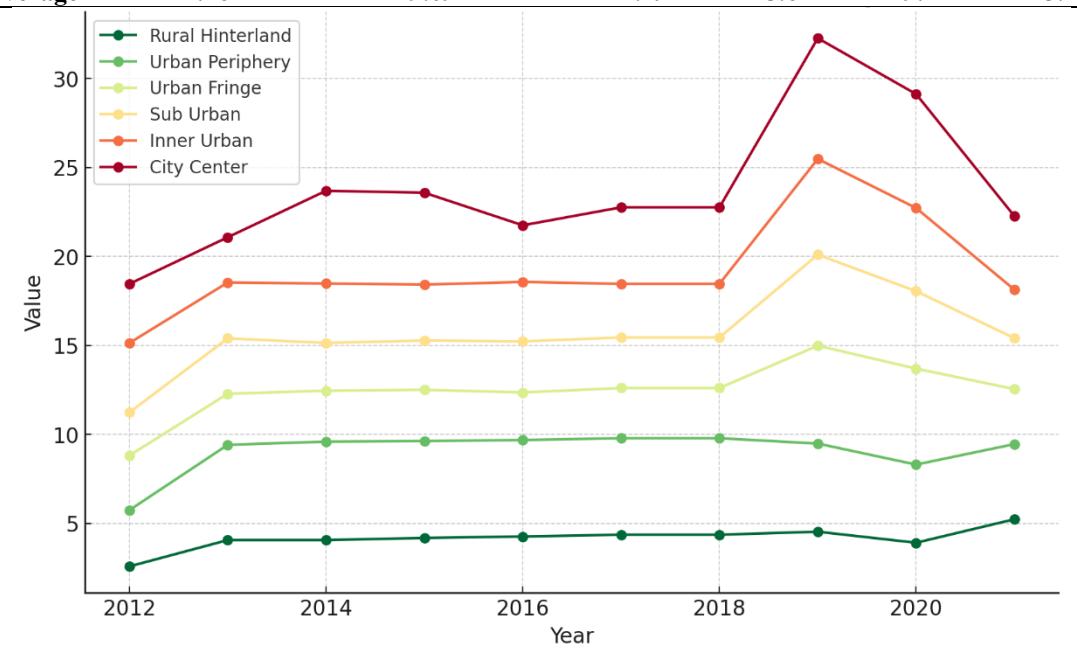
Figure 9. Average light intensity trends in different urban zones over time. Author, 2022 Electrification Efficiency Overview
Electrification efficiency is determined by evaluating the relationship between electrification levels (watt/cm².str) and population, land area, and nighttime light intensity (NTL) at each morphological level. It is calculated as the inverse of energy inefficiency, where higher efficiency values indicate better energy utilization relative to spatial and demographic factors. This approach ensures that energy distribution is assessed not only based on total consumption but also in relation to the extent of urbanization, land coverage, and intensity of night-time activities. A higher electrification efficiency value indicates better energy utilization, meaning electricity is more effectively distributed relative to population density and urban form. The results (Table 8 and Figure 6) show that the City Center category has the highest electrification efficiency, at 59.96%, suggesting that this area benefits from the most optimized use of electricity relative to its population and urban density. In contrast, the Urban Fringe category exhibits the lowest efficiency, at 4.30%, indicating that electrification in this area is not as effectively utilized. This may be due to a mismatch between infrastructure availability and actual energy use. Interestingly, the Inner Urban (14.59%) and Sub Urban (5.64%) categories demonstrate intermediate efficiency levels, showing that their electricity usage is relatively balanced but still has room for optimization. Meanwhile, the Rural Hinterland (8.24%) and Urban Periphery (7.28%) categories display lower efficiency compared to the City Center category, implying that electrification in these areas is not predominantly used for direct population activities but may serve non-residential functions, such as extended street lighting or infrastructure maintenance. These findings highlight the importance of targeted energy management strategies, ensuring that electricity distribution aligns with actual consumption patterns. Future research should explore how infrastructure planning and smart grid implementation can enhance efficiency across different urban morphologies to create a more sustainable energy distribution system.
Table 8. Electrification efficiency.
| Rural | Urban | Urban | Sub | Inner | City | |
|---|---|---|---|---|---|---|
| Year | Hinterland | Periphery | Fringe | Urban | Urban | Center |
| 2012 | 4.87E+08 | 4.89E+08 | 2.46E+09 | 1.51E+09 | 2.37E+09 | 1.07E+09 |
| 2013 | 1.64E+09 | 1.39E+09 | 2.98E+09 | 3.53E+09 | 1.66E+10 | 6.72E+09 |
| 2014 | 2.20E+08 | 2.40E+08 | 1.67E+09 | 4.23E+08 | 5.40E+08 | 6.64E+08 |
| 2015 | 2.79E+08 | 3.68E+09 | 2.26E+09 | 2.33E+09 | 4.50E+09 | 3.01E+08 |
| 2016 | 2.20E+07 | 2.57E+08 | 1.50E+08 | 3.86E+09 | 4.56E+09 | 1.02E+10 |
| 2017 | 2.73E+09 | 4.43E+08 | 1.98E+09 | 2.44E+09 | 3.63E+08 | 3.09E+08 |
| 2018 | 3.07E+09 | 3.31E+08 | 1.73E+08 | 2.24E+09 | 3.29E+09 | 7.11E+08 |
| 2019 | 4.23E+08 | 2.87E+08 | 1.17E+09 | 1.81E+09 | 1.16E+10 | 1.95E+09 |
| 2020 | 8.76E+08 | 2.49E+08 | 1.08E+09 | 1.63E+08 | 1.05E+10 | 1.28E+11 |
| 2021 | 4.03E+09 | 4.24E+09 | 2.22E+09 | 1.42E+08 | 2.28E+09 | 1.03E+10 |
| Average | 3.65E+08 | 3.23E+09 | 1.90E+09 | 2.50E+08 | 6.47E+08 | 2.66E+09 |
| Percentag | 8.24% | 7.28% | 4.30% | 5.64% | 14.59% | 59.96% |
| e |
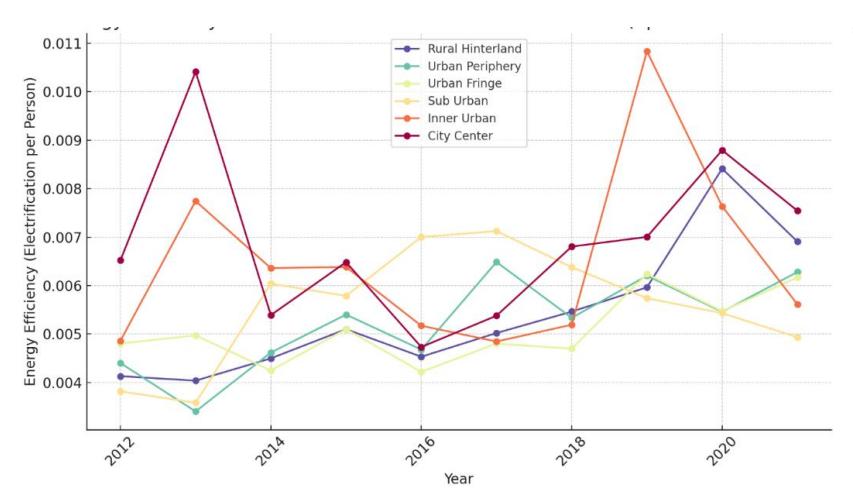
Figure 10. Energy inefficiency trends. Author, 2022
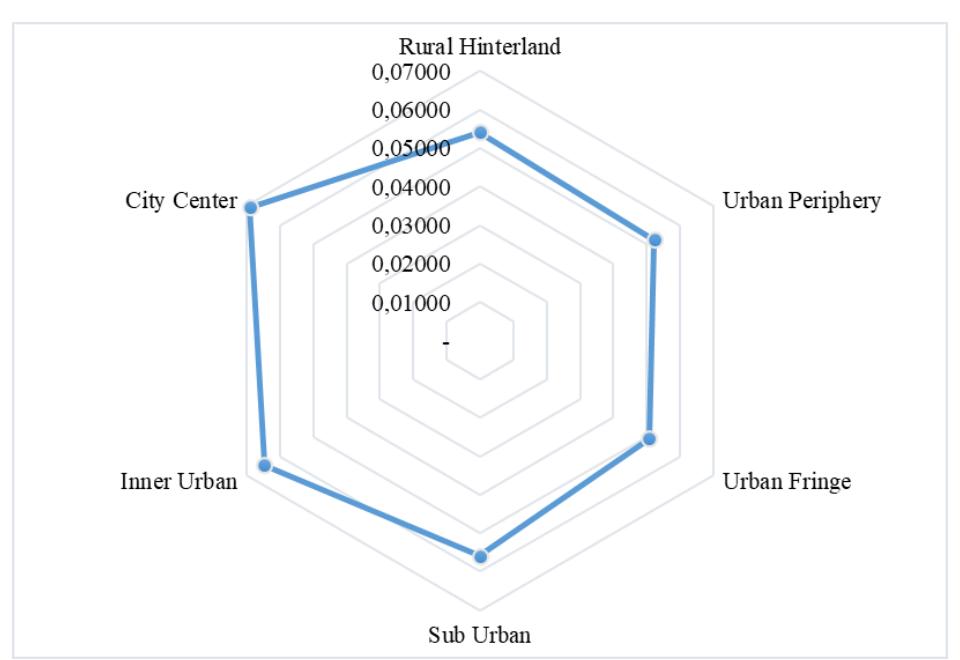
Figure 11. Energy use efficiency at the morphological level of Malang City. Author, 2022 Discussion
Energy Efficiency and its Relationship with Energy Inefficiency
This study assessed energy efficiency by analyzing the relationship between electrification levels, indicated by nighttime light intensity (NTL), and factors such as population density and land area across different urban forms. An elevated value in this assessment signifies increased energy consumption, which may indicate inefficiencies in energy utilization. This is consistent with the theory proposed by previous researchers, indicating that energy efficiency is a measure of how effectively energy is utilized to achieve desired results (Lin & Zhai, 2023; Osorio et al., 2017). Excessive energy consumption relative to actual needs may signal inefficient electrification. When electrification efficiency is assessed – by relating electrification levels (watt/cm².str) to population density, land area, and nighttime light intensity – it becomes evident that high consumption does not automatically translate to optimal energy use. In fact, regions such as the Rural Hinterland, despite their lower overall energy demand, exhibit lower electrification efficiency compared to densely populated areas like the City Center and Inner Urban zones. This suggests that in less urbanized regions, electricity is more likely allocated to non-residential functions, underscoring that effective energy utilization depends on aligning infrastructure with the specific spatial and demographic characteristics of each area.
Urban Morphology and Its Impact on Energy Efficiency
Pryor classified urban morphology into six distinct levels: City Center, Inner Urban, Sub Urban, Urban Fringe, Urban Periphery, and Rural Hinterland (Pryor, 1968). The classifications illustrate distinct urban structures, each impacting energy consumption patterns in unique ways. The results of the present study indicate that City Center and Inner Urban areas demonstrate notably greater energy consumption compared to other zones; however, this does not consistently align with increased efficiency. This indicates that high-density urbanization does not necessarily lead to energy inefficiency caused by the excessive use of commercial, industrial, and public lighting practices that are not consistently optimized.
Prior investigations have examined the connection between urban morphology and energy efficiency (Juan et al., 2021; Lan et al., 2022; Loeffler et al., 2021; Tsirigoti & Bikas, 2017;
Wang et al., 2021; Xie et al., 2023). The present study underscores the distinctions in terminology and the scope of research when compared to earlier works. Loeffler et al., characterized urban morphology as the physical structure and arrangement of cities, encompassing building proportions, spacing, and solar exposure, all of which affect energy performance in buildings (Loeffler et al., 2021). This viewpoint contrasts with the methodology employed in this study, which regards urban morphology as the overarching spatial framework that includes various hierarchical zones both within and surrounding urban environments.
In terms of research scale, numerous previous studies have concentrated on single buildings, specific blocks, or small urban neighborhoods – approaches that may limit their applicability to broader urban or administrative areas. In contrast, this study employed an NTL-based spatial analysis to comprehensively assess the influence of urban morphology on energy consumption across an entire city. Electrification efficiency is determined by evaluating the relationship between electrification levels (watt/cm².str) and key parameters, including population, land area, and nighttime light intensity. Our findings reveal that the City Center exhibits the highest electrification efficiency at 59.96%, reflecting an optimal alignment between infrastructure provision and high population density. Conversely, the Urban Fringe shows the lowest efficiency at 4.30%, indicating a significant mismatch between available infrastructure and actual energy use. Intermediate efficiency values are recorded in the Inner Urban (14.59%) and Sub Urban (5.64%) zones, while the Rural Hinterland (8.24%) and Urban Periphery (7.28%) also demonstrate lower efficiencies – suggesting that in these areas, electrification is more likely allocated to non-residential functions. These results underscore the importance of tailoring energy management strategies to the specific spatial and demographic contexts of each urban morphology, thereby enhancing overall energy distribution and minimizing waste.
Policy and Urban Planning Implications
This study's findings on electrification efficiency – evaluated through the relationship between electrification levels (watt/cm².str), population density, land area, and nighttime light intensity –lead to several policy recommendations for optimizing energy distribution in urban settings:
- Data-Informed Urban Planning. Planners should integrate electrification efficiency analyses into spatial planning to ensure that infrastructure investments align with actual consumption patterns. For example, the high efficiency in the City Center (59.96%) contrasts sharply with the low efficiency in the Urban Fringe (4.30%), highlighting the need for tailored approaches across different zones.
- Targeted Deployment of Energy-Saving Technologies. In areas where inefficiencies are pronounced – especially where electrification is primarily allocated to nonresidential functions (as seen in parts of the Urban Fringe, Rural Hinterland at 8.24%, and Urban Periphery at 7.28%) – the adoption of LED lighting, smart sensors, and adaptive lighting systems can help reduce energy waste.
- Enhanced Renewable Energy Integration. Increasing the share of renewable energy in zones with lower efficiency values can reduce fossil fuel dependency and support a more sustainable energy system, ensuring that energy production better matches localized demand.
- Balanced Infrastructure Development. The expansion of electricity grids must be calibrated to local population trends and urban forms. In intermediate zones like Inner Urban (14.59%) and Sub Urban (5.64%), as well as in peripheral areas, infrastructure
development should be optimized to meet consumption needs without oversupplying energy.
These recommendations underscore the significance of utilizing data-driven methodologies – such as the integration of NTL, population distribution, and urban morphology analysis – to develop effective strategies that optimize energy use, minimize waste, and promote sustainable urban development.
Conclusion
It takes more than simply quantitative research to comprehend energy inefficiency in urban settings; it also necessitates taking a look at the interactions between electrification, infrastructure, and people in various spatial locations. This research looked into the role of spatial analysis in addressing this issue, particularly by utilizing night-time light imagery (NTL). By integrating NTL data with population distribution and land area statistics, researchers can acquire more profound comprehension of the relationship between electrification, energy use, and efficiency.
One important conclusion drawn from this investigation is that energy consumption is noticeably higher in high-density urban regions, such as inner urban zones and city centers. Nevertheless, more utilization does not always translate into greater efficiency; in many instances, these areas waste a significant amount of energy. On the other hand, electrification and energy use tend to be more proportionate in suburban and outlying areas, indicating a rather balanced consumption pattern.
Night-time light data offers a useful means of assessing electrification patterns across different regions. Areas with minimal or no night-time illumination often indicate restricted access to electricity, making this a necessary tool for both policymakers and researchers. Stakeholders may track the development of electrification projects, pinpoint infrastructure gaps, and improve resource allocation plans by utilizing NTL data. Additionally, the brightness of nighttime lighting can be used as a general measure of electrification, allowing for cross-regional comparisons and assessments of energy availability over time.
Nevertheless, while NTL data offers important realizations, it is not without limitations. Artificial night-time illumination may be impacted by a number of such as economic activity, cultural practices, and population density, all of which can distort its reliability as a direct measure of electrification. Therefore, a more all-encompassing strategy should integrate additional data sources, including electricity consumption records, infrastructure assessments, and ground surveys, to attain a more precise and comprehensive comprehension of urban energy dynamics.
From a policy perspective, these findings stress the significance of targeted energy strategies that give priority to sustainable urban planning, energy-efficient infrastructure, and equitable electrification efforts. Cities may increase energy efficiency, reduce waste, and guarantee a more equitable distribution of energy resources by integrating geographical data analysis into decision-making procedures. In the future, developing energy-resilient and sustainable urban environments will require a multifaceted strategy that incorporates geospatial analytics, realtime energy monitoring, and socioeconomic factors.