
Introduction
Beaches are priceless natural resources that generate various benefits related to cultural values, such as the opportunity for undertaking recreational, tourism, and leisure activities, as well as the appreciation of the aesthetics, amenities, and unique features of landscapes (Pascoe, 2019). Sand, sun, and sea (the three S's) are also known as the major determinants regarded by tourists, with a pristine blue sea, white sandy beaches, and ample sunlight contributing to the attraction of the beach (Mestanza-Ramón et al., 2020). Peninsular Malaysia and Labuan Federal Territory have a coastline stretching 3,853 km; out of this, only 440.80 km are covered by sandy beaches. The state of Terengganu, which faces the South China Sea, has the longest coastline in Peninsular Malaysia, at 244 km. Nevertheless, in recent decades, the beaches of Terengganu, have become increasingly vulnerable to erosion, accretion, and the effects of sea level rise, as reported in Bagheri et al., 2022a and Lin et al., 2022. These studies have discovered that the main factors influencing this natural occurrence are closely connected to both natural processes and human activities. Occurrences such as monsoonal storms, powerful winds, waves, and currents have resulted in notable erosion and harm to the embankment road, nearby infrastructure like buildings, hotels, and chalets, as well as causing trees to fall along the coast. Additionally, human-made constructions, such as coastal defense structures, also play a significant role in exacerbating erosion. The expansion of Sultan Mahmud International Airport and the implementation of various coastal protection measures along this shoreline were among the factors that contributed to the erosion and accretion observed in Kuala Terengganu (Ariffin et al., 2019; Nor et al., 2020).
Bagheri et al. (2022a) reported that in the Seberang Takir Beach area and its vicinity, a substantial average erosion rate is anticipated, ranging approximately from 1.83 to 3.20 meters per year, with the highest erosion rates ranging from 6.59 to 11.53 meters per year. The transport rate of sand falls within the range of 9,622.82 to 10,489.07 cubic meters per year. Concurrently, the recorded sea level rise is documented at 25.3 mm per year, with fluctuations ranging from a minimum of 1.10 mm to a maximum of 79.26 mm per year. It is noteworthy that although most coastal defense structures, such as seawalls, ripraps, breakwaters, and groynes, aim to mitigate erosion, they can inadvertently accelerate it in many instances (Eli et al., 2016). Rising sea levels and coastal erosion can have significant negative physical and economic effects on the local economy and tourism industry. This covers possible effects on roads, hotels, resorts, chalets, commercial buildings, private properties, and other tourism assets owned by locals in addition to public infrastructure (Bagheri et al., 2023).
Furthermore, beaches in Malaysia are under threat from pollution due to the accelerated growth in tourism industries, marine debris, population expansion, and ineffective waste management (Nur Nashrah et al., 2023; Shahul et al., 2021; Khairunnisa et al., 2012; Ngah et al., 2012). Since beaches are open spaces available to uncontrolled visitors and tourists, overcrowding on the beaches and inappropriate use of recreational beach amenities continue to be serious issues. There are instances when the capacity of beach facilities is insufficient to accommodate the visitors. Responsible parties must design effective management strategies to remedy this situation. It is common practice for state and local governments to provide management with funds for the upkeep and improvement of public facilities. Budgets, however, are frequently too small to cover the expenses of maintenance and improvements. Therefore, other strategies for generating money for the upkeep and enhancement of public infrastructure have to be considered.
Due to the high cost of maintaining beach water quality and shoreline cleanliness, it is deemed appropriate to implement local fees for public areas to postpone the escalation of maintenance expenses and provide superior tourist amenities. Furthermore, it is imperative to increase awareness among beachgoers regarding the shared responsibility for maintaining these public spaces. Beach management must also determine which amenities, in the eyes of the public, need to be improved. The decisions and preferences of guests provide essential information about the value of certain facilities in terms of improving the effectiveness of budgetary allocations. Future needs for public facilities cannot be fully satisfied without a thorough grasp of the expectations and preferences of the users (Vaz et al., 2009).
Few research has focused on the economic valuation of recreational beaches from the perspective of tourists. Noteworthy examples include studies conducted by Ahmad and Hanley (2009), Muhammad et al. (2012), Mamat et al. (2013), and Kamaludin et al. (2021). Ahmad and
Hanley (2009) conducted a study to estimate visitors' willingness to pay (WTP) for conservation initiatives in Marine Park Areas (MPA) across Terengganu (Redang Island), Kedah (Payar Island), and Pahang (Tioman Island) using the Contingent Valuation Method (CVM). This research aimed to protect marine ecosystems, encompassing coral reefs, sea grass beds, and mangroves, from the detrimental effects of overwhelming tourism activity. In contrast, Mohamad et al. (2012) conducted a study employing the Travel Cost Method, a nonmarket revealed preference technique, to assess the economic value of Redang Island, uncovering a notable annual total benefit of USD 57.89 million (RM 177.24 million).
The study by Mamat et al. (2013), using CVM, indicates the threat posed by human encroachment to protected areas like marine parks and wildlife reserves, emphasizing the need for informed conservation strategies, exemplified by findings from Pulau Redang Marine Park, where recreationists' WTP ranged from RM 10.86 to RM 28.69, potentially contributing RM 1.65 million to RM 4.36 million annually in 2008. The study by Kamaludin et al. (2021) in Perhentian Island, Terengganu, also using CVM, demonstrated the economic value of coral reef conservation and identifies factors influencing visitors' WTP, revealing a substantial contribution of approximately RM 4.823 million towards conservation programs.
Previous research on recreational beaches in Terengganu has predominantly focused on wellknown islands such as Redang and Perhentian, with limited attention given to mainland beaches. While most studies have employed stated preference methods, none have utilized the choice experiment (CE) approach. Compared to the contingent valuation method (CVM), CE offers several advantages, including the presentation of realistic decision contexts, the ability to capture preferences for multiple attributes, and the potential to mitigate hypothetical bias. Additionally, CE allows for a flexible experimental design and provides deeper insight into attribute trade-offs, enabling a more comprehensive understanding of preferences (Hensher, Rose & Greene, 2005). The CE method has been widely applied in various environmental and tourism-related studies, offering valuable insight into individuals' preferences for natural resources, recreational amenities, and conservation initiatives (Hanley et al., 2001; Hynes et al., 2013). CE enables researchers to assess preferences for various attributes concurrently by prompting respondents to select among alternatives with diverse attribute levels, providing deeper insight into the factors influencing their decision-making processes and facilitating the identification of relative attribute importance and trade-offs among environmental goods.
In 2024, Terengganu recorded 7.8 million tourist arrivals, significantly exceeding its initial target of 4.5 million visitors (Bernama, 2024). This tourism boom has led to marginalization of coastal communities, competition for resources, rising costs, traffic congestion, pollution, overcrowding, and overtourism. These issues decrease the local population's quality of life and tourists' ability to enjoy their vacations. When considering Miami Beach, its high volume of visitors, including beachgoers and picnickers, can lead to congestion, overcrowding, and occasionally beach pollution (Bernama, 2025a). Second, the seaside streets struggle with beach erosion (Ariffin et al., 2020), particularly during monsoon and high tide (Rohayu Haron Narashid et al., 2021). Sometimes, some roads are temporarily closed due to wave overflow and washed-up rubbish to ensure user safety (Bernama, 2025b). Third, rusty and yellowing signboards along the beach distort the scenery. Consequently, the combined impact of climate change and overcrowding has increased the complexity of finding solutions. Therefore, to gather data, this study surveyed tourists in Miami Beach, Terengganu, using a questionnaire assessing various beach amenities.
This study aimed to investigate tourists' preferences and willingness to pay (WTP) for improvements in the state's recreational beach. Additionally, it sought to identify the most desirable attributes for beach improvement. Miami Beach, Terengganu, was selected as the study area due to its increasing popularity among both domestic and international visitors. Unlike well-researched island destinations such as Redang and Perhentian, Miami Beach represents a mainland beach that has received limited academic attention. The selection of this area allows for an in-depth observation of tourists' preferences for beach improvement in an area experiencing rapid tourism growth. Besides, this area has experienced a notable tourism surge, with over 5.2 million visitor arrivals by June 2024, reflecting a significant increasing trend in demand for coastal mainland beach attractions (Sarawak Tribune, 2024). Tourists are attracted to Terengganu for its pristine beaches, which hold significant economic value. However, this value has not been fully studied. To effectively protect and preserve these recreational beach resources, it is significant to comprehend tourists' attitudes and seek their input. The aesthetic value provided by the beautiful views and scenery is essential for boosting the tourism industry in the state.
Literature review
WTP indicates the valuation of benefits for goods or services in monetary terms (Nababan et al., 2021). The WTP concept is rooted in the economic theory of consumer behavior and denotes the highest possible price at which a person is willing to purchase goods or services (Mariani and Pêgo-Fernandes, 2014). The factors influencing WTP include people's environmental interests, information about goods/services, sociodemographic, and product/service-specific factors. There has been extensive research conducted in various fields, such as environment, marketing, healthcare to examine WTP in both theoretical and empirical contexts (Vicente et al., 2021; Xie et al., 2022; Nguyen et al., 2025). However, studies examining tourists' WTP for beach improvement remain relatively limited in Asia and Malaysia, though recent research has emerged in Indonesia and Thailand. At Baru Beach, Yogyakarta, visitors showed an average WTP of IDR 15,000 for quality enhancements using a contingent valuation method (Setiawan et al., 2022). In Sunrise Land Beach, Lombok, socio-economic factors such as income and education significantly influenced tourists' WTP for improved facilities (Malik et al., 2024). On Libong Island, Thailand, choice experiment results showed that tourists valued marine litter reduction and lower crowding more than beach size (Panwanitdumrong et al., 2022). Tourist heterogeneity plays a significant role in choice experiments, as preferences for beach improvement can vary widely based on demographics, cultural backgrounds, and travel motivations (Mohamad et al., 2023). Behavioral biases, such as hypothetical bias or anchoring effects also influence WTP estimates, leading to overstated or inconsistent valuations (Carson et al., 2007). Addressing these factors through a robust experimental design and segmentation analysis can enhance the validity and applicability of CE findings in real-world policy contexts. Still, there is a scarcity of empirical evidence on tourists' responses to recreational beach improvement and how specific attributes influence the demand. Moreover, stated preference methods, which include the choice experiment (CE) method and contingent valuation methods (CVM), enable researchers to assign a value to non-market goods by presenting respondents with hypothetical scenarios and asking them to make choices (Hanley et al., 1998; Bateman et al., 2004). This is particularly beneficial when traditional market data is unavailable. However, a notable limitation is that the hypothetical nature of the scenarios may cause respondents to inaccurately express their true willingness to pay through their choices (Carson et al., 2007; Loomis, 2011).
The claim that shoreline maintenance and water quality regulations are economical is supported by defensible non-market values. Water pollution, beach pollution, overcrowding, and development threaten the quality of beaches for both residents and tourists. According to Houston (1996), beach recreation comprises an important element of global tourism and significantly contributes to economic activities. Government agencies accountable for protecting and preserving coastlines and beaches facing increasing operational costs may have had their funding reduced in recent years due to the COVID-19 pandemic's impact on the tourism industry (OECD, 2020). Furthermore, in times of economic downturn and pandemics, the tourism sector frequently advocates for leniency in environmental regulations that may contribute to pollution originating from stormwater and wastewater discharges. Besides, beach recreation resource management should be sensitive to public preferences to ensure that environmental policies align with stakeholder values and user satisfaction (Davies et al., 2025). Managers can gain insight into aspects of the beach and the beach leisure experience that visitors find most beneficial by conducting visitor surveys. This offers a bottom-to-top approach to managing beaches (Roca et al., 2008). According to Pereira et al. (2003), beachgoers in Brazil prefer locations that offer clear water and pristine sand, in addition to convenient access, amenities, and ample space at the shore (an acceptable level of crowding).
Maintaining clean shorelines and coastal waters is costly, with Loomis (2013) estimating WTP for improved beach water clarity at USD 34 to USD 70 per visitor day using the CE and CVM. This valuation underscores the importance of water quality for aesthetics and health, supported by Penn (2016), who found a maximum WTP of USD 45 to improve water quality at Oahu Beach, Hawaii. Similarly, a meta-analysis by Judith et al. (2022) revealed that individuals are willing to pay an average of USD 35.29 annually for a 50% reduction in beach trash, emphasizing the critical role of cleanliness in beach enjoyment. Chen and Zhang (2023) found a substantial reduction in garbage to be the most preferred attribute for artificial beach parks, with a WTP of CNY 39.75. This preference aligns with findings from the Colombian Caribbean Region, where more than 70% of respondents expressed a WTP for Beach Ecosystem Services (BES), ranging from USD 3.40 to USD 6.80 per month (Tatiana et al., 2018). These studies collectively illustrate that WTP for beach improvements is influenced by various factors, including cleanliness, facilities, aesthetics, and health considerations.
The findings of previous studies suggest that effective beach management and policy development should prioritize key attributes to align with public preferences. By emphasizing the maintenance of water quality, cleanliness, and well-developed facilities, policymakers can ensure sustainable tourism and optimal resource allocation, ultimately enhancing the appeal and economic viability of beach destinations. Understanding tourists' WTP is crucial for guiding decision-making and resource allocation in beach management. It ensures that investments align with tourists' preferences, maximizing satisfaction and economic benefits (Rulleau & Rey-Valette, 2017). By prioritizing attributes with the highest WTP, such as facilities, policymakers can efficiently allocate resources, promote sustainable tourism, and enhance the overall attractiveness of beaches (Mohamad et al., 2022). This, in turn, supports the local economy and environmental conservation efforts (Powell & Ham, 2008).
Research Methodology
Study Area
Terengganu, located on the east coast of the Malaysian peninsula and surrounded by the South China Sea, is renowned for its long coastline, pristine waters, sandy beaches, and captivating
islands. It has a diverse, friendly community with rich traditions like, songket weaving, and handicrafts. Preserving its natural beauty and heritage is essential for ongoing benefits. Despite its attractions, Terengganu ranked 11th in Malaysia with 10,233 million domestic visitors in 2022 (Department of Statistics Malaysia, 2022), hence highlighting the need to understand tourists' preferences for beach tourism enhancement. Miami Beach, located in the Kuala Nerus district with a 23.33-km coastline and 16.5-km2 area, was chosen for this study due to its prominence as a tourist destination (Figure 1). Known for its pristine white sands and clear waters, it is affectionately nicknamed 'Miami Beach' after the famous coast of Florida, USA. The beach offers a serene and intimate ambiance for visitors (Figure 2). Miami Beach is in a traditional fishing village in Kuala Nerus, surrounded by several villages and near Kuala Terengganu City and Sultan Mahmud Airport. It is part of Seberang Takir Beach, parallel to Corniche Road, and boasts numerous attractions, including the Seberang Takir drawbridge and the traditional Bot Penambang boat ferrying passengers across the Terengganu River to the Pasar Kedai Payang jetty (Rozadi et al., 2021).
The economic dynamics of Kampung Seberang Takir are largely shaped by the behavior and activities of its surrounding community. About 55% of the community in Seberang Takir engage in coastal fishing, with the remainder involved in arts and crafts, shuttle boat services, and other small-scale enterprises (Mohd Rozadi et al., 2021). About 971 coastal fishers were registered in Seberang Takir, showing its strong role as a fishing village (Lili et al., 2019). Despite recent developments, such as the drawbridge and Seberang Takir beach improvement, these changes have affected the village's economic stability. The primary occupations of the villagers revolve around fishing, fish processing, and employment in the public sector. The village is delineated into three distinct areas: (i) the fishing zone known as Hujung Tanjung, (ii) Pengkalan Titian, and (iii) the coastal settlement in the northeast. In addition to fishing, a significant portion of the population is engaged in small-scale enterprises such as selling fish or shrimp crackers, salted fish processing, batik printing, and other cottage industries (Jafar and Harun, 2019). The socio-cultural fabric of Kg. Seberang Takir is deeply influenced by the rich tapestry of Malay heritage, evident in their daily practices, customs, and beliefs (Mohd Rozadi et al., 2021).
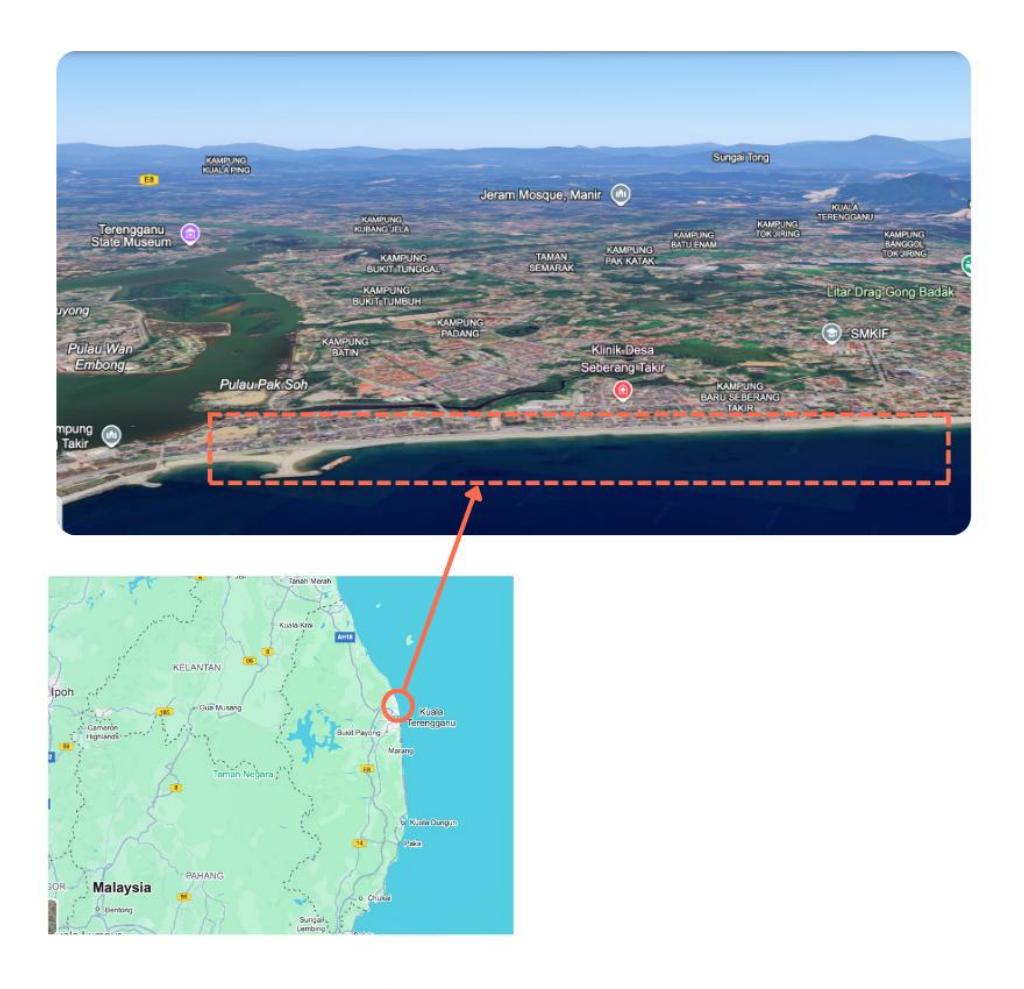
Figure 1. Study site – location of Miami Beach, Kuala Nerus, Terengganu, Malaysia. Source: Retrieved from Google Earth (2025)
Figure 2. Scenery at Miami Beach, Terengganu, Malaysia. Source: Author's own photograph
Questionnaire Design
The questionnaire for this study was designed into three sections to ensure comprehensive data collection. Section A captured respondents' socio-demographic characteristics, providing essential background information. The respondents were tourists who had stayed at least one
night in registered hotels in Terengganu and had visited Miami Beach, selected using nonprobability sampling. Section B focused on tourists' reasons for supporting beach improvement and included Likert scale questions to assess their perceptions and opinions on Miami Beach. These questions helped gauge the significance of environmental conservation and economic sustainability from the tourists' perspective. Finally, Section C employed the choice experiment (CE) method, where respondents evaluated hypothetical beach improvement scenarios through choice cards, selecting the option that provided them with the highest utility. The CE method is useful in eliciting tourists' trade-offs between different attributes, offering insight into their willingness to pay for improvements. The questionnaire was administered during a field survey among visitors at Miami Beach, Terengganu, ensuring that the responses reflected real-time visitor experiences and preferences, thus enhancing the study's reliability and policy relevance.
Choice Experiment (CE)
This study employed the CE method, which is founded on Random Utility Theory (RUT) and in line with neoclassical economics and Lancaster's Characteristics Theory of Value (LCTV) (Lancaster, 1966; Manski, 1977). The RUT posits that individuals make choices to maximize utility, considering both observable and unobservable factors. It assumes that individuals choose the option with the highest utility or satisfaction. In comparison, LCTV expands upon RUT by emphasizing that goods and services are valued not only for their intrinsic characteristics but also for their extrinsic characteristics. This theory suggests that individuals evaluate options based on the bundle of characteristics they offer rather than solely on the goods or services themselves. Thus, RUT and LCTV provide frameworks for understanding how individuals make choices in the context of CE, incorporating both observable attributes and unobservable factors while emphasizing the importance of characteristics in determining value. The driving factors influencing individual choices include price, perceived benefits, personal preferences, environmental awareness, past experiences, and socio-demographic characteristics such as income, education level, and age. These factors shape how individuals assess trade-offs between different attributes and determine their willingness to pay for specific improvements. Dichotomous CE relies on RUT, a well-tested framework linked to error components that impact parameter estimates and welfare measures obtained from CE data (Louviere et al., 2010). The utility theory is depicted as an Equation 1:
\[U_{ij} = V_{ij} + \varepsilon_{ij}. \tag{1}\]
Uij presents the indirect utility function of respondents i obtained from scenario j, Vij represents an observable component (explained on levels of attributes and observed characteristics), while ɛij represents an error term, an unobservable component. If an individual i prefers option j to another alternative of option k, then:
\[V_{ij} + \varepsilon_{ij} > V_{ik} + \varepsilon_{ik}, \qquad (2)\]
\[V_{ij} - V_{ik} > \varepsilon_{ik} - \varepsilon_{ij}. \tag{3}\]
Since error terms are unknown, the following demonstrates the probability that an individual will prefer option j:
Prob \[[U_{ij} > U_{ik}] = \text{Prob } [\varepsilon_{ik} - \varepsilon_{ij} < V_{ij} - V_{ik}]\] (4)
This study used Multinomial Logit Model (MNL) as developed by McFadden in 1974 (McFadden, 1974). The study applied the MNL model to four beach attributes (cleanliness, facilities, aesthetics, and local fees) that were used in the study (Table 1). The utility function Uij represents individual i selecting option j. The attribute levels and coefficients comprise the utility function Uij, as outlined below:
\[U_{ij} = \beta_1 \text{Cleanliness}_{ij} + \beta_2 \text{Facilities}_{ij} + \beta_3 \text{Aesthetic}_{ij} + \beta_4 \text{Local Fee}_{ij} + \epsilon_{ij}\]. (5)
Individual error terms are executed as Weibull distributions in this model that are independently and identically distributed (IID). Equation 5 presents the attribute levels for cleanliness, aesthetics, facilities, and local fees for individual i and option j. The probability that an individual i who selects option j from a set of k options, as in Equation 6. Next, we can use the MNL model to calculate the choice probabilities for each option:
\[Prob_{ij} = \frac{\exp(Vij)}{\sum_{k=1}^{K} \exp(Vik)}.\] (6)
In the context where Vij denotes β, an attribute vector X signifies observed individual characteristics and attributes. The marginal WTP (MWTP) can be determined by estimating the marginal rate of substitution (MRS) between the attributes and the monetary attribute (local fee) utilized in this study, using the estimated coefficients from the multinomial logit, the estimation is as follows:
\[MWTP = -\frac{\beta \text{ attribute}}{\beta \text{ monetary attribute}}\] (7)
Using techniques based on stated preference is necessary to estimate the tourists' WTP, where a CE determines tourists' WTP by looking at their preferences, which includes how tourists value the attributes of recreational beach improvement at Miami Beach, Kuala Terengganu. The CE method is ideal as it allows for a systematic exploration of tourists' preferences by presenting them with hypothetical scenarios mimicking real-life choices. In this study, the scenarios presented in the CE involved trade-offs between different levels of beach improvement, including cleanliness, facilities, and aesthetics. Each scenario assumed that tourists would make decisions based on their preferences and willingness to pay, reflecting real-world constraints and economic considerations (Hanley et al., 1998; Bennet et al., 2001). Moreover, the CE method can portray selected attributes and their levels to offer a selection of tourists' preferences between beach attributes and intangible characteristics such as local charge fees introduced in the study. By presenting respondents with hypothetical scenarios where they must choose between different combinations of attributes (beach cleanliness, facilities, aesthetics, and local fees), this method quantifies the relative importance of these factors. This method provides policymakers with concrete, data-driven insights into visitors' preferences, facilitating informed decision-making regarding the allocation of resources for beach improvement. Besides, it offers the flexibility to explore various policy options and their potential impacts on visitor satisfaction and destination competitiveness within a controlled experimental framework. It is important to involve the public regarding their preferences and awareness in deciding beach improvement characteristics based on their demand. The primary data collection for the CE involved surveying tourists who had experienced the views and scenery of Miami Beach. They were asked about their preferences for improving the area to maintain its status as a top tourist destination in the state.
Choice Experiment Design: Attributes and Levels
Developing choice sets following the determination of attributes and their levels is critical to designing a CE. Identification of the attributes in CE need to be carefully established by referring to previous research combined with experience and knowledge of the research problem (Mohd et al., 2008). Too many attributes may be burdensome for respondents, too few may reduce accuracy due to missing information. Batsell and Louviere (1991) suggest that the attributes and levels chosen should be realistic and the situations different individuals face should be as similar as possible. Respondents will receive a 'choice set,' which includes three or four choices. In this method, the program values are indicated through attributes and attribute levels. Afterward, respondents are required to choose their preferred option. Through the CE method, important issues pertaining to selecting respondents based on quantitative and qualitative attributes are explored. This study offers four attributes, i.e., a series of beach improvement combinations (cleanliness, facilities, and aesthetics). It presented monetary attributes (local government fee) to participants in a survey to observe the tourists' most preferred choices. The discussion to determine the final attribute levels was based on expert opinions, previous studies, and the literature. This ensured that the attribute levels accurately reflected the priorities of tourists and local stakeholders, enhancing the study's validity and relevance. Attributes with a high MWTP are what tourists prefer and find most useful. The attributes, attribute levels, and descriptions are listed in Table 1.
Table 1. Explanations of attributes and their levels
| Attributes | Levels | Attribute Level Descriptions | |
|---|---|---|---|
| Level 1: A significant amount of trash is present. | |||
| Cleanliness (Clean) | Level 2: The amount of trash is moderate. | ||
| Level 3: No trash. | |||
| Facilities (Fac) | Level 1: Car parking is provided. | ||
| Level 2: Toilet, parking, and prayer room are provided. | |||
| Level 3: Toilet, parking, prayer room, and playground are provided. | |||
| Level 1: Rocky area. | |
| Aesthetic (Aes) | Level 2: Slightly rocky area with a sandy beach. |
| Level 3: Flat beach. | |
| Level 1: No charge. | |
| Local Fee | Level 2: A local fee of MYR 2 will be charged. |
| Level 3: A local fee of MYR 5 will be charged. |
Note: Italic font presents the status quo.
The first attribute explains the condition of cleanliness at the beach, which is presently at Level 1, where a significant amount of trash is present (status quo). The second and third attribute levels demonstrate improvements in the amount of trash at Miami Beach. Beach cleanliness is considered a critical determinant of beach quality by tourists, who exhibit a higher tendency to revisit beaches free of litter (Peter, 2012; Melville and Saayman, 2017). The cleanliness of the beach is crucial for visitors and the environment, where poor water or sand quality will discourage visitors and the surroundings must be free of trash (Mohamad et al., 2022).
The second attribute focuses on facilities at Miami Beach, where only car parking slots are available at the site in the current status quo. Facilities are important to beach tourist satisfaction (Angennisa et al., 2022). The second attribute level proposes the provision of toilets, parking places, and prayer rooms, while the third attribute proposes toilets, parking places, prayer rooms, and playgrounds at Miami Beach.
The third attribute level portrays the aesthetics of the beach site. The beauty, cleanliness, sand, water quality and surrounding environment of a beach heavily influence its popularity and attractiveness to visitors. The beach is an aesthetical topography that elicits both desire and fear within the human imagination (Kluwick, 2019). The first level represents a rocky beach at the site, the second level represents a beach with slightly rocky terrain and a sandy shoreline, and the third level presents a flat beach on the shoreline.
The fourth attribute (monetary attribute) offered in the study is a local government fee/charge. Any recreational beach improvement should come at a cost to fund the project/program. At present, no local fee is being charged in Terengganu. The local fee is necessary for the Kuala Terengganu City Council (MBKT) to carry out the development, maintenance, and promotion of tourism in Terengganu. The hotel will collect a charge/fee on behalf of MBKT, in addition to the hotel bill, and disburse it to MBKT. The suggested fee is based on implementing local government fees in Kelantan, Malaysia. Other states in Malaysia, such as Penang, Langkawi, and Malacca, have previously introduced a heritage tax or surcharge, as well as local government fees, to generate new sources of income. This has indirectly improved the quality of tourism products and services in these states.
Then, using the SPSS software, an orthogonal design was employed to create choice sets built on identified attributes and the levels of those attributes. The initial orthogonal design generated in 16 choice sets using a fractional factorial approach to ensure a balanced representation of attributes while maintaining statistical efficiency. Through pre-survey with 20 respondents, we evaluated choice card relevance and respondent comprehension. Based on feedback indicating potential fatigue effects, we reduced the final questionnaire to 12 choice sets (each containing four cards) while preserving orthogonality. This optimization maintained the design's ability to capture the main effects and interactions while minimizing respondent burden and maximizing data quality. Respondents may find it difficult to make reasonable decisions if there are too many choice sets (Chen and Zhang, 2023). We selected the final 12 choice sets to minimize the burden on respondents. Factors in the selection process include ensuring adequate representation of attribute combinations, minimizing redundancy, maintaining balance across levels, and maximizing variation in choice scenarios to capture diverse preferences effectively. Each choice set presents three infographic options: Options A and B suggest improvements for Miami Beach, while Option C represents the current status quo. The respondent selects Option C (status quo) to maintain current attribute levels. An example of a choice set is given in Table 2.
Table 2. Example of choice card no. 4 in the questionnaire
| Attribute | Option A | Option B | Option C |
|---|---|---|---|
| Cleanliness | |||
| Facilities | |||
| Aesthetic | |||
| Local Fee | |||
| I prefer | |
The pre-test study evaluated the survey's validity and reliability, refining questions for the study. The final questionnaire was prepared after several rounds of pre-tests. The questionnaire organized into three separate sections based on its structure. The first section focused on the economic valuation for beach improvement at Miami Beach with proposed choice sets. The second section emphasized inquiries pertaining to the understanding and perspectives of beachgoers. Meanwhile, the last section was about socio-economic and demographic information on the respondents.
Sampling Characteristics
Participants were beachgoers and visitors to Miami Beach, Terengganu, Malaysia, selected using non-probability sampling. The study focused on tourists staying at registered hotels in Terengganu, who had stayed at least one night and experienced Miami Beach. The rationale was intended to be tallied with the suggestion to implement a local government fee that will be included in the hotel bill. The survey did not include day-trippers or excursionists who visit Miami Beach without staying overnight in the state. Local government fees or heritage tax have been introduced in Kelantan, Penang, Langkawi, and Malacca, which are charged per room per night in hotel accommodations. The charge is allocated for tourism development in the states. The researchers trained the enumerators prior to the beginning of the survey and they were instructed on the proper utilization of the CE method. The pre-test survey was conducted in February 2023 with 20 participants. The final survey was implemented from March to May 2023 by distributing questionnaires among the visitors at the beach site.
We determined the sample size for the CE method in this study using established guidelines for experimental designs, considering factors such as the number of attributes and levels, desired statistical power, and anticipated effect size to ensure adequate representation and robustness of the study findings within practical constraints. This study calculated the minimum sample size using Kanninen's (2007) guidelines for CE as in Equation 8:
\[N \ge 500 \text{ x } \frac{L}{A \times C} \tag{8}\]
This calculation considers several determinants: L signifies the highest number of attribute levels (3), A signifies the alternative numbers for each choice set, excluding the status quo (2), and C signifies the number of choice cards each respondent receives (4). This generated a minimum of 188 respondents, which accounts for the specific design parameters, while maintaining statistical power. This study exceeded the minimum number by surveying 277 respondents to ensure robustness. The calculation preserved orthogonality and accounted for potential response variability across our four beach improvement attributes.
Results
The final survey was conducted with a face-to-face survey and included 277 respondents. Descriptive statistics for Tables 3, 4, and 5 were analyzed using the econometric software STATA, Version 16. Table 3 demonstrates the results of the socio-economic and demographic analysis of visitors to Miami Beach. Most respondents were female (61.1%) between the age of 18 and 27 (72.56%), whereas mostly Malay toruists (93.5%) participated in the study. Besides, respondents mostly had single status (69.31%), mostly involved retirees, fishermen, farmers, students, and others (61.37%), and many of them had an individual income in the range ≤ MYR 2,500 (75.45%).
Table 3. Respondents' socio-economic and demographic analysis
| Table 3. Respondents' socio-economic and demographic analysis | ||||
|---|---|---|---|---|
| Characteristics | Frequency | Percentage (%) | ||
| Gender | Male | 108 | 38.99 | |
| Female | 169 | 61.01 | ||
| Age (years | 18 – 27 | 201 | 72.56 | |
| old) | ||||
| 28 – 37 | 24 | 8.66 | ||
| 38 – 47 | 23 | 8.30 | ||
| 48 ≥ | 29 | 10.47 | ||
| Race | Malay | 259 | 93.50 | |
| Chinese | 10 | 3.61 | ||
| Indian | 4 | 1.44 | ||
| Others | 4 | 1.44 | ||
| Marital Status | Single | 192 | 69.31 | |
| Married | 80 | 28.88 | ||
| Divorced | 5 | 1.81 | ||
| Occupation | Government staff | 19 | 6.86 | |
| Private staff | 47 | 16.97 | ||
| Business owner | 41 | 14.80 | ||
| Others | 170 | 61.37 | ||
| Income | ≤ 2,500 | 209 | 75.45 | |
| (MYR) | ||||
| 2,501 – 4,500 | 48 | 17.33 | ||
| 4,501 – 6,500 | 14 | 5.05 | ||
| 6,501 – 8,500 | 3 | 1.08 | ||
| 8,501 – 10,500 | 1 | 0.36 | ||
| ≥ 10,501 | 2 | 0.72 | ||
The participants were questioned about their WTP to contribute and spend towards beach improvement. There was a wide range of responses (Table 4). Most of the participants (76.53%) indicated that they considered it their responsibility to practice environmentally sustainable practices at the beach. Protecting the natural environment is a critical component of sustainable beach management (Goda and Thomas, 2021). Ecosystem degradation, littering, and pollution are just a few ways beach tourism has damaged the environment. Tourists have identified five key management priorities: overcrowding, beach safety and cleanliness, information provision, and sediment and habitat management (Chen and Teng, 2016). Trash and other pollutants found on beaches can be harmful to marine life, cause ecological disruption, and affect water quality.
Table 4. Reasons for WTP for beach improvement
| Frequency | ||||||
|---|---|---|---|---|---|---|
| Response | Percentage (%) | |||||
| 1) | Our responsibility to future generations | 57 | 20.58 | |||
| 2) | Our responsibility towards a sustainable environment | 212 | 76.53 | |||
| 3) | Our responsibilities to future generations and a sustainable environment | 2 | 0.72 | |||
| 4) | I should pay to get a picturesque landscape | 3 | 1.08 | |||
| 5) | Others | 3 | 1.08 | |||
The survey questionnaire included a section with Likert-scale questions, which respondents completed to express their perceptions and opinions regarding Miami Beach. The 5-point
ordinal scale demonstrated, for instance, 1 = strongly disagree, 2 = disagree, 3 = neither/nor agree, 4 = agree, and 5 = strongly agree (Table 5). The respondents rated most of the statements as follows: 4 (indicating agree) with a mean value between 3.41 and 4.20; 5 (indicating strongly agree) with a mean value between 4.21 and 5.0. For instance, statement one received an average rating of 4.26, demonstrating that respondents strongly agreed that maintaining Miami Beach is crucial for their future visits. This underscores the role of beach cleanliness and preservation in enhancing the aesthetic appeal and visitor satisfaction. People are attracted to return to a pristine beach because of its inherent beauty, which enhances the overall recreational and relaxation experience. The presence of clean shores, clear waters, and well-maintained surroundings creates a tranquil and enjoyable atmosphere, allowing visitors to engage in various leisure activities such as swimming, sunbathing, and sightseeing. This aesthetic appeal not only contributes to their physical comfort but also enhances their emotional well-being, making their visit more fulfilling and memorable. Besides, based on statement four, the respondents agreed that the environmental degradation of Miami Beach is causing huge losses. The expansion of tourist infrastructure and inadequate environmental preservation have caused chronic beach erosion, rendering it susceptible to severe events (Escudero-Castillo et al., 2018).
Table 5. Respondents' perceptions and opinions on Miami Beach
| Statements | Mean | Std. Dev. | |
|---|---|---|---|
| 1) | It is critical to maintain Miami Beach, so I can visit it again in the future | 4.2635 | 1.2594 |
| 2) | Miami Beach is very important to protect to ensure the continued arrival of tourists | 4.2924 | 1.2815 |
| 3) | Miami Beach is very important to be preserved as a tourist attraction to the state of Terengganu | 4.2418 | 1.2808 |
| 4) | The environmental degradation of Miami Beach is causing huge losses | 4.1299 | 1.1937 |
| 5) | Pollution of Miami Beach causes losses to other economic sectors near the location | 4.1444 | 1.2221 |
| 6) | Miami Beach is very important to take care of because it provides benefits to local communities | 4.2202 | 1.2300 |
The descriptive statistics reveal consistent ratings across the variables in the CE conducted with 277 respondents (Table 6). The mean values for all variables (Cleanliness, Facilities, Aesthetics, and Local fee) were 1.75, indicating that, on average, the respondents rated these attributes similarly on a scale of 1 to 3. The standard deviation of 0.8292 suggests moderate variability in the responses, implying some diversity in how the respondents perceived these attributes. The minimum and maximum values of 1 and 3 confirm that the respondents utilized the full range of the scale. With no missing values, the data set appears complete, providing a robust foundation for further analysis.
Table 6. Descriptive statistics for the attributes
| Variable | Mean | Std. | Minimum | Maximum | Cases |
|---|---|---|---|---|---|
| Deviation | |||||
| Cleanliness | 1.75 | 0.8292 | 1 | 3 | 3324 |
| Facilities | 1.75 | 0.8292 | 1 | 3 | 3324 |
| Aesthetic | 1.75 | 0.8292 | 1 | 3 | 3324 |
| Local Fee | 1.75 | 0.8292 | 1 | 3 | 3324 |
The Multinomial Logit (MNL) model signifies that the odds of selecting one alternative/option over another do not change based on whether other options are available. The MNL is adaptable and can cater to many attributes and levels associated with the alternatives in a CE. This study applies the MNL as in Table 7 regressed using the econometric software NLogit, Version 4. The study discovered that tourists are willing to pay more to improve the beach, given the current state of the beach in Miami Beach. The coefficients in Table 7 represent the estimated effects of each attribute level on the likelihood of choosing a particular option in the CE. We determined the probability of selecting each option with respect to changes in the attribute levels to calculate the marginal effects. For instance, for the attribute Cleanliness, the coefficients for Level 2 (0.9169) and Level 3 (1.2785) indicate the impact of moving from the base level (Level 1) to Level 2 and Level 3, respectively, on the probability of selecting an option. Also, coefficients for other attributes, such as Facilities and Aesthetics, demonstrated their respective effects. All variables associated with beach improvement attributes were statistically significant at a 1% level, and Local Fee was significant at a 10% level. Demonstrating the cleanliness, facilities, and aesthetics of the beach can greatly enhance the experience of tourists, resulting in higher satisfaction and probability of return visits. The variable for local fees reflects a negative relationship; an increase in fees results in a decrease in tourists' utility, in line with studies by Mohamad et al. (2022) and Chen and Zhang (2023). The negative coefficient for Local Fee implies a decrease in the probability of selecting an option with an increase in the local fee. The negative coefficient for the local fee (-0.1088) aligns with economic theory, confirming that tourists' willingness to pay (WTP) decreases as fees increase, a rational trade-off between cost and perceived value. This finding highlights the sensitivity of tourists to additional local fees, which could influence their choices regarding beach improvements in Terengganu, Malaysia. Furthermore, the Akaike Information Criterion (AIC) and Bayesian Information Criterion (BIC) values of 1.51333 and 1.54498, respectively, suggest the model's goodness of fit. Lower values indicate better fit, with AIC and BIC as guides for selection among competing models, considering both fit and complexity. The adjusted R-squared value of 0.47 indicates that the model explains 47% of the variation in the dependent variable, suggesting a moderate-to-good fit of the model to the data. The data output suggests that the multinomial logit model reasonably fits the data and adequately explains tourists' preferences for beach improvements in Terengganu, Malaysia.
Table 7. Discrete choice and multinomial logit model analysis
| Variables | Coefficient | Standard Error | b/St.Er. | |
|---|---|---|---|---|
| Clean Level 2 | 0.9169*** | 0.2573 | 3.564 | |
| Clean Level 3 | 1.2785*** | 0.2362 | 5.411 | |
| Fac Level 2 | 1.2032*** | 0.2085 | 5.770 | |
| Fac Level 3 | 1.5440*** | 0.1928 | 8.004 | |
| Aes Level 2 | 1.0075*** | 0.2562 | 3.932 | |
| Aes Level 3 | 0.8702*** | 0.1345 | 6.469 | |
| Local Fee | -0.1088* | 0.0968 | -1.125 | |
| No. of observations | 1108 | |||
| Log-likelihood function | - 831.3827 | |||
| Info. criterion: AIC | 1.51333 | |||
| Info. criterion: BIC | 1.54498 | |||
| Adjusted-R2 | 0.473 | |||
Note: (***) statistically significant at 1% levels, (**) statistically significant at 5% level, (*) statistically significant at 10% level.
The study calculated the value that tourists are willing to pay for each beach improvement attribute based on Equation 7. The MWTP was computed using the Wald test, as presented in Table 8. The calculation of the MWTP plays a crucial role in understanding the economic value that individuals place on different attributes of goods or services. In this case, tourists demonstrated a positive WTP for improving the beach. However, their preferences differed significantly. According to the study, Facilities at Level 3 were the most preferred among tourists, which revealed that their WTP for these facilities was estimated at MYR 14.1797 (USD 2.97). Tourists prefer to have toilets, parking places, prayer rooms, and playgrounds provided at the beach site, along with proper facilities to enhance the overall experience. These findings provide concrete evidence for policymakers to prioritize facility upgrades, as visitors clearly value and are willing to pay for these amenities. Besides, tourists are willing to pay MYR 8.4213 (USD 1.76) to enhance the beach cleanliness (Clean Level 2) from Level 1 (status quo) to Level 2. If there is no trash at the beach site, as suggested at Level 3, the tourists are willing to pay MYR 11.7415 (USD 2.46). If there is a slightly rocky area with a sandy beach, the tourists are willing to pay MYR 9.2532 (USD 1.94). Meanwhile, if there is a flat beach, as in Level 3, the tourists are willing to pay MYR 7.9917 (USD 1.68). A higher MWTP in the CE method indicates a higher WTP for certain attributes compared to the attribute level in the price attribute. This could indicate that tourists value those attributes highly and are willing to invest beyond the proposed price level for their preferred amenities, reflecting strong preferences for those attributes.
From a policy perspective, the MWTP values suggest that: (1) implementing a MYR 5 local fee appears feasible given tourists demonstrated their WTP, (2) facility improvements should be prioritized as they deliver the highest perceived value, and (3) a tiered improvement strategy could be developed based on these valuation estimates. The MWTP results demonstrate strong feasibility for implementing a MYR 5 local fee, as this amount falls below all estimated willingness to pay values (MYR 7.99 to 14.18) while aligning with successful fee models in Malacca (MYR 3 to MYR 5, heritage tax), Kelantan (MYR 2 to MYR 3, local government fee) and Penang (MYR 2 per room per night, heritage tax). A phased improvement strategy prioritizing high value amenities (facilities → cleanliness → aesthetics) would match tourist preferences while creating sustainable revenue streams. Moreover, the results provide a financially-grounded framework for decision-making that balances tourist preferences with sustainable development goals (SDGs).
The findings of this study align with previous research indicating tourists' WTP for beach improvements and their preferences for certain attributes. In the Malaysian context, Mohamad et al. (2022) demonstrated through the conditional logit model that tourists in Teluk Kemang, Port Dickson, were willing to pay higher entrance fees to access beaches with better amenities and cleanliness, indicating the feasibility of charging fees to fund beach maintenance. In comparison, Mohamad et al. (2023) employed a Mixed Logit (MXL) model to calculate willingness to pay with MYR 1.895 to MYR 4.22 for enhanced recreational facilities, cleanliness, and amenities at the beach. According to Mohamad's study, demographic factors such as gender, age, and education considerably influenced preferences, highlighting the importance of considering diverse visitor profiles in coastal resource management decisions. Internationally, studies such as Musharaf et al. (2018) have assessed the benefits of beach quality improvements by comparing implicit travel costs and explicit entrance fees in discrete CE. The results showed that including an entrance fee as an explicit payment vehicle influences visitors' preferences and WTP, yielding higher WTP values. Implicit payment methods underestimate welfare changes, indicating the potential for economic instruments like entrance fees to support sustainable beach management financially.
Table 8. Wald test analysis
| Variables | Coefficient | Standard Error | b/St.Er. | |
|---|---|---|---|---|
| Clean Level 2 | 8.4213 | 6.8169 | 1.235 | |
| Clean Level 3 | 11.7415 | 9.6932 | 1.211 | |
| Fac Level 2 | 11.0505 | 10.0491 | 1.100 | |
| Fac Level 3 | 14.1797 | 11.9714 | 1.184 | |
| Aes Level 2 | 9.2532 | 9.2778 | 0.997 | |
| Aes Level 3 | 7.9917 | 6.9676 | 1.147 | |
| Wald Statistic | 3.0301 | |||
| Prob. from squared | Chi | 0.8050 |
Conclusion
Attracting more tourists to Terengganu generates income, creates job opportunities, and supports local businesses. Therefore, understanding tourists' demands and preferences is crucial to positioning Terengganu as a favorable destination while ensuring sustainable tourism development. This study employed a choice experiment (CE) to investigate tourists' preferences and willingness to pay (WTP) for beach improvement. The findings from the Multinomial Logit (MNL) model highlight that enhancements in facilities, cleanliness, and aesthetics significantly influence tourists' utility and beach experience.
A clean beach is more attractive to visitors, as it enhances its aesthetic appeal and encourages recreational activities. Well-maintained facilities, such as parking areas, toilets, and prayer rooms, improve convenience and visitor satisfaction, ultimately strengthening the local tourism economy. The study's WTP estimates indicate that tourists are willing to pay most for enhanced facilities (FacLevel 3), highlighting the importance of investing in infrastructure. The results also suggest that aesthetic improvements should align with tourists' preferences, as they value a slightly rocky beach with sandy areas over extensive modifications.
This research contributes to sustainable tourism by providing empirical evidence on tourists' WTP for environmental and infrastructure improvements. By quantifying the economic value of beach attributes, the study offers actionable insights for policymakers to prioritize sustainable development initiatives. The findings underscore the necessity of balancing tourism growth with environmental conservation, ensuring that natural coastal resources remain attractive and viable for future generations.
In addressing broader sustainability challenges, this study highlights the role of local fees as a financing mechanism for environmental conservation and tourism infrastructure. Integrating a local government fee into hotel bills in Terengganu could provide a consistent revenue stream for maintaining and enhancing beach environments. The funds could support conservation projects, waste management, and eco-friendly initiatives, fostering long-term environmental stewardship. This approach aligns with global best practices, where sustainable financing models ensure that tourism development does not come at the expense of ecological integrity.
The findings offer insights for integrated coastal zone management, highlighting how tourism infrastructure investments such as facilities and cleanliness can align with Terengganu spatial planning goals. The demonstrated WTP for amenities supports strategic infrastructure
prioritization in high visitation zones, while the local fee mechanism presents a governance tool for sustainable financing, mirroring Penang, Malacca and Kelantan local government fees. By linking tourist preferences to SDG 11 (Sustainable Cities and Communities), this study provides a framework for multi stakeholder governance such as local councils, tourism boards, environmental agencies to balance economic growth.
Despite its contributions, this study acknowledges limitations such as sample size constraints and the hypothetical nature of the CE method, which may introduce bias in WTP estimates. The study specifically targeted tourists staying at registered hotels (minimum one night stay) to align with the proposed local fee policy, which would be collected through hotel bills. While this approach ensures policy relevance, this study acknowledge potential sampling bias by excluding day-trippers and non-hotel guests, who may have different preferences. Then, future studies could expand sampling to include other visitor segments for broader generalizability. However, its methodological rigor and policy relevance provide a valuable foundation for further research on sustainable tourism financing and beach management strategies. Future studies could explore broader geographic areas and incorporate behavioral approaches to enhance the robustness of preference assessments.
Ultimately, this research advances the discourse on sustainable tourism by demonstrating how targeted improvements and innovative funding mechanisms can enhance visitor experiences while preserving natural assets. By integrating economic valuation with policy recommendations, it provides a practical framework for achieving a balance between tourism development and environmental sustainability in coastal destinations.