
INTRODUCTION
Fish cages in reservoirs have been growing uncontrollably since economic crisis stoke Indonesia in 1997. This is a way to provide jobs for people and at the same time it supplies the demand of food. Unfortunately, fish cages in reservoirs impact quality of the water (i.e. Porter et at., 1987; Degefua et al., 2011; Demetrio et al., 2011). These situations have been taking place in Jatiluhur reservoir thus the water contains high concentration of nutrient such as Nitrogen (N) and Phosphorous (P). The source of nutrient is the residue of fish pellet in addition to the polluted main river inflow and eroded soil particles from the catchment. In order to restore the water quality, advantages of the biodegradation process along the reservoir is utilized to reduce the concentration of nutrient in the outlet zone. The paper discusses the results of computer simulations on the relocation of fish cage to the upstream side.
There are indications that degradation of water in some reservoirs has been taking place. In Gajahmungkur reservoir, it was found that the pollutants come from eroded soils about 891 ton per year (Pujiastuti et al., 2013). Additionally, fish cage contributes 81,963 ton Nitrogen per year and 28,501 ton phosphorous per year. Similarly, it was reported that algal blooming at the surface area of Sutami reservoir. The phosphorous load is around 39 to 195 kg P per year (Juantari et al., 2013). Moreover, Achmad (2001) reported that some lakes and reservoir are polluted by domestic wastes water such as in Batujai reservoir. The Index of Pollution is higher for the reservoir than that for the main river water. Tjahjo (2010) stated that the main source of pollutant in the cascaded reservoir, Sagululing, Cirata, and Jatiluhur, is naturally polluted by the eroded materials containing nutrients and also by residue of fish pellet in cages. Furthermore, Machbub (2010) proposed a solution to increase the water quality by reducing the number of fish cage. The number of fish cage in Saguling reservoir should be reduced to about 3600 units, Cirata reservoir to about 7000 units, and Jatiluhur reservoir to about 6700 units.
There are some forms of Nitrogen in water. In impounded water, nitrogen follows bio-chemical and physical processes as known as nitrogen cycles. The biochemical processes in the water consists of photosynthesis, respiration, and degradation of organic materials in the water and the sediment. Nitrogen is basically found in natural water in such amount that is stable for the consumption of the ecosystems. Increment of nitrogen by human or nature will stimulate the growth of aquatic weeds as part of nitrogen cycle. The sun light determines the growth of phytoplankton that raises the photosynthesis process. The light penetration reduces then the biochemical processes also decrease. As the velocity of flow is very small, the dead organisms are deposited in the bottom then the decomposer bacteria will produce NH<sub>3</sub>. The decomposition process uptakes oxygen in the water then the dissolved oxygen reduces dramatically that disrupts the biological life in the water. Moreover, the de-oxygenation may take place as the oxygen is used by organic in the sediment, algae and other aquatic lives. Nitrification is an oxidation process of ammonia \((NH_4^+)\) to be nitrate \((NO_3^-)\) by Nitrosomonas bacteria. Nitrate and ammonium can become macrophytes and algae through assimilation processes. Nitrate may become NO<sub>2</sub> to be uptaken by blue green algae or it releases to air. By taking advantages that nitrogen is degradable; relocation of fish cages upstream may reduce the concentration at the outlet zones.
Nitrogen in water can be reduced by physical, chemical, and biological process. Physical-chemical process through coagulation can be applied as physical and chemical characteristics among reservoir and water treatment may have some similarities. Coagulation can be applied in reservoirs as stated by Cheng et al. (2003) but the applicability in deep reservoir need further research as chemical compound will also give nuisance to other aquatic life. Together with the dead micro algae, Nitrogen in the form of flock will settle down to the bottom and then the sediment can be dredged. Jianga and Shenb (2006) proposed dredging, although it is costly, as the first step to remove sediment as an internal loading. In deep reservoir, this way is not practicable. Naturally, in water rich nitrogen, water hyacinth will grow fast and uncontrollably. Luckily, it can physically be removed from the water to load on land. As almost all reservoirs in Java contain high nutrient, Tjahjo et al. (2010) suggested quick actions for controlling and reducing the entering pollutants at the upstream side of Citarum River. At the same time the number of Fish Cage should be reduced and controlled in order to avoid further water quality degradation such as eutrophication.
Eutrophication is a gradual process to enrich a water body because the supply of Nitrogen and Phosphorous is abundant. During the process, nutrient in the water will be conversed by green cell
through photosynthesis. The green cells, such as phytoplankton and algae, grow producing color and odor of the water (ie. Peiris and Miguntanna, 2012; Smith et al., 1999). The dead aquatic weeds will settle down at the bottom and the degradation process will occur. The effects of eutrophication process in each reservoir vary temporally and spatially as it is under the influence of hydrodynamic of water flowing through the reservoir (ie. Boegman et al., 2001; Xu et al., 2010; Dingguo et al., 2011). Taking account of the hydrodynamic characteristics, Sudjono (2003) stated that the quality of water flowing through the elongated reservoir such as Jatiluhur reservoir is not uniform. The hydrodynamic characteristic is under the influence of physical characteristics of the reservoir such as depth, hydraulic radius, and the shoreline number. The consequence of those characteristics is that sun light penetration varies then physical and biochemical processes are spatially differs.
The fate of nitrogen in the water needs to be predicted in order to manage the concentration. Under the role of bio-chemical processes, the nitrogen as nutrient for aquatic lives is closely related to the hydrodynamic of the flowing water in the reservoir and the physical characteristics of the reservoir such as depth and the riverine shaped or shoreline number. To comprehend the process, several research related to the nitrogen cycle in reservoir had been done. The information on the rate of nitrification, denitrification, deposition and death rate of the aquatic live had been investigated but the applicability depends on the local conditions. The cycle of nitrogen is transformed into mathematical forms by making use of some coefficients found in laboratory research. It concerns on the transformation of nitrification, denitrification, degradation, and deposition. Additional problem is about data scarcity that is commonly found in developing countries. So the prediction may not reach accurate results. However, the alteration of water quality in respect to the change in some source of pollutants should be possible to be explained through simulation results.
Mathematic models on water quality in impounded waters had been developed since half century ago. The model can be in the form of empirical formulae or numerical formulation. Several empirical formulae to estimate the role of nutrient had been developed, eg. Vollenweider (1976); Jones and Bachmann (1976), Dillon and Rigler (1975). Lake Okeechobee had also been studied by implementing those formulae and the modified by Kratzer and Brezonik (1984). Their formulae were developed based on data of a specific reservoir so that the formulae may be only applicable for the specified reservoirs (Sudjono and Novendra, 2002). Previous research confirmed that the fate of Nitrogen is under the influence of hydrodynamics of flowing water in a reservoir (Boegman et al., 2001; Dingguo et al., 2011). Some developers implement several numerical methods such as Runge-Kutta in solving the equations (Ali, 1974). Water quality models had already been initiated in many part of the world. For example in Japan (Kusuda, 1984), in Lake Burley Griffin (Cullen et al., 1979). Moreover, DHL (1986) demonstrate a transport model in a reservoir based on schematization of nutrient cycle in water. There are basically two schemes applied in a model, these are one box for mostly uniform conditions and multiple boxes for non uniform conditions. Further study by Sudjono (2003) indicates that in elongated reservoirs, the biochemical and physical processes are not uniform for every part along the water flow. The significant differences on depth, velocity of flow, temperature stratifications may be the reasons to produce segmentation along the water flow as this research will take advantages upon these situations.
Even though nitrate is not the only chemicals compound causing water quality degradation in a reservoir, its role to speed up the eutrophication processes is significant. The source of Nitrogen can be internal activity such as fish breeding and external activities such as agriculture in the catchment area. One of the efforts to reduce Nitrogen in outlet zones is fish cage relocations to upstream sites of the reservoir. In the research, simulations of the nitrate reduction as a result of fish cage relocations are conducted by using a mathematic model based on horizontal segmentation of elongated reservoir.
COMPUTATIONAL METHODS
The computation on overland flow
Rainwater drops on a segment, then it will infiltrate through the soil pores in to lower soil layer in case it has not been filled with water yet or unsaturated. The water in soil layers will move horizontally to the downstream direction making the downstream soil layers quickly saturated. The horizontal subsurface flow to saturated layer will emerge to the upper soil layers as return flow. Rain on to saturated layers will be overland water. The amount of flowing water from an area is the combination of overland flow and returned flow. The processes of flow generation are schematized in Figure 1.
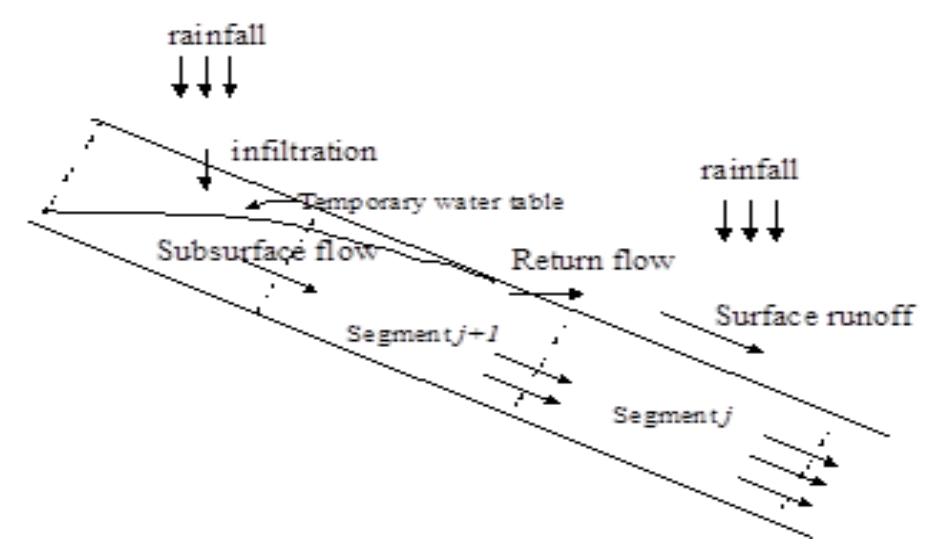
Figure 1. Rainfall in generating stream water
The study area is divided into array for the right side and the left side of the reservoir as shown in Figure 2. The division of the catchment into arrays depends on the topography and the velocity of water flowing in the reservoir. An array, then, is divided into segments. The length of the segment depends on the average overland flow velocity. The properties of the area and the surface slope influence the overland flow velocity. Every segment is horizontally divided into layers that the main characteristic of a layer is the hydraulic conductivity. In order to compute the quantity of overland flow, the overland flow was calculated using computer model ISTFM (Sudjono, 1995 and 2003).
Figure 2. The segment in the Jatiluhur reservoir
The basic computation of the overland flow and subsurface flow in a soil layer is based on the water balance at every soil layer as a piece of land as shown in Figure 3. The principle of water balance in a soil layer is in equation 1
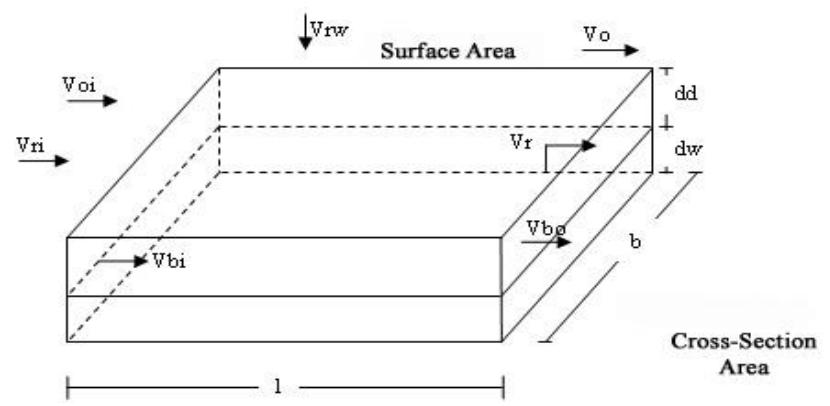
Figure 3. Water balance in a soil layer
\[\Delta V_{rw} + \Delta V_{bi} + \Delta V_{oi} + \Delta V_{ri} = \Delta V_v + \Delta V_{bo} + \Delta V_r + \Delta V_o \tag{1}\]
Where:
\(\Delta V_{rw}\) = volume of rainwater to a segment
\(\Delta V_{bi}\) = volume of subsurface flow into a segment; \(\Delta V_{oi}\) = volume of overland flow into a segment;
\(\Delta V_{ri}\) = volume of return flow into a segment; \(\Delta V_v\) = volume of rainwater retardate in the segment;
\(\Delta V_{bo}\) = volume of subsurface flow out of a segment; \(\Delta V_r\) = volume of return flow out of a segment;
\(\Delta V_0\) = volume of overland flow out of a segment
Concerning the accuracy of the predicted flow, basin physical characteristics such as hydraulic conductivity, surface slope and area must be considered. So that flow equation can be written as:
\[Q = f(k, s, A, i, t) \tag{2}\]
Where:
\(Q = \text{flow}, [L^3]/[T]; k = \text{the near saturation hydraulic conductivity}, [L]/[T];\)
\(S = \text{surface slope}, [L]/[L]; A = \text{surface area of a segment}, [L^2].\)
I = rainfall intensity, [L]/[T]; t = time, [T].
Input data for the computer model consists of physical data about the basin such as hydraulic conductivity, porosity, surface area, and slope. The length of a segment is 120 m, time step 10 days, and the velocity of overland flow is 12 meter/day. The physical data can be found from a photographical map and the hydraulic conductivity was measured by constant head permeameter method. Other data are rainfall and nitrogen concentration in overland flow. Rainfall data 2010 will be used for the simulation
The overland flow carries soil compounds such as nitrogen that adds the load in the reservoir. The amount of nitrogen in the overland flow is estimated by taking account on the land use as guided in Table 1. The nitrogen in the overland flow will be combined with the nitrogen in at each segment of the reservoir.
Table 1. The average nitrogen concentration in overland flow.
| Land use | Average Nitrogen Concentration |
|---|---|
| Land use | mg/l |
| Forest | 0.7 - 0.8 |
| Dominated by forest | 0.8 - 1.3 |
| Mixed land use | 1.1 - 1.7 |
| Dominated by settlement | 1.5 - 1.9 |
| Dominated by agriculture | 1.7 - 2.1 |
| Agriculture land | 2.2 - 5.2 |
Source: Schnoor, 1996.
Prediction on Nitrate Concentration along the Reservoir
TREM (Tropical Reservoir Eutrophication Model) was developed to predict alteration of chemical concentrations in an elongated reservoir such as Jatiluhur (Sudjono 2003). It is assumed that the condition in the segment is steady state and completely mixed. The application of the TREM requires the Jatiluhur reservoir to be divided into 9 segments where the water detention in a segment is the length of a time step (\(\Delta t\)). Then the water will move to aside downstream segment. In other words, the water in the segment comes from the upstream segment together with overland flow from the segment's catchment area. The most upstream segment receives water from the mainstream, Citarum River, and the overland flow from the catchment of the segment. At the most downstream segment, the water moves out through the outlet gate. Evaporation and water withdrawn by Water Supply Company are also taken into consideration. The schematized figure on the movement of the water in the reservoir is depicted in Figure 4.
Figure 4. The scheme of horizontal segmentation of a reservoir
Equation (3) is applied for the most upstream segment or the first segment. \(V_1^t = Vr_1^t + Vs_1^t - Vo_1^t\) \(Vr_1^t\) is the volume of the main river entering the reservoir. (3)
Assuming that the water will move to the `downstream segment, the equation (4) can be applied. \[V_n^t = V_{n-1}^{t-1} + V s_n^t - V o_n^t \tag{4}\]
Where, \(V_{n-1}^{t-1}\) is the volume of water from the previous segment at the previous time (t-1); \(Vs_n^t\) is the volume of overland flow; \(Vo_n^t\) is the volume of water loss.
Pollutant in the reservoir can be from the river water, overland flow, and activities in the reservoir such as fish culture. The computation needs those data at each segment.
The nitrogen balance for the most upstream segment is presented in equation (5)
\[L_n^t = Lr_1^t + Li_1^t - l_1^t (5)\]
For other segments, equation (6) can be applied
\[L_n^t = Lr_{n-1}^{t-1} + Li_n^t - l_n^t \tag{6}\]
During a time step (\(\Delta t\)), the concentration of nitrogen will change following first order of reaction as presented in equation (7). \(C_n^t = C_{n-1}^{t-1} e^{-k\Delta t}\)
\[C_n^t = C_{n-1}^{t-1} e^{-\hat{k}\Delta t} \tag{7}\]
Where C<sub>n</sub><sup>t</sup> is the concentration of Nitrogen at segment (n) at time (t), and k is the coefficient of first order reaction. The application of first order of reaction can only produce rough estimations. A comprehensive equation on nitrogen degradation can be applied into the TREM.
Computer Simulation
The goal of the simulation is to investigate the reduction of nitrate in the outlet zone as a result of fish cage relocation. The variable of the simulation is the number of fish cage relocated from segment 8<sup>th</sup> and the location of the relocated fish cage, ie. Segment second, third, and fourth. The number of relocated and location for the simulation are presented in Table 2. Preceding the simulation, computation on overland flow in the reservoir catchment was done.
Table 2. The scenario of the Fish Cage relocation from segment 8<sup>th</sup>
| Segment | The | |
|---|---|---|
| Scenari | for the | percentage of |
| О | relocatio | the relocated |
| n | fish cages | |
| A | Coomont | 20 |
| В | Segment 2nd | 50 |
| C | 2 | 100 |
| D | Comment | 20 |
| Е | Segment 3rd | 50 |
| F | 3 | 100 |
| G | Commont | 20 |
| Н | Segment Ath | 50 |
| I | 4 | 100 |
The shape of Jatiluhur reservoir is river like following the main river of Citarum. The reservoir is divided into segments that are equal in volume as shown in Figure 4. By dividing the reservoir into segments accordance to flow direction, the elongated reservoir may considered as completely mixed conditions for every segment. In other words, the applied model is based on horizontal segmentation across flow directions.
THE JATILUHUR RESERVOIR
Fish Cage in the Reservoir
The study area is Jatiluhur reservoir that diverts Citarum River. The function of the reservoir is water irrigation and electric generation. Since last decade, people cultivate fish in floating cages. The number fish cage grew 8673 units between March 2005 and August 2006 and at the current time it is more than 20000 units. As shown in Figure 5, the number of fish cages was still growing and Figure 6 shows the location or the fish cage. The reason of growth is that the fish production was very high as the quality of water was relatively acceptable for fish breeding. Moreover, the growth is stimulated by wrong notion that reservoir is a common property and it is an open access for everyone to utilize or take the benefit
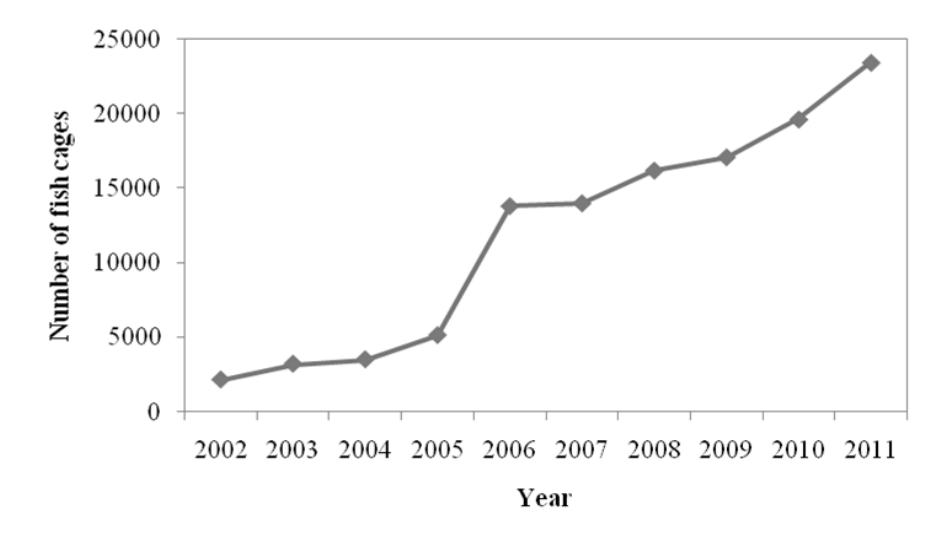
Figure 5. The growth of fish cage in Jatiluhur Reservoir
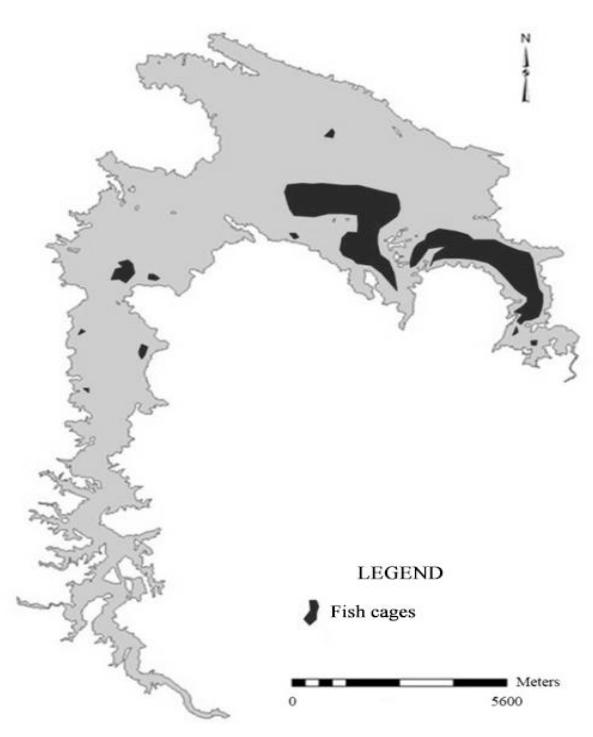
Figure 6. The location of Fish Cage in Jatiluhur Reservoir in Year 2009
The growth of fish cage impact the quality of water as the residue of fish pallet may reach 14.492.ton having nitrogen content 659.ton and phosphor 103.ton (Garno, 2002).
The Water Quality of Jatiluhur Reservoir
At the upstream of Citarum Catchment area, there are several activities such as domestic, fishery, agriculture, Cattle farm, and industry. Those activities, until the current time, contribute pollutants to the Citarum River as the main river of Jatiluhur reservoir. A brief figure on nitrate in Citarum river water is presented in Figure 7. In Java Island where the river is located, there are two season, i.e. Rainy season from October to April, and the rest is dry season as a period without rain. Figure 8 shows that during rainy season, nitrate concentration is high comparing to that during dry season. It is a common phenomenon in Java that overland flow swept away surface soil of agriculture areas to rivers raising Nitrogen in water.
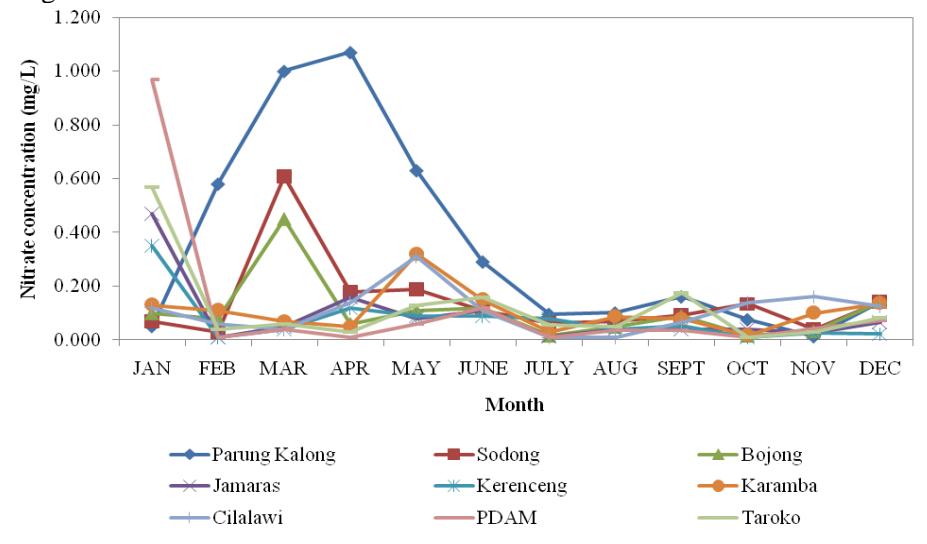
Figure 7. The Nitrate in Jatiluhur water during 2010 Source: PJT II, 2012
In general, the quality of Citarum water is low for raw water supply and even for fish breeding (Ilosangi, 2001). Moreover, measurement at 25 points along Jatiluhur reservoir done by Sukristiyanti et al. (2007), found that water turbidity at some points is around 0.3 – 11 NTU.
Further research found that it is caused by some activities at the upsream side and at the vicinity of the reservoir such as domestics, cattle farm, agriculture, and industry, and activity in the reservoir such as fish breeding in cages (Garno, 2003). In fact, fish breeding activity using fish cage raises the water fertility indicated by rising concentration of phosphorous, phytoplankton and sediment. The fish feed contain 4.86 percent nitrogen and 0.26 to 1 percent phosphorous (Nastiti et al., 2001). The excessive feeding may enrich nutrient in water that promotes algae and phytoplankton blooming.
It is estimated that those activities contribute 0.88 mg N/L and 0.06 mg P/L in which those amounts exceed the concentration to reach eutrophication process, i.e. 0.3 mg-N/L and 0.01 mg-P/L. Additionally, contribution from fish breeding activity is 3.1 ton-N/year and 128 kg-P/year (Abery et al., 2005). Nitrogen in nature is dominated by Nitrate as it is the most stable form comparing to Ammonia and Nitrite. Jong et al. (2009) estimated that pollution of Nitrate rise 2.3 percent annually. High Nitrate concentration may promote eutrophication and it will increase nuisance to water purification and machinery of electric generation, and agriculture products.
RESULTS AND DISUSSION
The computation on Nitrate concentration in the reservoir water begun from the estimation of overland flow on the catchment area. As the reservoir is divided into some segments, the existence of fish cages belongs to the segments. Relocation of the fish cages as set in the scenario is analyzed for its effects to Nitrate concentration in all segments.
The computation on overland flow using ISTFM as shown in Figure 9 shows that the overland flow fluctuates depending on the season of the year. In Java Island, there are rainy season from September to April and dry season from May to August. During dry season or time step 10<sup>th</sup> to 27<sup>th</sup> the overland flow is low comparing to that during rainy season or time step 28th to 36th This phenomenon is common as the amount of overland flow depends on the height of rainfall.
The amount of overland flow also depends on the surface land characteristics such as area and slope. The first segment is the largest as it is about 3440 ha, so the first segment receives large amount of overland flow. Similar phenomenon was also found by Sherif et al. (2011) that overland flow to a reservoir is large for large catchment area. In general, the slope of the catchment area is about 14 to 34 percent. Based on FAO classification (2006) the area is steep. Hopp and McDonnell (2009) stated that the surface slope determines the hydrologic response as the flow quickly rises in pace with the slope.
The fact shown in Figure 8 is that the overland flow is strongly under the influence of the area of the catchment rather than that of the surface land slope. This can be proved by comparing overland flow in segment 7<sup>th</sup> and that in segment 8<sup>th</sup>. The segment 7<sup>th</sup> is narrow and the land slope is steep or about 34 percent. While segment 8<sup>th</sup> is relatively flat in many parts and some area with 14 percent slope. The overland flow in segment 7<sup>th</sup> is lower than that in segment 8<sup>th</sup> The reason is the slope of the land is still belong in one classification of FAO so area is dominant in generating overland flow.
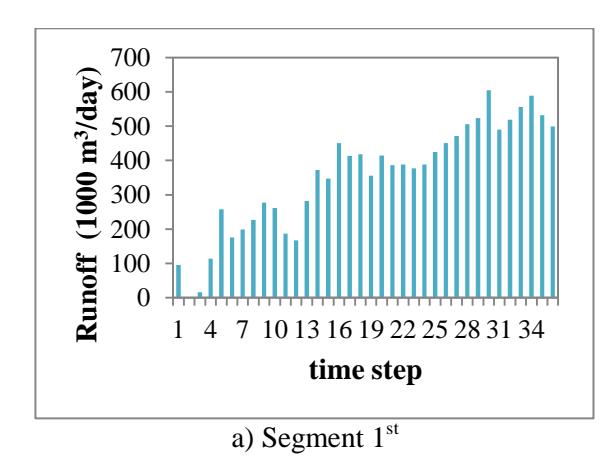
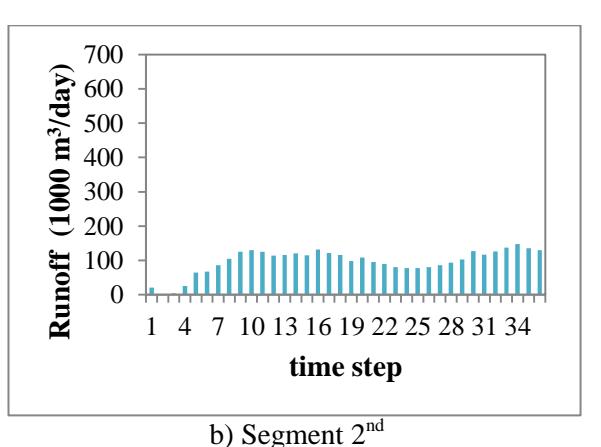
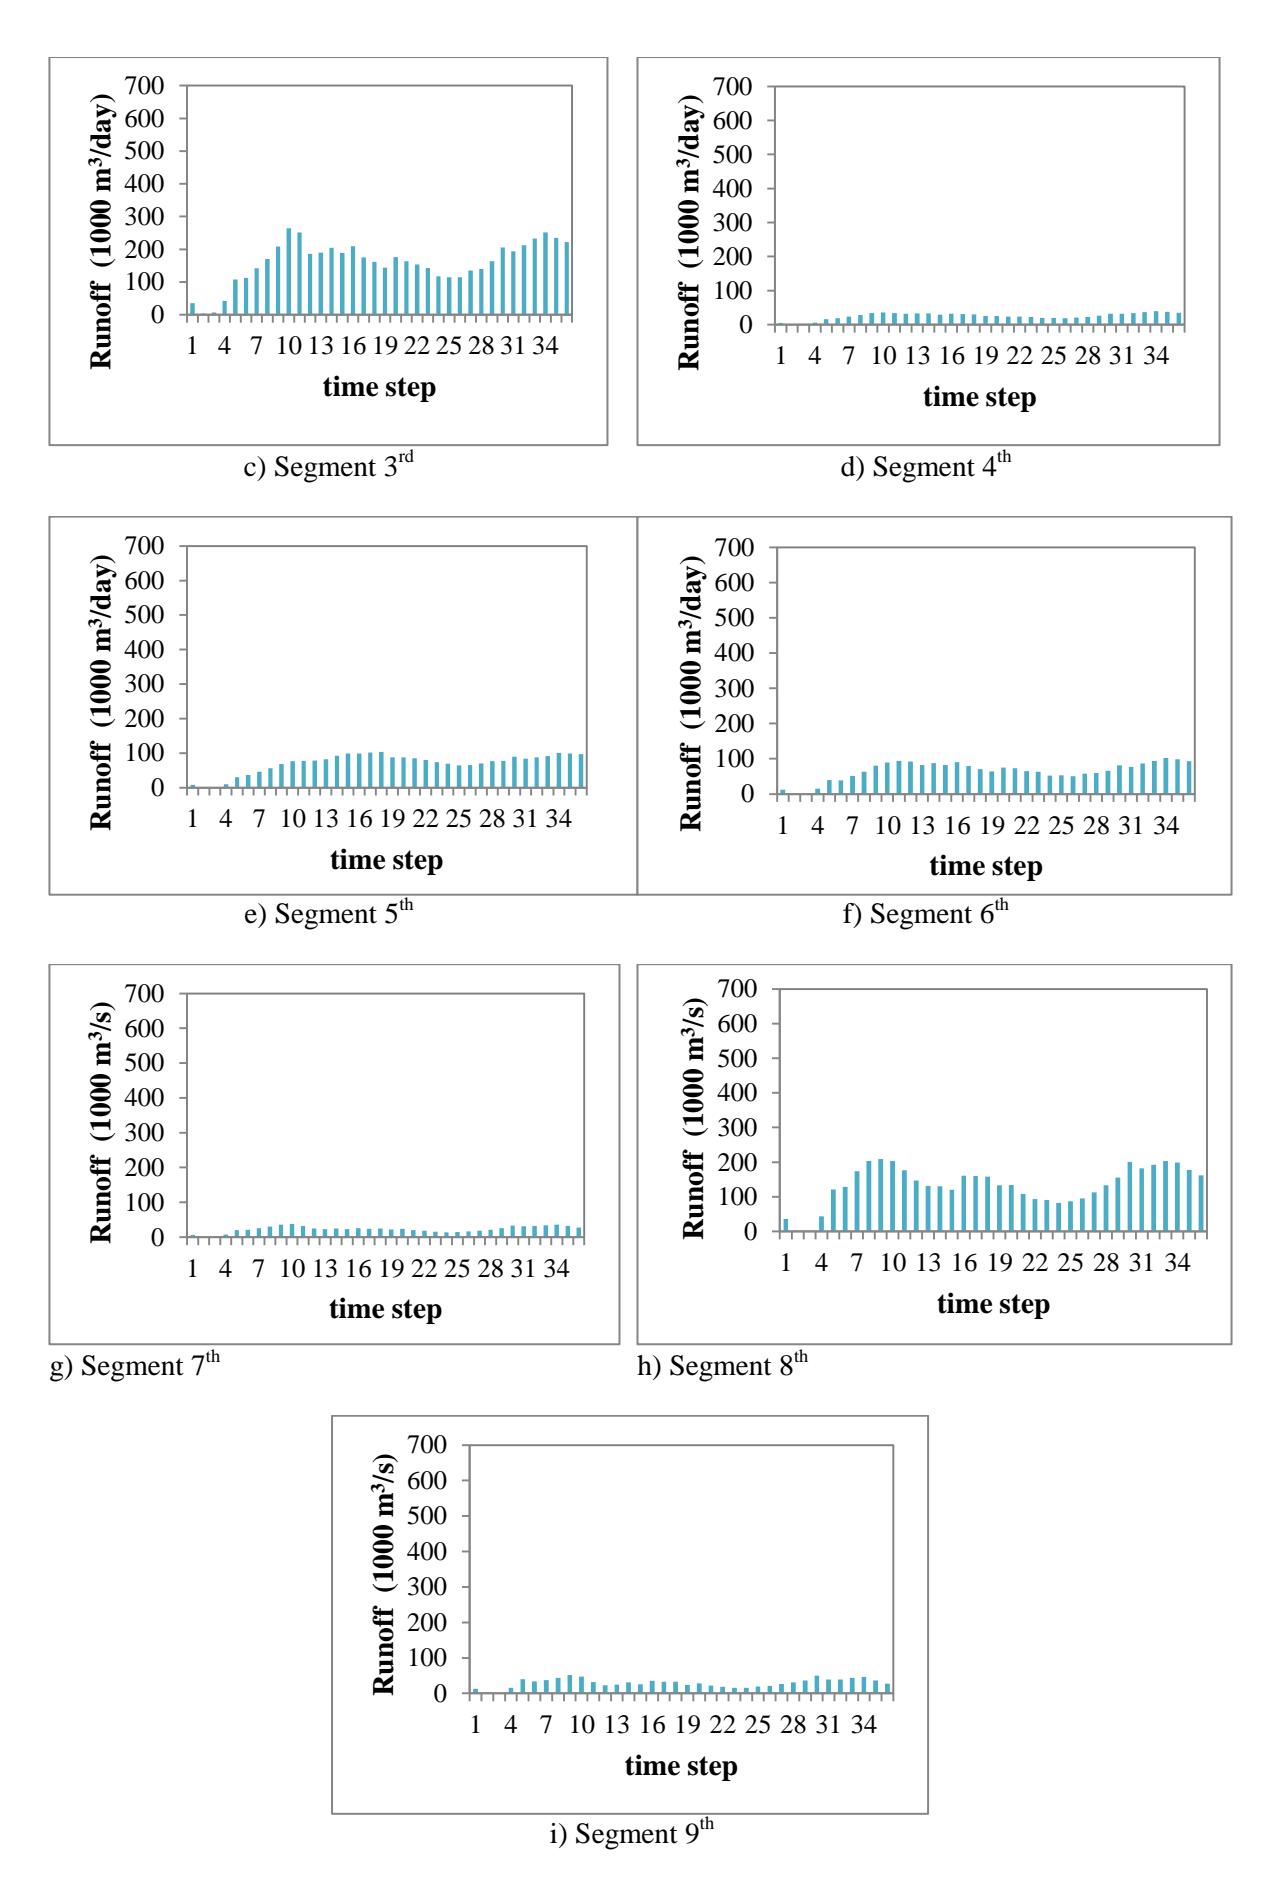
Figure 8. The overland flow on segments through the year
The overland flow leaches surface soil then some amount of soils containing nutrients are brought to the reservoir. The amount of nutrient depends mostly on the rainfall height or the amount of the overland flow. Addition to that, the amount of nutrient depends on the soil types, the agriculture activity, the surface slope, and the variation of land use (Chen et al., 2012). The amount of nutrient brought from agriculture lands is the most significant (Wu et al., 2012). Moreover agriculture practice using excessive fertilizer and compost from animal manure is the main source of nutrient (Carpenter et al., 1998). The rate of nitrogen up taken by plant cannot keep pace with the application of fertilizer that is usually excessive (Howarth et al., 2002). In the computation, the nutrient in the form of Nitrate in the overland flow is added to the nitrate that has already been in the reservoir at each segment. Even though, the amount of nitrogen in the overland flow is still very low comparing to that in the water of polluted Citarum River.
The result of computer simulation, shown in Figure 9, indicates that nitrate concentrations increase along way to the outlet zone of the reservoir. The decreasing nitrate concentration occurred at segment 3<sup>rd</sup> and 7<sup>th</sup>. The concentration of Nitrate is also temporally changes. The nitrate concentration at dry season is indicated by date 171-180, while during rainy season it is indicated by date 351-360. In general, the concentration during dry season is higher than that during rainy season. The reason is that during dry season the amount of pollutants conveyed by the main river remains high while the amount of water is fewer than the amount of water during rainy season. It is an indication that the additional nitrogen brought by overland flow to the river or directly to the reservoir is still smaller than the amount of nitrogen in the main river.
The temporal and spatial fluctuation of nitrate concentration is the consequence of the fluctuation of nitrogen discharge by internal and external sources. Internal source such as fish cage culture contributes huge amount of nitrogen in the residue of fish food and excretion of the fish. Internal source is also from bottom sediment although its quantity is difficult to be estimated. External source can come from overland flow at the surrounding reservoir. Li et al., (2012) investigated that the Nitrogen flux from agriculture lands can be 10 to 25 percent. Moreover, polluted Main River is the main source of nitrogen. In the reservoir the amount of nitrogen as well as sediment will settle to the bottom or it is transformed to other form within biochemical processes. The nitrogen cycle has been studied elsewhere.
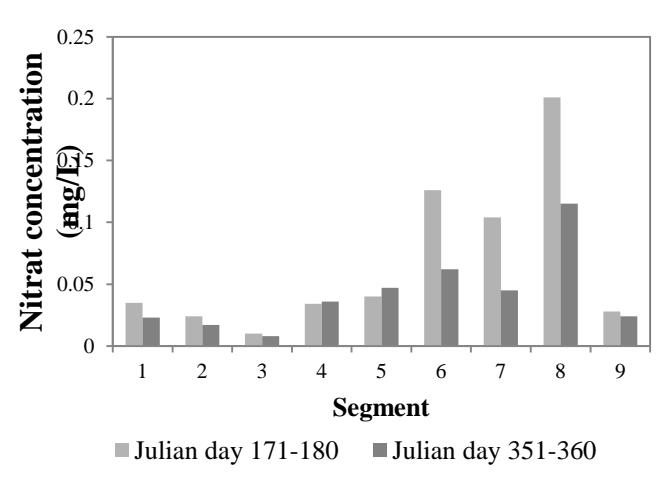
Figure 9. The average Nitrate concentration along the Jatiluhur reservoirduring 2010
The activity of fish culture in the reservoir increased especially during 2005 to 2006 or it was 168 percent as shown in Figure 10. The increasing number of fish cage directly raise nitrogen load as it had been estimated by Soemarwoto (2005). Furthermore, McDonald et al. (1996) stated that 30 percent of the fish food is not consumed by fish as it is swept away by the water current. The excretion of fish is about 25 to 30 percent of the consumed food. In order to understand how significant the impact of the fish cage to the nitrate increment in the reservoir, simulations without fish cage in the reservoir were also conducted.
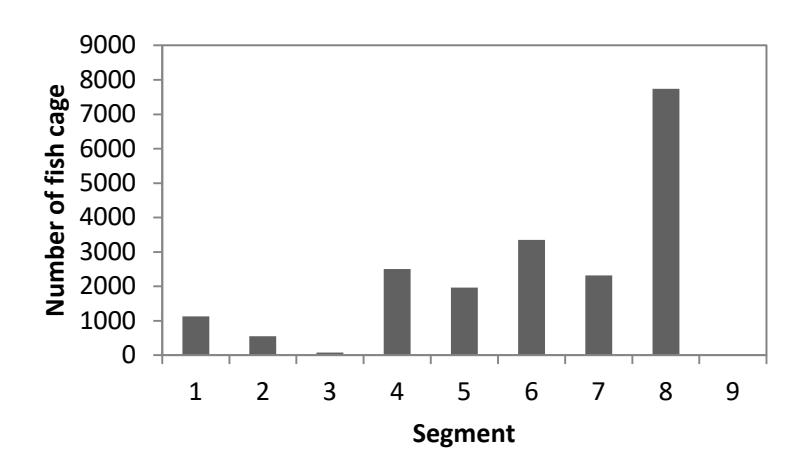
Figure 10. The number of fish cage in Jatiluhur reservoir during 2010
Simulations on Nitrate are shown in Figure. 11 (a) and 11 (b) for dry and rainy season respectively. In case there are no fish cages in the reservoir, the maximum nitrate concentration during dry season is 0.007 mg/l and during rainy season is 0.006 mg/l. In case the number of fish cages in the reservoir as it was in 2010, the concentrations of Nitrate shown in Figure 11(a,b) are that the maximum concentration of Nitrate during dry season was 0.201 mg/l and during rainy season was 0.115 mg/l. The maximum concentration of Nitrate was found in Segment 8<sup>th</sup> as the number of fish cages were the highest. The simulations conclude that fish cages contribute significant amount of nitrate in a reservoir.
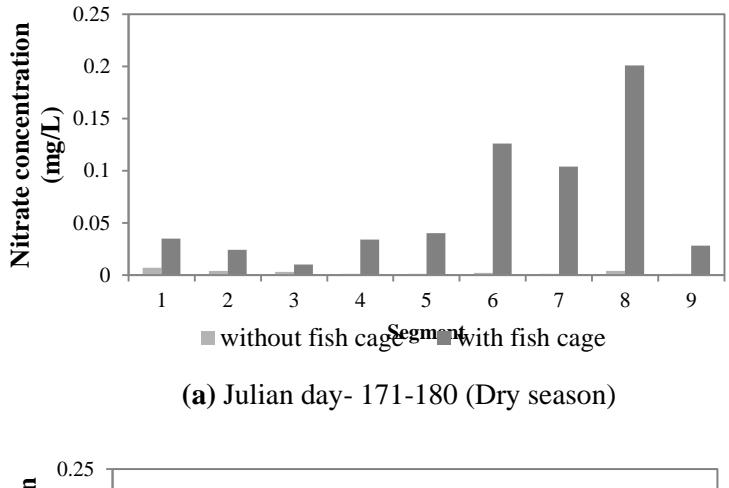
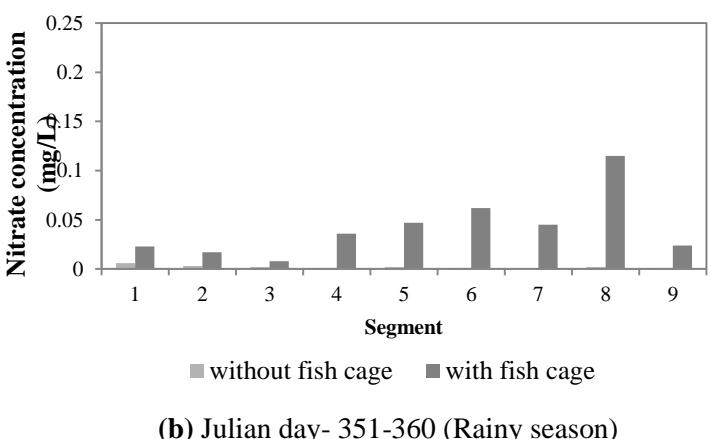
Figure 11. The simulated Nitrate concentration in case there is no fish cages, using data 2010
In the research, the effort to improve water quality will be done through relocation of fish cages to upstream segments. As the highest number of fish cage is in segment 8th, they will be moved to segment 2<sup>nd</sup>, 3<sup>rd</sup>, or 4<sup>th</sup> as shown in Figure 12. The relocated fish cages in the scenario will be 20, 50, and 100 percent.
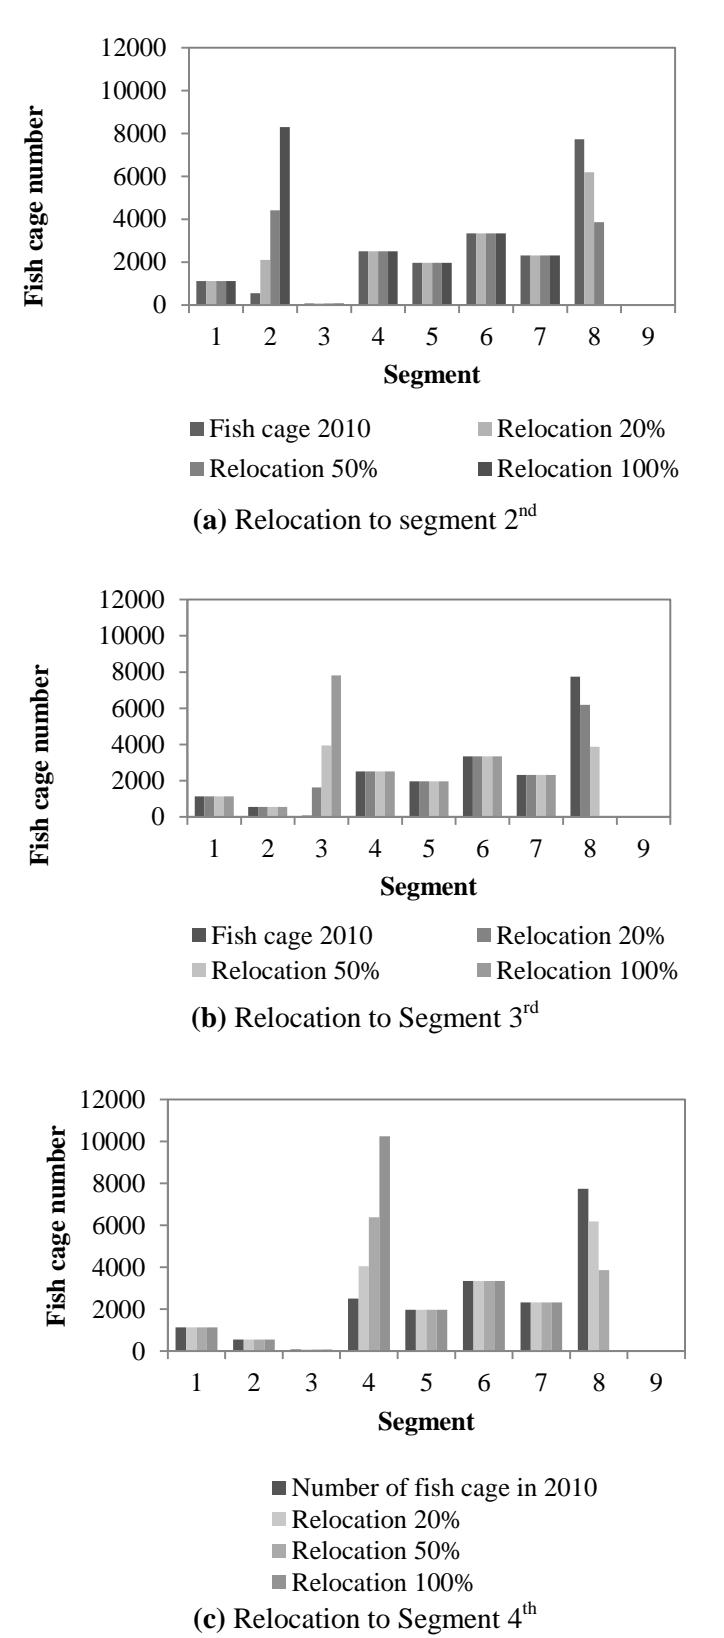
Figure 12. The number of Fish cage relocated from Segment 8<sup>th</sup> in 2010
The estimated amount of Nitrate from fish cage activity depends on the number of fish cage. The Nitrate added to the targeted segment is 2.1 ton/day, 5.26 ton/day, and 10.52 ton/ day for relocation 20 percent, 50 percent, and 100 percent respectively. Consequently, the increment of nitrate concentration in segment 2<sup>nd</sup> is 1.40 percent, 3.49 percent, and 6.98 percent in case the number of fish cage from segment 8<sup>th</sup> is 20 percent, 50 percent, and 100 percent respectively as shown in Figure 13(a). Similarly, the increment of nitrate in segment 3<sup>rd</sup> is 2.86 percent, 7.17 percent, and 14.35 percent as shown in Figure 13(b). The same pattern is also happen for segment 4<sup>th</sup> these are 0.57 percent, 1.43 percent and 2.86 percent as shown in Figure 13(c). In case the indication of the increment of nitrate concentration is in percentage, the results can be confusing as the percentage is the comparison of the concentration to the measured data. In general, the Nitrate concentrations at the targeted segments increase proportional to the number of fish cage received. While the Nitrate concentration of the origin segment or segment 8<sup>th</sup> reduces by the amount proportional to the removed fish cages.
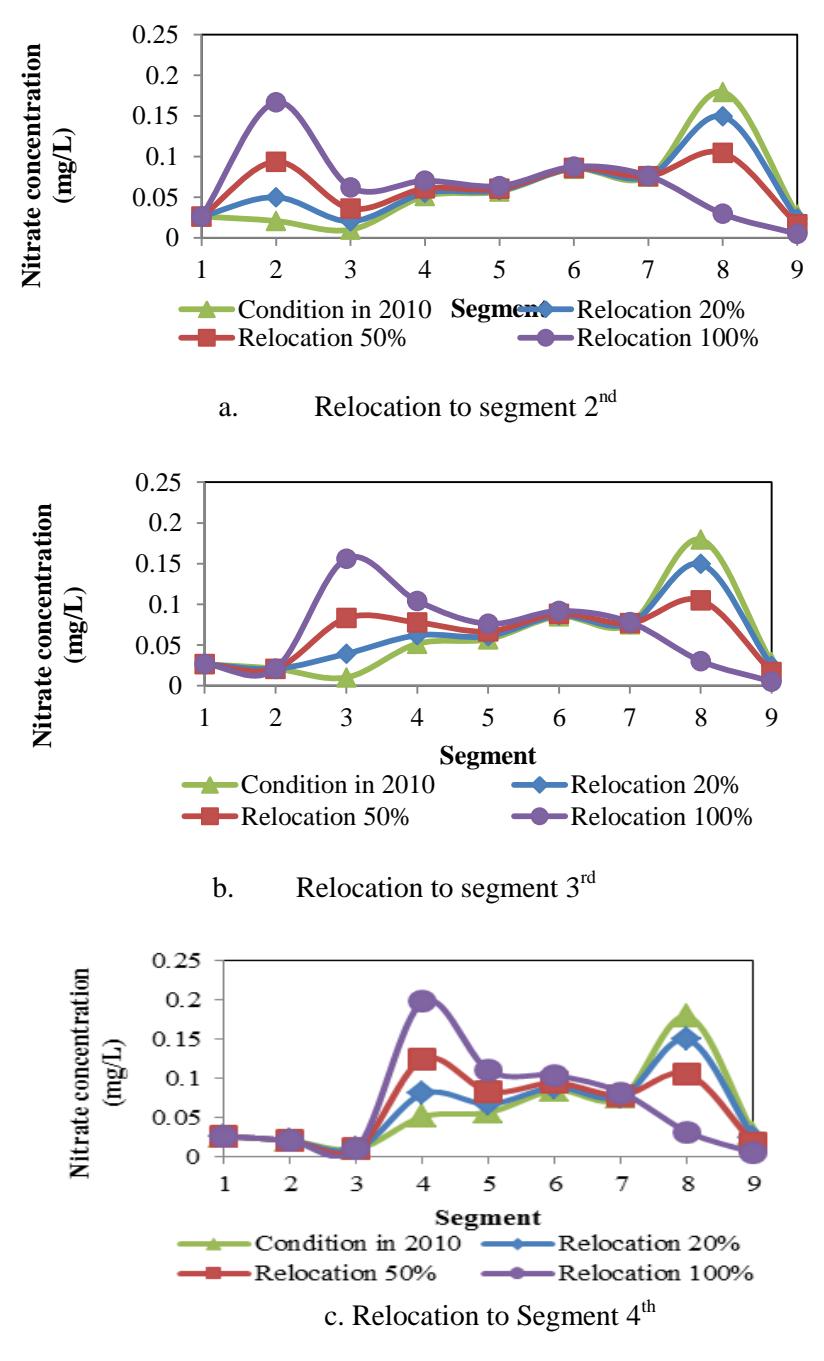
Figure 13. The Nitrate concentration caused by relocation of fish cage from segment 8<sup>th</sup>
The dynamicity of the Nitrate concentrations at the outlet zone or at the 9th segment as the consequent of relocating the fish cage is presented in Figure 14. It is shown that the Nitrate concentrations reduce corresponding to the number of concentration in 8th segment. In case the 8th segment is free from fish cages, the Nitrate concentration is close to the situation where the reservoir is totally absent from fish cage. It means that fish cage is the main source of Nitrogen in the Jatiluhur reservoir. As long as fish cages are still exist in segment 8th, the nitrate concentration in segment 9th is still high.
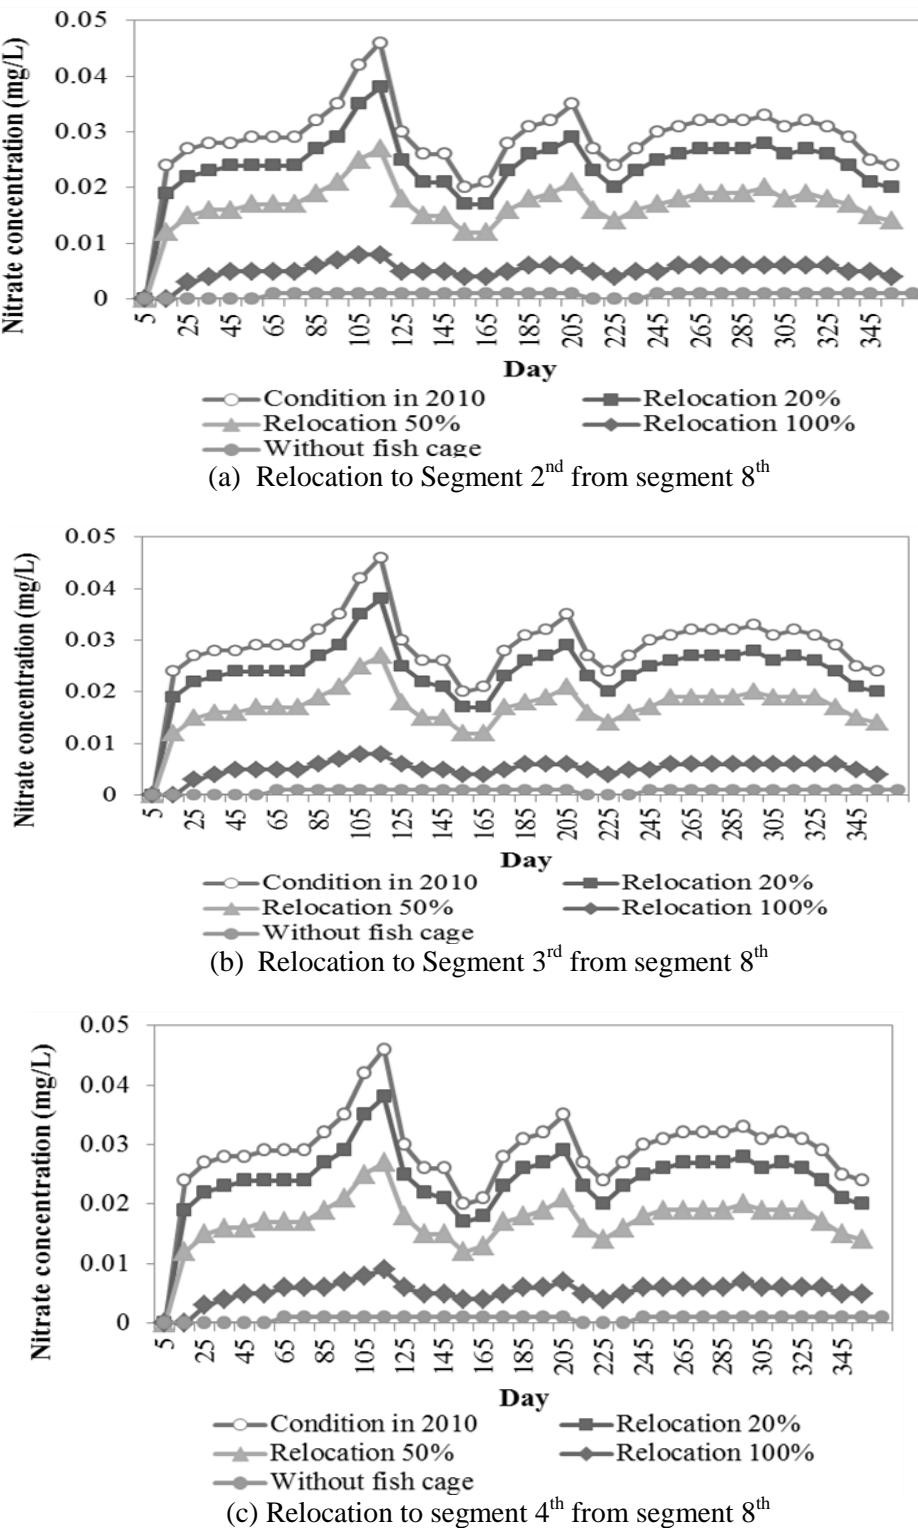
Figure 14. The Nitrate concentration at the outlet zone
The reductions of nitrate concentration in the last segment or 9<sup>th</sup> segment (the segment at the outlet zone) caused by relocating the fish cage to 2<sup>nd</sup>, 3<sup>rd</sup>, and 4<sup>th</sup> segment are presented in Figure 15. The figure shows that relocating 20 percent of the fish cage from segment 8<sup>th</sup> (scenario A, D, and G) reduce 16.5 to 16.7 percent nitrate concentration. In case the relocation is 50 percent, the reduction of nitrate concentration is 40.9 to 41.5 percent (scenario B, E, and H). In case all fish cages are relocated, the reduction of nitrate concentration is 81.5 to 82.4 percent (scenario C, F, and I).
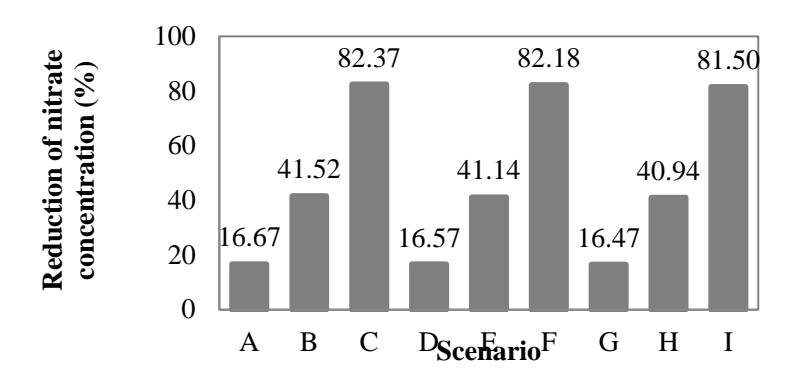
Figure 15. The percentage of nitrate reduction for several scenarios of fish cage relocation
In other words, it can be stated that the reduction of nitrate concentration in the outlet zone is not significantly under the influence of the location of the received segment, but the number of relocated fish cage seems to be important. Scenario C, F, and I are the conditions resulted by relocating all fish cages from outlet zone to \(2^{nd}\), \(3^{rd}\), and \(4^{th}\) segment respectively.
CONCLUSION
It was found that the highest increment in nitrate concentrations were in the outlet zone where the number of fish cages in the reservoir is the highest. To improve the water quality of the reservoir, especially in maintaining its function as a hydroelectric power plant, provider of raw drinking water and agricultural irrigation, water quality improvement is carried out by the fish cage relocation from the fish cage congested segment to upstream segments further away from the outlet zone. The simulation results obtained that the maximum reduction of nitrate concentration can be reached when all fish cages were relocated from the outlet zone. After relocating the fish cages close to the inlet zone as much as 20 percent, 50 percent, and 100 percent, the calculated reduction of nitrate concentrations in the last segment of the reservoir are 17 percent, 42 percent, and 83 percent respectively. Relocations to segment little bit upstream closer to the targeted segment produce less reduction of Nitrogen. It indicates that significant reduction by biochemical processes is under the influence of time of flows. In other words, in elongated reservoir the reduction of nitrate concentration is significant in accordance with the number of relocated fish cage and the distance upstream from the origin of the cage location.