
INTRODUCTION
Population growth caused the global warming from the daily activity of fossil fuel burning to provide the energy supporting. In this recent year, the level of greenhouse gas has increased noticeably. Due to the decline of current fossil fuel, numerous researches have been seeking for the environmental friendly technologies to produce bioenergy including physical, chemical, and biological process. Three type of organic matter including; sugar, starch, and lignocellulosic material which contains of carbohydrate was found as a source of bioethanol and another product (Somda et al., 2011). Using ethanol as fuel is given 15% greater combustion efficiency compared to gasoline due to the oxygen content in ethanol is about 34.7% (Zabed et al., 2016). Anaerobic digestion is one of the biological processes which are feasible to convert organic matter into bio energy such as bio-methane, bi-hydrogen, bioethanol, or other product from the different pathway as well in the absence of oxygen. This process was considered as the less energy consuming process to produce other energies. This process consists of four main stages: hydrolysis, acidogenesis, acetogenesis, and methanogenesis (Vögeli et al., 2014 and Nugroho et al., 2007). Palm oil mill effluent (POME) is the wastewater from the extraction of crude palm oil contained of various type of organic matter which can be used as a substrate to convert into energy. Bioethanol is produced during the acidonegic stages when other products can be formed as volatile fatty acids including acetic acid, butyric acid, propionic acid, valeric acid, carbon dioxide, and hydrogen gases through two different fermentations are butyric-type fermentation and propionic-type fermentation (Kuruti et al., 2015 and Juang et al., 2011). There are many factors affects to the end-products from the fermentation pathway such as: pH, substrate, temperature, organic loading rate, particularly, pH is one of the important factors significantly influence to the products by the influence on microorganisms activity including consumption of energy and carbon source, substrate degradation, nutrients and many types of materials (Zhen et al., 2004 and Infantes et al., 2012). Under acidic, neutral, and alkaline pH condition have been studied and showed different result of bioethanol concentration.
The objectives of this research aim to identify the effect of pH using artificial wastewater as a substrate to optimize the production of ethanol from POME. Using microorganism taken from cow rumen and batch experiments was conducted. Substrate degradation and bioethanol formation kinetics have been studied along with products yield and production rate.
MATERIALS AND METHODS
Culture Medium
There are two main substrate were used in this research study such as artificial wastewater and palm oil mill effluent (POME). The artificial wastewater derived from various types including starch (8.4 g/L), peptone (3 g/L) and other nutrients. POME is the main substrate was taken from the palm oil industry with the characteristic as shown in the Table 1.
Microorganisms
Microbe was obtained from the cow rumen which taken from cow slaughterhouse located in Bandung city and mixed with microbe taken from palm oil mill sludge in Garut, Indonesia. Mixture microbe was grown in batch culture by seeding process using palm oil mill effluent (POME) as a substrate. The seed reactor consisted of 20% (v/v) microbe from cow rumen, 20% (v/v) from palm oil mill sludge, and 60% (v/v) of POME. Microbe was prepared and used as seed microorganism in batch reactor to observe the growth by analyzing volatile suspended solid every two days until the growth reached stationary phase (Khalseh, 2016).
Table 1. Characteristic of palm oil mill effluent (POME) wastewater
| Parameter | Result |
|---|---|
| pH | 4.35 |
| tCOD (mg/L) | 13,000-15,000 |
| sCOD (mg/L) | 4,900-6,500 |
| BOD (mg/L) | 6,000-8,000 |
| TVA (mg/L) | 3,000 – 3,500 |
| VSS (mg/L) | 99-315 |
| TSS (mg/L) | 110-350 |
| oil and grease (mg/L) | 150-200 |
| Ethanol (mg/L) | 1,500-2,000 |
| TN (mg/L-N) | 100-200 |
Batch Fermentation
Bioreactor (Figure 1) used in this study is a batch reactor with working volume of five liters contained of four liters substrate and one liter of microbe. Nitrogen purging 1L/min was involved during the first 24 hours to remove the oxygen content in the headspace of the reactor. After nitrogen flushing, internal biogas circulation was replaced as a mixing system from the top to the bottom of the reactor. The Reactor contained of 80% (v/v) substrate from wastewater and 20% (v/v) mixture culture of microbe.
Figure 1. Batch bioreactor for ethanol fermentation
Analytical Methods
Samples were taken from the reactor every 6 hours and analyzed for ethanol, tVFAs, pH, VSS, and sCOD for 72 hours of the experiment. Ethanol and total volatile fatty acids (tVFAs) were analyzed using High Performance Liquid Chromatography (HPLC) (Handajani et al., 2016). Sample was prepared by filtering the previous sample using acrodisc nylon syringe Millipore filter size of 0.22µm. HPLC used the type of interface Hitachi D-7000 HSM which is equipped with UV-Vis detector (Hitachi L-7400) and a pump (Hitachi L-7100). Analytical column was C 18 for ethanol analysis and Aminex HPX-87H (300 mm × 7.8 mm) for tVFAs analysis. The mobile phase of ethanol consisted of eluent, acetate, and methanol and for tVFAs with 5 mm
H<sub>2</sub>SO<sub>4</sub>, methanol, and aqueous. The operation condition was in temperature of 55°C, flow rate of 1 mL/min, injection volume of 1 mL. Detection of acetate, propionate, butyrate, and valerate used UV-Vis at a wavelength of 210 nm. The concentrations for calibration curve were 50, 75, 100, and 200 nM. pH, VSS, and sCOD were analyzed using pH meter, SM 2540E and SM 5220C method according to the standard methods (Clesceri, 1998).
Calculation
Modified Gompertz Model (Equation 1) was able to describe the product (ethanol) formation as the fermentation proceeded (Tussanee et al., 2015) and therefor selected for this study.
\[P = P_m \cdot \exp\left\{-\exp\left[\frac{r_{p,m} \cdot \exp(1)}{P_m}\right] \cdot (t_L - t) + 1\right\}\] (1)
Ethanol production yield (Equation 2) and tVFAs yield (Equation 3) were determined as the maximum amount of each product divided by the amount of substrate utilized as SCOD (Bengtsson et al., 2008). Ethanol production rate (Equation 4) and tVFAs production rate (Equation 5) were determined as the maximum of each product divided by processing time (Tussanee et al., 2015).
\[Y_{etha}\], \((g/g) = \frac{\text{Maximum ethanol concentration } (g/l)}{\text{Total utilised substrate as COD } (g/l)}\) (2)
\[Y_{tVFAs}\], \((g/g) = \frac{\text{Maximum acids concentration } (g/l)}{\text{Total utilised substrate as COD } (g/l)}\) (3)
\[r_{p,etha}\] (g/L/hr) = \(\frac{\text{Maximum ethanol concentration (g/L)}}{\text{Fermentation time (h)}}\) (4)
\[r_{p,tVFAs}\] (g/L/hr) = \(\frac{\text{Maximum acids concentration (g/L)}}{\text{Fermentation time (h)}}\) (5)
RESULT AND DISCUSSION
Artificial Wastewater
Artificial wastewater was used and diluted into three different initial COD concentration (10, 15, 20 g/L) and operated by different pH conditions (5.5, 6.5-7.5, 8.5) to preserve the concentration of ethanol from the fermentation process. The result of ethanol production was shown as in the Figure 2.
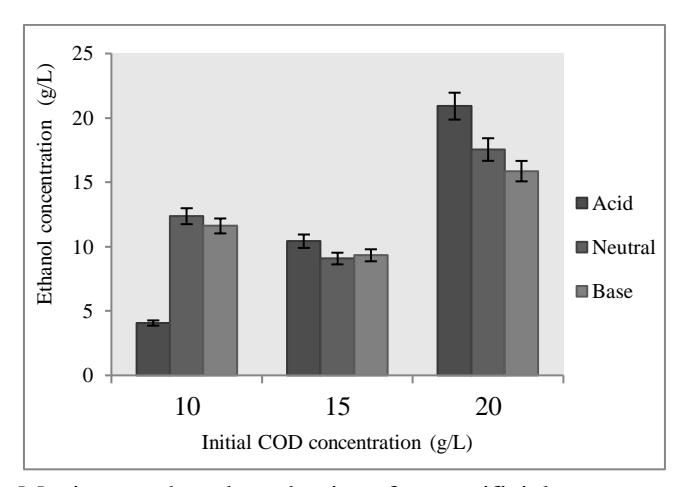
Figure 2. Maximum ethanol productions from artificial wastewater at different pH
When the initial COD concentration started from 10 g/L, the optimum ethanol production obtained in the neutral condition with the concentration of 12.36 g/L and in basic and acidic condition were 11.6 and 4.06 g/L, respectively. With the initial COD concentration of 15 g/L, the maximum ethanol production produced in the acidic condition with the concentration of 10.41 g/L, while in basic and neutral condition produced ethanol of 9.32 and 9.07 g/L, respectively. Otherwise, using artificial wastewater with COD concentration of 20 g/L, the ethanol production reached the maximum concentration of 20.91 g/L while in neutral and basic condition got 17.54 and 15.86 g/L, respectively.
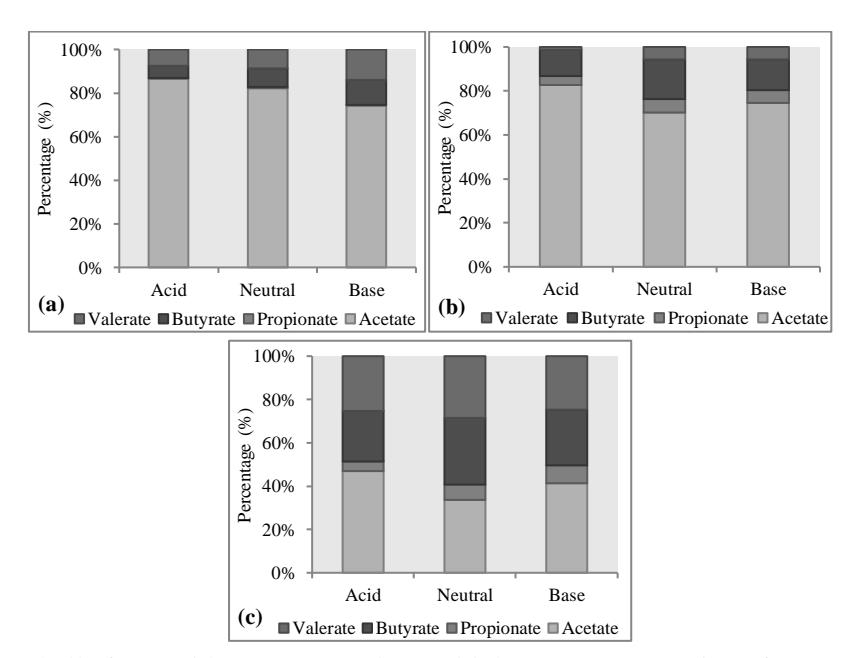
Figure 3. Volatile fatty acids type proportion (Initial COD concentration of (a) 10 g/L, (b) 15 g/L, and (c) 20 g/L)
The results of volatile fatty acids were found acetate was the major product compared to propionate, butyrate, and valerate as shown in the Figure 3 above. From the lower COD concentration (Figure 3a & 3b), the percentage of acetate obtained of more than 70% of the total VFAs. From the initial COD concentration of 20 g/L, acetate, butyrate and valerate were found by different pH condition in a comparable amount (Figure 3c).
Palm Oil Mill Effluent
Characterizing of POME wastewater found that COD was about 15,000 mg/L, according to the optimum condition of artificial wastewater, the initial pH operation was adjusted to 5.5 and preserved the product formation during the fermentation process. Ethanol concentration using POME as a substrate was shown as in the Figure 4.
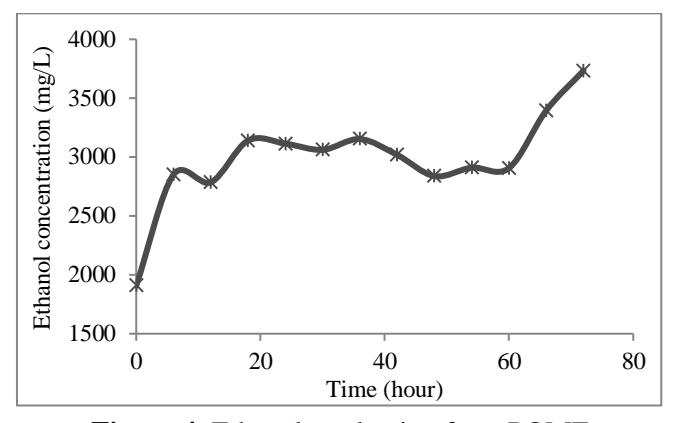
Figure 4. Ethanol production from POME
Ethanol started from the initial concentration of about 1,900 mg/L and increased rapidly to 3,140 mg/L at 18 hours then fluctuated until 36 hours with the concentration of 3,153 mg/L. Ethanol concentration dropped down after 36 hours to about 2,907 mg/L at 60 hours then rose steeply to the maximum concentration of ethanol of 3,734 mg/L. This trend seems the ethanol concentration still increase with the longer time of the fermentation process.
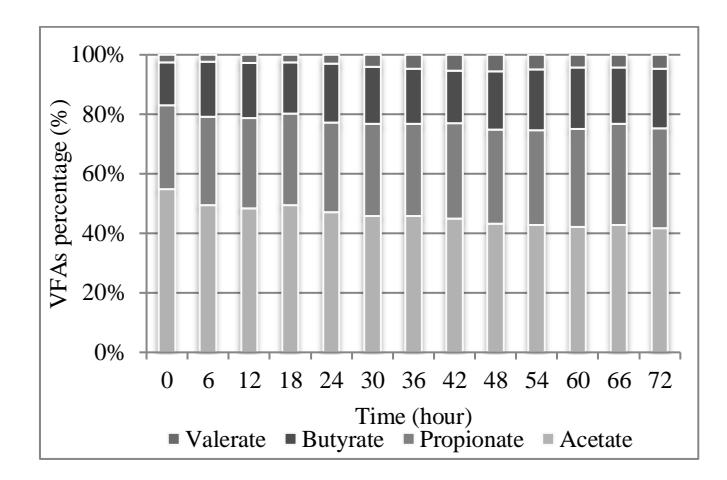
Figure 5. Volatile fatty acids compositions concentration from POME
Production of VFAs from POME (Figure 5) has shown that acetate was the major product with the initial concentration of about 2,500 mg/L and dropped down at the first 6 hours to 2,000 mg/L then started to increase slightly resulting of pH drop. Acetate decreased slowly which could cause accumulation of ethanol. Abubackar et al., (2016) found that the interesting observation and conclusion from the experiment, that was used for the next studies, is that during the initial period of the experiment with no pH regulation and thus pH increase, biomass build-up took place and acids were produced; while maintaining a low, constant pH during the remaining part of the study allowed to completely convert the accumulated acetic acid to alcohols. Since the accumulation of acetate and propionate accounted of more than 70% among the VFAs products, this process was considered as propionic type fermentation with no significantly gas production (Juang et al., 2011).
Table 2. Result of modified Gompertz model
| Initial COD (g/L) | pH | Pm (g/L) | rp,m (mg/L/hr) | tl (hr) |
|---|---|---|---|---|
| 10 | 6.5-7.5 | 12.36 | 171.70 | 24 |
| 15 | 5.5 | 10.41 | 144.70 | 12 |
| 20 | 5.5 | 20.91 | 290.44 | 12 |
| POME | 5.5 | 3.73 | 51.87 | 1 |
The products formation result obtained from the Modified Gompertz model for the optimum condition using artificial and POME given as shown in the Table 2.
Table 3. Ethanol and total volatile fatty acids yield and production rate
| Initial COD (g/L) | pH | Ethanol yields (g/g) | Ethanol production rate (mg/L/hr) | Acids yields (g/g) | Acids production rate (mg/L/hr) |
|---|---|---|---|---|---|
| 10 | 5.5 | 2.90 | 56.45 | 3.90 | 75.85 |
| 6.5-7.5 | 7.34 | 171.70 | 3.27 | 76.59 | |
| 8.5 | 12.44 | 161.20 | 6.19 | 80.24 | |
| 15 | 5.5 | 4.74 | 144.71 | 1.09 | 33.37 |
| 6.5-7.5 | 8.51 | 126.02 | 1.65 | 24.44 | |
| 8.5 | 4.00 | 129.53 | 0.95 | 30.67 | |
| 20 | 5.5 | 3.11 | 290.44 | 0.38 | 35.42 |
| 6.5-7.5 | 2.77 | 243.65 | 0.25 | 22.24 | |
| 8.5 | 1.89 | 220.34 | 0.22 | 26.23 | |
| POME | 5.5 | 1.93 | 51.87 | 2.34 | 62.95 |
From the artificial wastewater (10, 15, and 20 g/L of COD), ethanol yields (g/g) from the optimum condition given the result 7.34, 4.74, and 3.11 and the ethanol production rate (mg/L/hr) were 171.7, 144.71, and 290.44, respectively. For the volatile fatty acids product, in the optimum condition VFAs yields (g/g) were 3.27, 1.09, and 0.38, respectively. The VFAs production rates (mg/L/hr) were 76.59, 33.37, and 35.42, respectively. The performance of starch fermentation for ethanol production from the previous studies has shown different result of product yield and production rate. Liu & Lien, (2016) found that using potato and cassava startch without any pretreatment process using A. awamori, R. juponiaus/Z. Mobilis obtained the yield of 0.5 and 0.47 g/g, and the production rate of 1.18 and 0.85 g/L/hr, respectively.Using POME as a substrate, the ethanol yield was 1.93 g/g and production rate was 51.87 mg/L/hr while the VFAs yield was 2.34 g/g and VFAs production rate was 62.95 mg/L/hr, relatively higher than ethanol did (Table 3).
Table 4. First order reaction of the sCOD degradation from artificial wastewater and POME
| Initial COD (g/L) | pH | Rate constant kh | 2 R |
|---|---|---|---|
| 5.5 | 0.0072 | 0.61 | |
| 10 | 6.5-7.5 | 0.01 | 0.8 |
| 8.5 | 0.0066 | 0.62 | |
| 5.5 | 0.0184 | 0.9 | |
| 15 | 6.5-7.5 | 0.018 | 0.91 |
| 8.5 | 0.016 | 0.95 | |
| 5.5 | 0.02 | 0.97 | |
| 20 | 6.5-7.5 | 0.021 | 0.97 |
| 8.5 | 0.023 | 0.92 | |
| POME | 5.5 | 0.0051 | 0.765 |
Substrate degradation as soluble COD during the fermentation time was plotted using inverse of concentration versus time giving the straight line where the slop is the rate constant of first-order kinetic. The correlation coefficients (R 2 ) of each pH operation with different initial concentration have been shown in the Table 4. A plot of logarithm of substrate concentration as sCOD versus time (hour) is a straight line with slope (-kh) which can be implied the reaction rate of the reactant in the batch reactor.
CONCLUSION
Through the operation of pH on artificial wastewater, the ethanol productions were obtained maximum in neutral condition with 10 g/L of initial COD concentration, and acidic condition from 15 g/L and 20 g/L with the concentration of 12.36 g/L, 10.41 g/L, and 20.91 g/L, respectively. POME was adjust the pH into acidic condition (pH 5.5), the appropriated condition, since the concentration of COD was about 15 g/L. The maximum ethanol production from POME obtained 3.73 g/L from the fermentation process of 72 hours. Ethanol yield and production rate from POME were 1.93 g/g and 51.87 mg/L/hr, respectively and total volatile fatty acids yield and production rate from POME were 2.34 g/g and 62.95 mg/L/hr, respectively.
ACKNOWLEDGEMENT
The project was financed by the AUN/SEED-Net scholarship which is supported by the Japanese Government through JICA and partially supported by ASEAN foundation. Authors wish to thank the Water Laboratory of Department of Environmental Engineering, Bandung, Indonesia for the technical help during the experiments.