
INTRODUCTION
The downstream segment of Citarum River starts at Bendung Curug, Karawang Regency and ends at Muara Gembong, Bekasi Regency. Citarum River is included in the category of heavily polluted rivers (KLHK, 2016). Pollution of the river can cause a decrease in water quality. The decline in water quality of Citarum River occurs due to water pollution by industrial and domestic waste discharges that enter the river (KLHK, 2016). Water pollution is the release of all liquids, solids, gases, pathogenic organisms or other substances into the water which will cause the water to be disrupted and become dangerous for the health, safety or welfare of the community and the environment. Water pollution usually comes from human activities such as manufacturing, agriculture, mining, and poor waste management (Masere et al, 2012).
Water pollution occurs when unwanted wastes are spread in the water system so that the water quality changes (Alrumman et al, 2016).
River pollution is defined as a change in the quality of a waters due to human activities, which in turn will disrupt the lives of humans themselves or other living things. These changes can be caused by compounds that enter the river flow that moves downstream along with the water flow or are stored at the bottom, accumulating (especially on sediment) and someday there can also be washing or dilution. These compounds (mainly toxic) accumulate and become a certain concentration which is harmful to the life chain Patricia et al, 2018). Source of river pollution can be classified into point source and non-point source. Point sources refer to sources with discharges entering water bodies in certain locations such as through pipes such as discharges from industry, domestic, and wastewater treatment plants. While non-point sources come from scattered sources such as agricultural activities and runoff water (Afroz et al, 2017).
Pollutant load is the amount of a pollutant contained in water or wastewater. Pollution burden is essentially the amount of pollutant mass in a body of water in a certain period. Pollutant load is expressed in units of pollutant load per unit time (Komarudin, et al, 2015). Pollutant loads entering the downstream segment of Citarum River comes from domestic activities, industry, agriculture, restaurants, hotels, shopping centers, and hospitals. The high load of pollutants entering the river body can reduce the capacity of pollutant load (DTBP) of the river. The purpose of this study is to analyze the pollutant load capacity (PLC) using QUAL2Kw model.
PLC calculation can not be done directly because of the complexity of the factors that influence it, therefore modeling methods are used to simplify this complexity (Komarudin, et al, 2015). The QUAL2Kw model is one method of calculating the pollutant load capacity by making a model in which this model is based on simplifying conditions in the field. (Sara, 2018). QUAL2Kw is a model adapted from the QUAL2K model developed by Dr. Steven C. Chapra from Tufts University (Chapra and Pelletier, 2003). QUAL2Kw is a surface water quality model, one-dimensional, steady state (more specifically a stable flow model because the flow is assumed to be stable but water quality is calculated dynamically with water quality kinetics and heat balance) and implemented in a Microsoft Windows environment (Kannel et al, 2011).
QUAL2Kw can simulate a number of water parameters such as temperature, pH, BOD, COD, dissolved oxygen, organic nitrogen, ammonia nitrogen, nitrite and nitrate nitrogen, organic phosphorus, inorganic phosphorus, total nitrogen, total phosphorus, total phytoplankton and bottom algae (Kannel et al, 2007).
RESEARCH METHOD
Location and Time of Study
This research was conducted in 6 months from February upto July 2019 in downstream segment of Citarum River starting from segment 16 located at Jl. Demang, Karawang Regency upto segment 20 in Muara Gembong, Bekasi Regency. Sampling is done twice at each location using grab sampling method for 3 observation periods (March, April and June 2019) at 11 water quality monitoring points consisting of 10 main river points and 1 tributary point. The parameter analyzed were BOD, COD, nitrate and phosphate.
Table 1. The Monitoring Locations of The Water Quality
| Point | Location of Monitoring | Coordinate Point | ||
|---|---|---|---|---|
| EL | SL | |||
| 1 | Jl. Demang, Karawang | 107°22'06,8" | 6°24'44,6" | |
| 2 | Jl. Rumambe I, Karawang | 107°19'28,3" | 6°21'45,1" | |
| 3 | Jembatan Teluk Jambe, Karawang | 107°18'43,3" | 6°19'36,8" | |
| 4 | Jembatan Tarumanagara, Karawang | 107°17'16,4" | 6°17'54,7" | |
| A | Labansari, Cikarang Timur, Bekasi (point source) | 107°15'54,1" | 6°16'56,2" | |
| 5 | Jl. Raya Proklamasi, Karawang | 107°16'34,7" | 6°14'57,0" | |
| 6 | Jl. Raya Pebayuran, Bekasi | 107°16'21,4" | 6°13'10.9" | |
| 7 | Jl. Raya Tugu Proklamasi, Rengasdengklok, Karawang | 107°17'14,1" | 6°09'24,9" | |
| 8 | Jl. Teluk Bango, Karawang | 107°12'31,7" | 6°05'52,1" | |
| 9 | Jl. Raya Pakisjaya, Karawang | 107°07'22,3" | 6°02'50,2" | |
| 10 | Muara Gembong, Bekasi | 107°02'38,7" | 5°59'04,5" | |
Pollutant Load Capacity Analysis
Analysis of pollutant load capacity in downstream segment of Citarum River was carried out using the QUAL2Kw model developed by Dr. Steven C. Chapra. Water quality modeling of downstream segment of Citarum River is divided into 9 reach from the point of 108.5 km at Jl. Demang, Karawang to the point of 0 km in Muara Gembong, Bekasi Regency. The distribution of reach is based on the physical condition of the river, the presence of pollutant sources both point source and non-point source that is suspected to have a major impact on changes in the quality and quantity of the downstream segment of the Citarum River can be seen in Table 2.
In this modeling, the shape of the downstream segment of Citarum River is considered square, the water quality parameters being modeled are BOD, COD, nitrate, and phosphate, input hydrological data comes from field measurements, input meteorological data, input the concentration of point source pollutant from tributaries, activities industry, hotel, shopping center, restaurant, and hospital sourced from the Environmental Agency, input the concentration of non-point source pollutants originate from agriculture and domestic waste of residents in Citarum watershed, water quality monitoring data in March, April and June 2019 are used as data for model verification. Model verification is done by calculating the percentage deviation of the simulation results with the results of field monitoring. Determination of the percentage of permissible deviations is 20% with a confidence level of the model of 80%.
Furthermore, the amount of the pollutant load capacity of the downstream segment of Citarum River is obtained by multiplying the flow rate of each segment by the water quality standard according to its designation. Meanwhile, the amount of pollutant load is obtained through the multiplication of river flow discharges with pollutant concentrations at each water quality monitoring location.
Table 2. Distribution of Reach in Downstream Segment of Citarum River
| Reach Name | Location | Elevation (usl) | Downstream Coordinate | |||||||||
|---|---|---|---|---|---|---|---|---|---|---|---|---|
| No | Upstream | Downstream | Reach Length | of Reach | Up strea m | Down stream | SL | EL | ||||
| Initial Reach | Final Reach | (Km) | (Km) | (m) | (m) | ° | ' | " | ° | ' | " | |
| 0 | Headwater | 108,5 | 20 | 6 | 24 | 44, 6 | 107 | 22 | 6,8 | |||
| 1 | Headwater | Jl. Rumambe | 13,9 | 94,6 | 20 | 19 | 6 | 21 | 45, | 107 | 19 | 28, |
| Reach Name | Location | Elevation (usl) | Downstream Coordinate | |||||||||
|---|---|---|---|---|---|---|---|---|---|---|---|---|
| No | Upstream | Downstream | Reach Length | of Reach | Up strea m | Down stream | SL | EL | ||||
| Initial Reach | Final Reach | (Km) | (Km) | (m) | (m) | ° | ' | " | ° | ' | " | |
| I, Karawang | 1 | 3 | ||||||||||
| 2 | Jl. Rumambe I, Karawang | Jembatan Teluk Jambe | 5,6 | 84,0 | 19 | 18 | 6 | 19 | 36, 8 | 107 | 18 | 43, 3 |
| 3 | Jembatan Teluk Jambe | Jembatan Tarumanagar a | 10,6 | 74,8 | 18 | 16 | 6 | 17 | 54, 7 | 107 | 17 | 16, 4 |
| 4 | Jembatan Tarumanag ara | Jl. Raya Proklamasi, Karawang | 9,2 | 69,2 | 16 | 13 | 6 | 14 | 57 | 107 | 16 | 34, 7 |
| 5 | Jl. Raya Proklamasi , Karawang | Jl. Raya Pebayuran, Bekasi | 5,6 | 57,6 | 13 | 12 | 6 | 13 | 10, 9 | 107 | 16 | 21, 4 |
| 6 | Jl. Raya Pebayuran, Bekasi | Jl. Raya Tugu Proklamasi, Karawang | 11,6 | 39,3 | 12 | 11 | 6 | 9 | 24, 9 | 107 | 17 | 14, 1 |
| 7 | Jl. Raya Tugu Proklamasi , Karawang | Jl. Teluk Bango, Karawang | 18,3 | 22,9 | 11 | 7 | 6 | 5 | 52, 1 | 107 | 12 | 31, 7 |
| 8 | Jl. Teluk Bango, Karawang | Jl. Raya Pakisjaya, Karawang | 16,4 | 5,6 | 7 | 4 | 6 | 2 | 50, 2 | 107 | 7 | 22, 3 |
| 9 | Jl. Raya Pakisjaya, Karawang | Muara Gembong, Bekasi | 17,3 | 0 | 4 | 1 | 5 | 59 | 4,5 | 107 | 2 | 38, 7 |
RESULTS AND DISCUSSION
Pollutant Load of Point Source
Point source pollutants in the downstream segment of Citarum River comes from tributaries, industrial activities, offices, shopping centers, hotels, hospitals and hospitals. Calculation of point source pollutant load can be seen in Table 3.
Table 3. Pollutant Load of Point Source
| Pollutant Load | (kg/day) | |||||
|---|---|---|---|---|---|---|
| Reach | Location | BOD | COD | Nitrate | Phos phate | |
| 1 | Jl. Demang, Karawang | Jl. Rumambe I, Karawang | 3800.02 | 9899.54 | 0.11 | 1.80 |
| 2 | Jl. Rumambe I, Karawang | Jembatan Teluk Jambe, Karawang | 1027.97 | 4437.45 | 0.30 | 5.16 |
| 3 | Jembatan Teluk Jambe, Karawang | Jembatan Tarumanagara, Karawang | 565.32 | 800.94 | 0.11 | 1.91 |
| 4 | Jembatan Tarumanagara, Karawang | Jl. Raya Proklamasi, Karawang | 15317.74 | 81650.79 | 0.03 | 0.49 |
| 5 | Jl. Raya Proklamasi, Karawang | Jl. Raya Pebayuran, Bekasi | 0.46 | 0.54 | 0.001 | 0.01 |
| 6 | Jl. Raya Pebayuran, Bekasi | Jl. Raya Tugu Proklamasi, Rengas dengklok, Karawang | 1.50 | 2.60 | 0.001 | 0.02 |
| 7 | Jl. Raya Tugu Proklamasi, Rengasdengklok, Karawang | Jl. Teluk Bango, Karawang | - | - | - | - |
| 8 | Jl. Teluk Bango, Karawang | Jl. Raya Pakisjaya, Karawang | - | - | - | - |
| 9 | Jl. Raya Pakisjaya, Karawang | Muara Gembong, Bekasi | - | - | - | - |
Based on Table 3., the highest pollutant load of point source was in reach 4, because in addition to the pollutant load originate from industrial activities, offices and hospitals, there is also a tributary (Cibeet River) which greatly contributes to the increase pollutant load of point source in that reach.
Pollutant Load of Non-Point Source
Pollutant load of non-point source in downstream segment of Citarum River comes from domestic activities and agricultural activities in watershed. Calculation of pollutant load of non-point source can be seen in Table 4.
Table 4. Pollutant Load of Non-Point Source
| Pollutant Load (kg/day) | ||||||||
|---|---|---|---|---|---|---|---|---|
| Reach | Parameter | Domestic | Agriculture | Total | ||||
| BOD | 6412.92 | 3.30 | 6416.22 | |||||
| COD | 8817.76 | 4.95 | 8822.71 | |||||
| 1 | Total N | - | 3.67 | 3.67 | ||||
| Nitrat | 1.60 | - | 1.60 | |||||
| Fosfat | 27.25 | 1.83 | 29.09 | |||||
| BOD | 5671.72 | 2.76 | 5674.48 | |||||
| COD | 7798.62 | 4.13 | 7802.75 | |||||
| 2 | Total N | - | 3.06 | 3.06 | ||||
| Nitrat | 1.42 | - | 1.42 | |||||
| Fosfat | 24.10 | 1.53 | 25.64 | |||||
| BOD | 5288.39 | 3.42 | 5291.81 | |||||
| COD | 7271.53 | 5.13 | 7276.66 | |||||
| 3 | Total N | - | 3.80 | 3.8 | ||||
| Nitrat | 1.32 | - | 1.32 | |||||
| Fosfat | 22.48 | 1.90 | 24.38 | |||||
| BOD | 8318.21 | 3.79 | 8322.00 | |||||
| COD | 11437.54 | 5.68 | 11443.22 | |||||
| 4 | Total N | - | 4.21 | 4.21 | ||||
| Nitrat | 2.08 | - | 2.08 | |||||
| Fosfat | 35.35 | 2.11 | 37.46 | |||||
| BOD | 2699.56 | 2.11 | 2701.67 | |||||
| COD | 3711.90 | 3.17 | 3715.06 | |||||
| 5 | Total N | - | 2.34 | 2.34 | ||||
| Nitrat | 0.67 | - | 0.67 | |||||
| Fosfat | 11.47 | 1.17 | 12.65 | |||||
| BOD | 5160.50 | 2.15 | 5162.65 | |||||
| COD | 7095.68 | 3.23 | 7098.91 | |||||
| 6 | Total N | - | 2.39 | 2.39 | ||||
| Nitrat | 1.29 | - | 1.29 | |||||
| Fosfat | 21.93 | 1.19 | 23.13 | |||||
| Pollutant Load (kg/day) | |||||||
|---|---|---|---|---|---|---|---|
| Reach | Parameter | Domestic | Agriculture | Total | |||
| BOD | 4266.52 | 4.00 | 4270.52 | ||||
| COD | 5866.46 | 6.00 | 5872.46 | ||||
| 7 | Total N | - | 4.44 | 4.44 | |||
| Nitrat | 1.07 | - | 1.07 | ||||
| Fosfat | 18.13 | 2.22 | 20.36 | ||||
| BOD | 6004.28 | 4.67 | 6008.94 | ||||
| COD | 8255.88 | 7.00 | 8262.88 | ||||
| 8 | Total N | - | 5.19 | 5.19 | |||
| Nitrat | 1.50 | - | 1.50 | ||||
| Fosfat | 25.52 | 2.59 | 28.11 | ||||
| BOD | 5893.37 | 4.43 | 5897.80 | ||||
| COD | 8103.38 | 6.65 | 8110.03 | ||||
| 9 | Total N | - | 4.92 | 4.92 | |||
| Nitrat | 1.47 | - | 1.47 | ||||
| Fosfat | 25.05 | 2.46 | 27.51 | ||||
Based on Table 4, the highest pollutant load of non-point source comes from domestic in watershed. The largest pollutant load of non-point source was in reach 4, because in that reach the population density is quite high compared to other reach and there was also a large enough agricultural land so that runoff that is generated can increase the burden of pollutants entering the river.
The results of Existing Condition simulation using QUAL2Kw
Model simulations are carried out to represent the actual river conditions. The model that has been run will produce a simulation graph of the parameters modeled from the downstream segment of Citarum River.
Based on Figure 1, it can be seen that the results of simulation models for BOD almost all approach the results of analysis. Model simulation results show that BOD concentrations almost entirely exceed quality standards according to KEPGUB West Java No. 39 of 2000 for class B, C, D. The simulation results of the model are influenced by the increase in debit and levels of pollutants entering downstream segment of Citarum River. The high BOD concentration in the downstream segment of Citarum River is caused by domestic activities that dump waste directly into river
bodies. Industrial activities around the river also contribute to increasing the BOD level in the river.
Large industries located in the upstream and downstream of Citarum watershed in the form of the textile industry, the food processing industry, and the footwear/shoes manufacturing industry act as contributors to waste in Citarum River sub-watershed. In addition, micro and small business activities also increase the burden of waste entering Citarum River bodies (Kusuma et al, 2018). A high BOD value indicates a decrease in DO value because the oxygen available in the water is being consumed by bacteria, causing fish and other aquatic organisms to be unable to survive in the river (Pathak and Limaye, 2011).
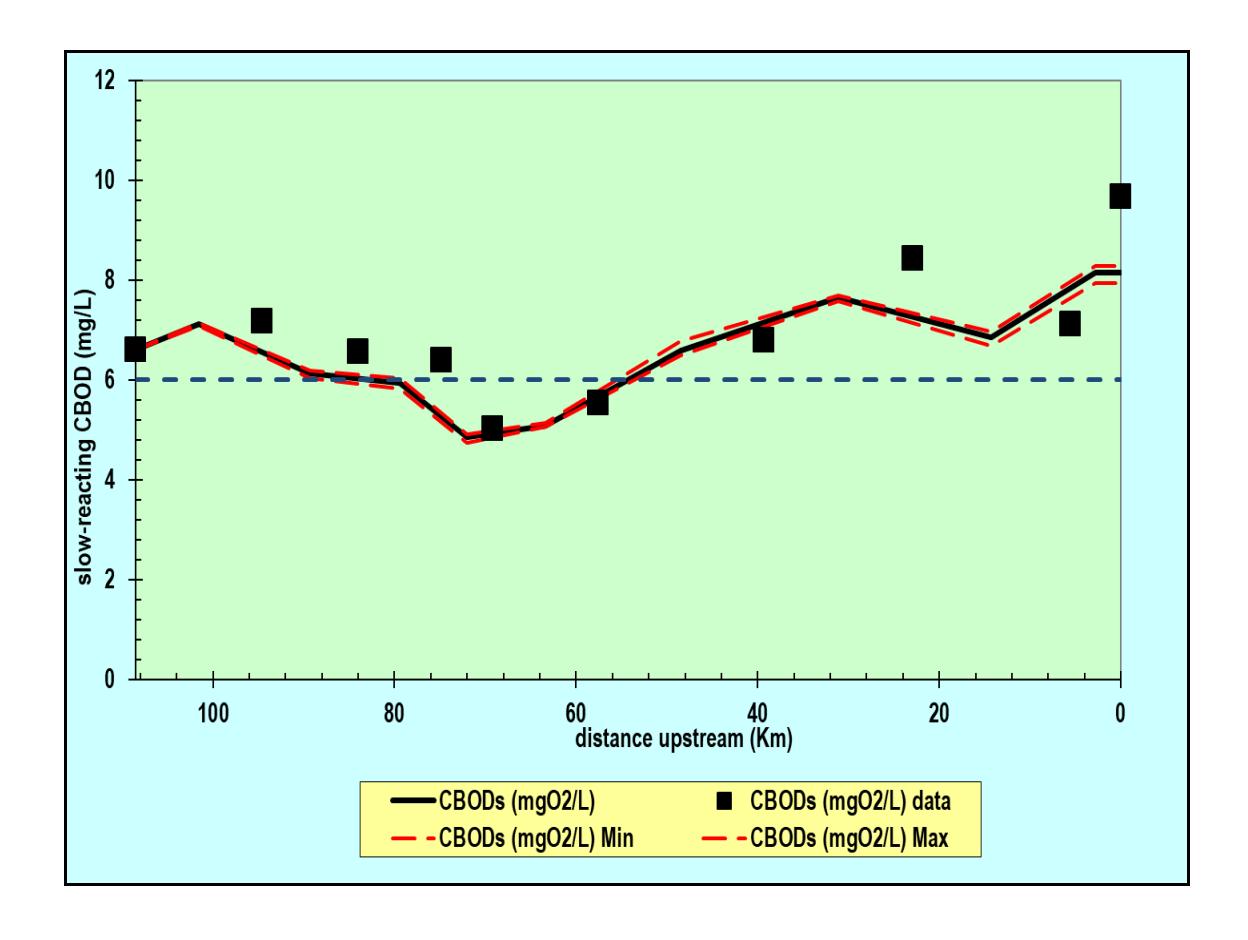
Figure 1. The results of BOD Model Simulation in Downstream Segment of Citarum River
Model simulation results and analysis data for COD can be seen in Figure 2. COD concentration both model simulation results and the results of analysis data have
far exceeded the quality standard based on KEPGUB West Java No. 39 of 2000 for classes B, C, D which is 10 mg/L. Similar to BOD, high levels of COD are also caused by waste originate from domestic and industrial activities in watershed. The COD reflects the amount of chemically oxidized organic compound or the amount of oxygen needed to oxidize organic substances to CO2 and H2O. Certain organic materials present in wastewater are immune to biological degradation and some are toxic even at low concentrations. COD levels in wastewater will decrease along with the reduction in the concentration of organic matter contained in wastewater (Metcalf and Eddy, 2003).
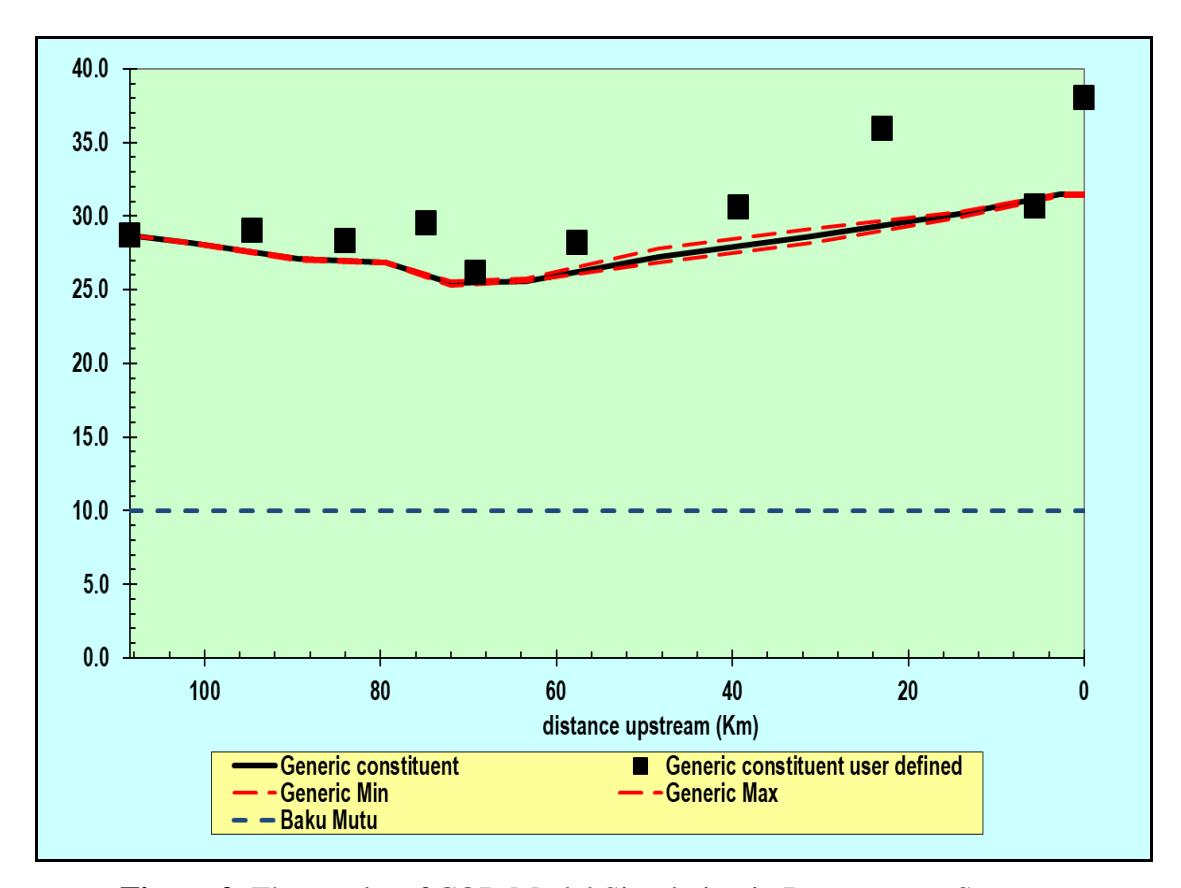
Figure 2. The results of COD Model Simulation in Downstream Segment of Citarum River
Based on Figure 3, it can be seen that the results of the nitrate model simulation have approached the analysis data. Both the model simulation results and analysis data results of nitrate concentrations in downstream segment of Citarum River were still below the quality standard according to KEPGUB West Java No. 39 of 2000 for classes B, C, D (10 mg/L). Sources of nitrate pollutants in downstream segment of Citarum
40 Jurnal Teknik Lingkungan Vol.26 No. 2 Ayu Widya Utami, Pramiati Purwaningrum, dan Diana Irvindiaty Hendrawan.
River comes from agricultural activities, the use of fertilizers, and settlement activities. Nitrates derived from ammonium that enter the river body mainly through domestic waste concentrations in the river will decrease when getting further from the point of disposal due to the activity of microorganisms in the water for example bacteria nitrosumonas (Mustofa, 2015). Nitrate-nitrogen levels in natural waters are almost never more than 0.1 mg/L, but if nitrate levels are greater than 0.2 mg/L will lead to eutrophication which further stimulates the growth of algae and aquatic plants rapidly (Effendi, 2003).
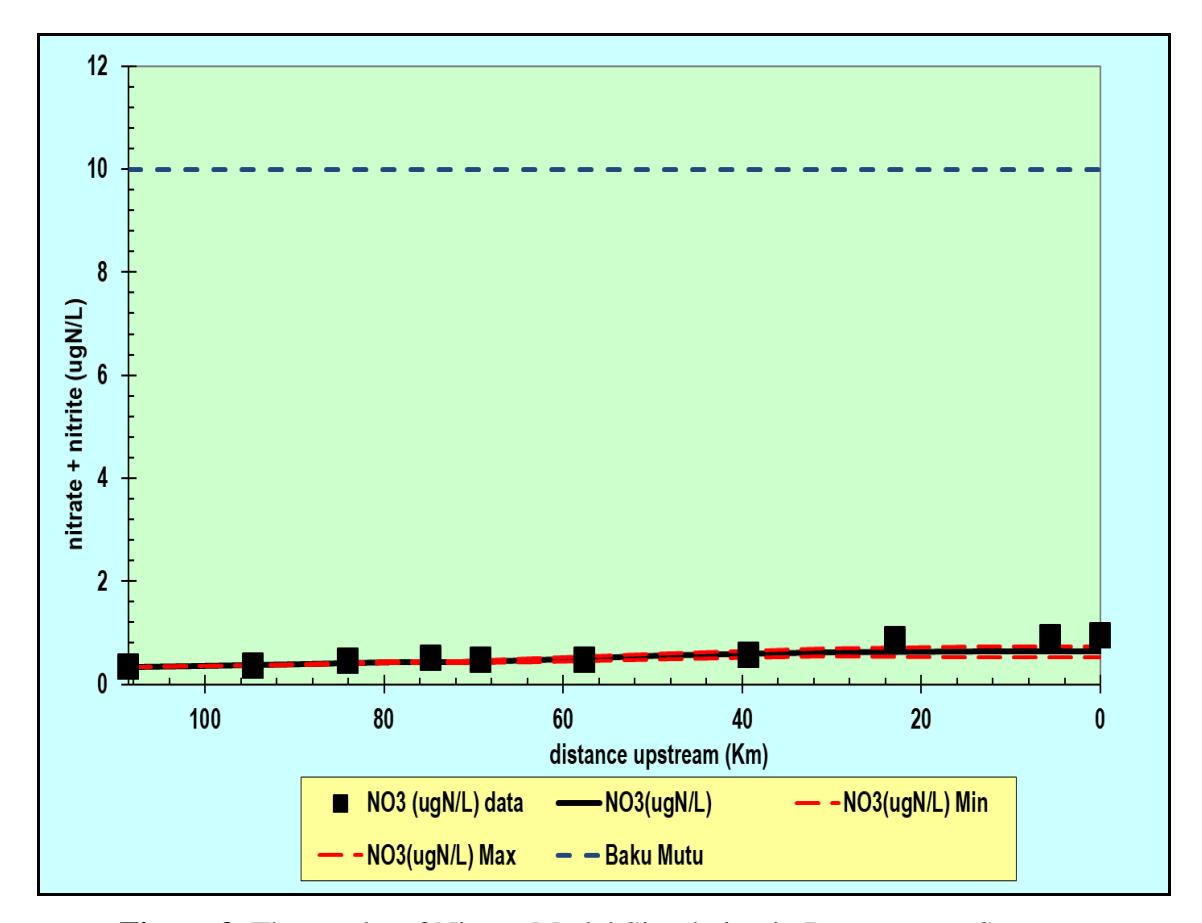
Figure 3. The results of Nitrate Model Simulation in Downstream Segment of Citarum River
Based on Figure 4., the results of the phosphate model simulation almost all approach the analysis data. The model simulation results and analysis results of phosohate in downstream segment of Citarum River have far exceeded the quality standard for class 1 based on PP No. 82 of 2001 which is equal to 0.2 mg/L.
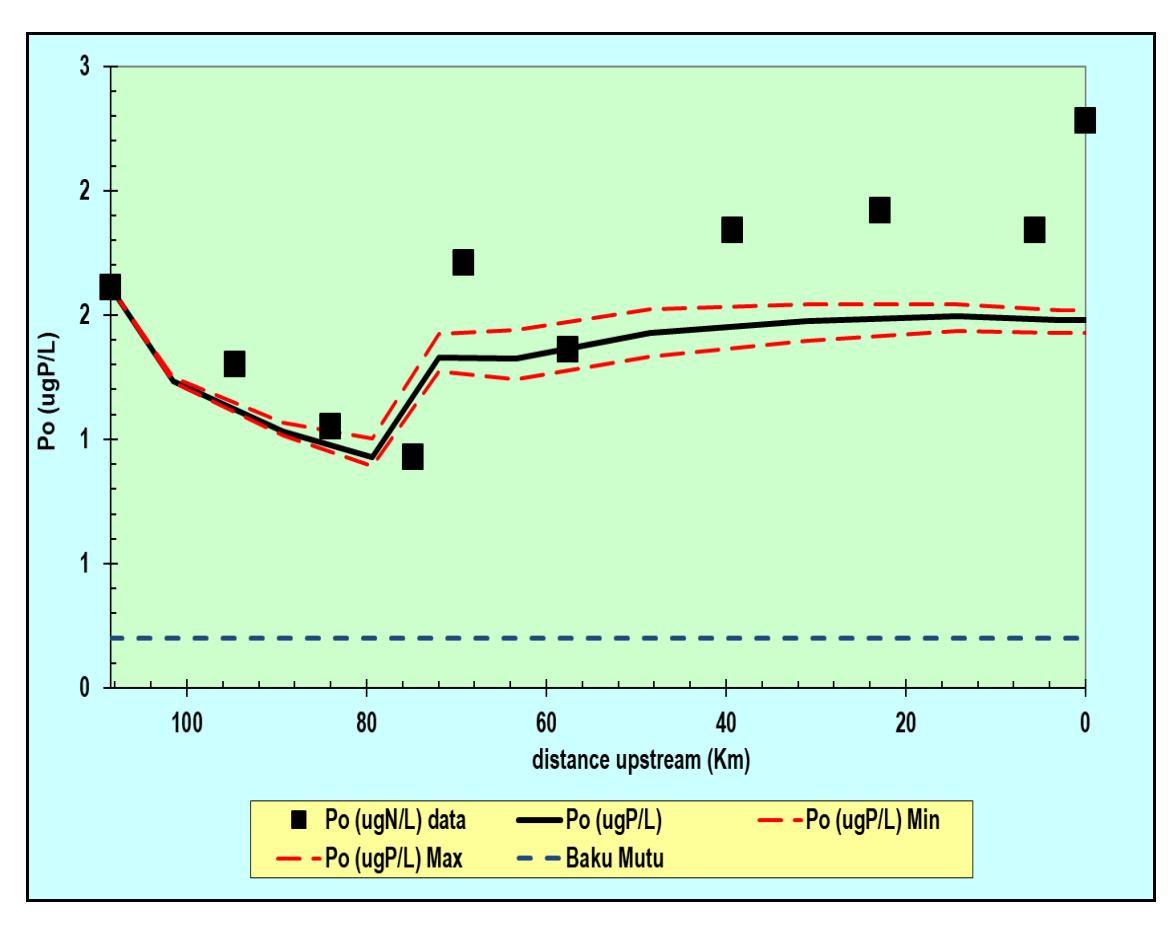
Figure 4. The results of Phosphate Model Simulation in Downstream Segment of Citarum River
High levels of phosphate in downstream segment of Citarum River occur due to agricultural runoff and domestic activity waste, especially human waste and laundry waste containing detergents that are discharged directly into river bodies. In agricultural areas orthophosphate is derived from fertilizer that enters rivers or lakes through drainage and rainwater flow. Polyphosphates can enter rivers through wastewater from residents and industries that use phosphate-containing detergents, such as the metal industry and so on. Organic phosphate is found in wastewater from residents (feces) and food scraps. Organic phosphate can also occur from orthophosphate which is dissolved through biological processes because both bacteria and plants absorb phosphate for its growth (Amirullah and Ismail, 2009).
Based on the model simulation results of the existing downstream segment of Citarum River, the percentage deviations from the BOD, COD, nitrate, and phosphate parameters were 5%, 8%, 13%, and 13%. Deviation values of less than 20% are 42 Jurnal Teknik Lingkungan Vol.26 No. 2 Ayu Widya Utami, Pramiati Purwaningrum, dan Diana Irvindiaty Hendrawan.
considered acceptable in predicting such concentrations in downstream segment of Citarum River and can be used to calculate river pollutant loads. The percentage of errors in modeling can occur due to water sampling activities at each monitoring point (Zhang et al, 2012). The model will be more accurate if adding various input variables including basic algae, sediment oxygen demand, organic nitrogen, total and organic phosphorus, etc. in the monitoring program (Hossain et al, 2014).
Pollutant Load Capacity Analysis
Determination of the pollutant load capacity is based on the value of the difference between the existing pollutant load in the river with the permissible pollutant load that is the concentration of each water quality parameter according to the water class in the quality standard. The difference can be negative or positive. If the difference between pollutant load and capacity was negative, it is necessary to reduce pollutant load. If the difference between pollutant load and capacity is positive, it can be said that the river is still able to accommodate the amount of loads before it exceeds its capacity.
Table 5. Pollutant Load Capacity
| Reach | Parameter | Pollutant Load Capacity (kg/day) | Pollutant Load (kg/day) | Difference (kg/day) | Percentage of Overload (%) |
|---|---|---|---|---|---|
| BOD | 14556.67 | 16012.34 | -1455.67 | 9% | |
| 0 | COD | 24261.12 | 69556.63 | -45295.51 | 65% |
| Nitrat | 24261.12 | 800.62 | 23460.50 | 0% | |
| Fosfat | 485.22 | 3906.04 | -3420.82 | 88% | |
| BOD | 15709.79 | 18664.66 | -2954.87 | 16% | |
| COD | 26182.98 | 73820.25 | -47637.27 | 65% | |
| 1 | Nitrat | 26182.98 | 913.18 | 25269.80 | 0% |
| Fosfat | 523.66 | 3234.86 | -2711.20 | 84% |
| Reach | Parameter | Pollutant Load Capacity (kg/day) | Pollutant Load (kg/day) | Difference (kg/day) | Percentage of Overload (%) |
|---|---|---|---|---|---|
| BOD | 16596.52 | 16974.06 | -377.54 | 2% | |
| COD | 27660.87 | 74935.95 | -47275.07 | 63% | |
| 2 | Nitrat | 27660.87 | 1080.96 | 26579.91 | 0% |
| Fosfat | 553.22 | 2852.50 | -2299.28 | 81% | |
| BOD | 17187.91 | 17043.88 | 144.04 | 0% | |
| COD | 28646.52 | 76917.13 | -48270.61 | 63% | |
| 3 | Nitrat | 28646.52 | 1243.54 | 27402.99 | 0% |
| Fosfat | 572.93 | 2658.53 | -2085.60 | 78% | |
| BOD | 20905.71 | 16885.16 | 4020.56 | 0% | |
| 4 | COD | 34842.86 | 88669.93 | -53827.08 | 61% |
| Nitrat | 34842.86 | 1517.58 | 33325.28 | 0% | |
| Fosfat | 696.86 | 4623.32 | -3926.46 | 85% | |
| BOD | 21217.11 | 17995.95 | 3221.16 | 0% | |
| COD | 35361.86 | 90502.14 | -55140.29 | 61% | |
| 5 | Nitrat | 35361.86 | 1645.61 | 33716.25 | 0% |
| Fosfat | 707.24 | 4690.38 | -3983.14 | 85% | |
| BOD | 21569.86 | 23702.44 | -2132.58 | 9% | |
| COD | 35949.77 | 97865.45 | -61915.68 | 63% | |
| 6 | Nitrat | 35949.77 | 1987.45 | 33962.32 | 0% |
| Fosfat | 719.00 | 5129.15 | -4410.15 | 86% | |
| BOD | 22140.10 | 28233.06 | -6092.96 | 22% | |
| 7 | COD | 36900.17 | 105702.47 | -68802.30 | 65% |
| Reach | Parameter | Pollutant Load Capacity (kg/day) | Pollutant Load (kg/day) | Difference (kg/day) | Percentage of Overload (%) |
|---|---|---|---|---|---|
| Nitrat | 36900.17 | 2298.86 | 34601.31 | 0% | |
| Fosfat | 738.00 | 5445.75 | -4707.75 | 86% | |
| BOD | 22814.02 | 26082.87 | -3268.85 | 13% | |
| COD | 38023.37 | 114634.33 | -76610.96 | 67% | |
| 8 | Nitrat | 38023.37 | 2438.54 | 35584.83 | 0% |
| Fosfat | 760.47 | 5686.16 | -4925.69 | 87% | |
| BOD | 23456.84 | 31866.22 | -8409.39 | 26% | |
| COD | 39094.73 | 122959.31 | -83864.58 | 68% | |
| 9 | Nitrat | 39094.73 | 2473.37 | 36621.36 | 0% |
| Fosfat | 781.89 | 5784.25 | -5002.36 | 86.5% |
Based on Table 4., pollutant load of BOD, COD, and phosphate in all reach exceeds pollutant load capacity (PLC), while for nitrate pollutant load does not exceed its PLC. The percentage of BOD overload is 0%-26%, COD overload was 61%-68%, and phosphate overload was 78%-87%.
CONCLUSION
Simulation results of existing conditions for pollutant load of BOD, COD, nitrate, and phosphate in downstream segment of Citarum River almost all have exceeded its pollutant load capacity (PLC). The results of the PLC for BOD model simulation was 14556.67 kg/day-23456.84 kg/day while pollutant load of BOD was 16012.34 kg/day-23456.84 kg/day so that the BOD overload was 0%-6%. The results of PLC for COD model simulation was 24261.12 kg/day-39094.73 kg/day while pollutant load of COD was 69556.63 kg/day-122959.31kg/day so that the COD overload was 61%-68%. The result of PLC for nitrate model simulation was 24261.12 kg/day-39094.73 kg/day while pollutant load of nitrate was 800.62kg/day-2473.37kg/day so that the nitrate overload was 0%. The results of PLC for phosphate model simulation was 485.22 kg/day-781.89 kg/day while pollutant load of phosphate was 3906.04 kg/day-5784.25 kg/day so that the phosphate overload was 78% -87%.