
INTRODUCTION
The Citarum River is one of the longest rivers in West Java, flows from upstream in the Wayang Mountain area in the south of Bandung to the north and empties into Karawang with a length of about 270 kilometers that flows through a hollow area and passes three dams (PD Melayu, 2016). The Citarum River flows to the rice fields which are 270 km long and have important functions not only for the settlement in the riverbanks, but also as the main air source for Jakarta (Coleman, 2018). The Citarum River watershed is grouped into 3 parts, namely upstream, middle and downstream. (1) The upstream part of the Citarum River Region has an elevation ranging from 625-2,600 masl consisting of segment 1 through segment 8 with land use in the form of agriculture, settlements and industry. The middle part of the Citarum watershed has various elevations between the plains (elevation 250-400 masl), hills (elevation 200-800 masl), and steep hills (elevations 1,400 – 2,400 masl) consisting of segment 9 through segment 15 with land use of plantations and agriculture. The downstream Citarum watershed has elevation between 200-1,200 masl consisting of segment 16 through segment 20 with land use of agriculture, industry, settlements and ponds. Citarum River has a high level of pollution 9 times higher for COD parameter Haskoning, 2012). The rapid growth of industries and settlements on the riverbanks make the Citarum River a place for disposal of wastewater from industries and settlements without threaten first by sewage treatment (Asian Development Bank, 2013). Rapid growth of population and land use cause increase pollution from the domestic, agricultural, and industrial sectors (Ginkel, 2015). The Citarum River Basin segment 18 consisting of 7 urban villages has a typical housing in the form of unregulated settlements and the settlement has not been equipped with a communal Waste Water Treatment Plant (WWTP). Knowing potential contribution of domestic greywater that impact the water quality of the Citarum River, segment 18, was an important initial stage to analyze pollution load and solution to overcome quality decreasing along the Citarum river.
RESEARCH METHOD
The research was conducted in the Citarum riverbank segment 18 at the downstream, focus on the biggest main drainage channel in 6 urban villages namely East Adiarsa, West Adiarsa, Nagasari, Sukaharja, Puseurjaya, and Telukjambe, located in riverbanks of the Citarum River, segment 18. Secondary data needed was a map of land use and population demographics, while the primary data was the quality of domestic greywater. Sampling of domestic wastewater from the drainage channel was taken based on the grab sampling method. Water samples are taken by using a water sampler and measured several parameters in situ, then water samples were inserted into a 5 liter size bottle equipped with a name label according to the sampling location and placed in an ice box/ Styrofoam and preserved using ice gel, then analyzed at Environmental Laboratory, Environmental Engineering Department, Universitas Trisakti. Sampling was carried out in two times which were the morning of 06.00 - 09.00 AM and the afternoon at 15.00 -19.00 PM based on the peak water consumption time in household activities, in February and April 2019. The parameter that tested were TSS, COD, BOD, and oil and grease to be compared with quality standards based on
Minister of Environment Regulation No.68 of 2016 concerning Domestic Wastewater Quality Standards. The data were then tabulated and analyzed descriptively.
RESULTS AND DISCUSSION
Geographically, Karawang Regency was located at 1070 02'-1070 40 'EL and 50 56'-6 0 34 'SL. The Citarum watershed, segment 18 covers 3 sub-districts consisting of 7 villages in Karawang Regency. The study area conducted along the Citarum Riverbank segment 18 as shown in Figure 1. In Figure 2, it could be seen the six research village while Figure 3 showed the location of sampling points.
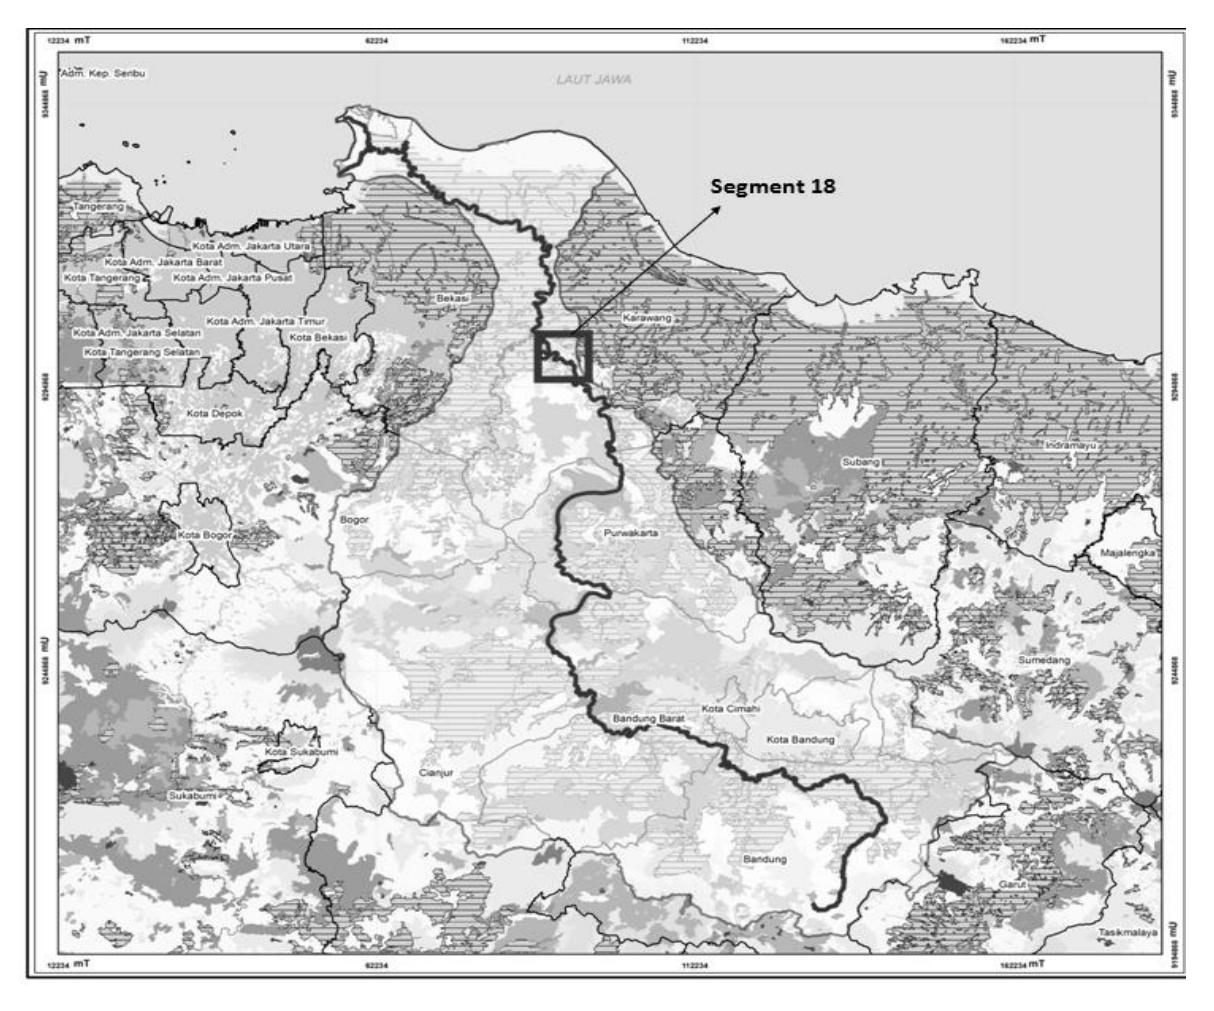
Figure 1. Map of Citarum River
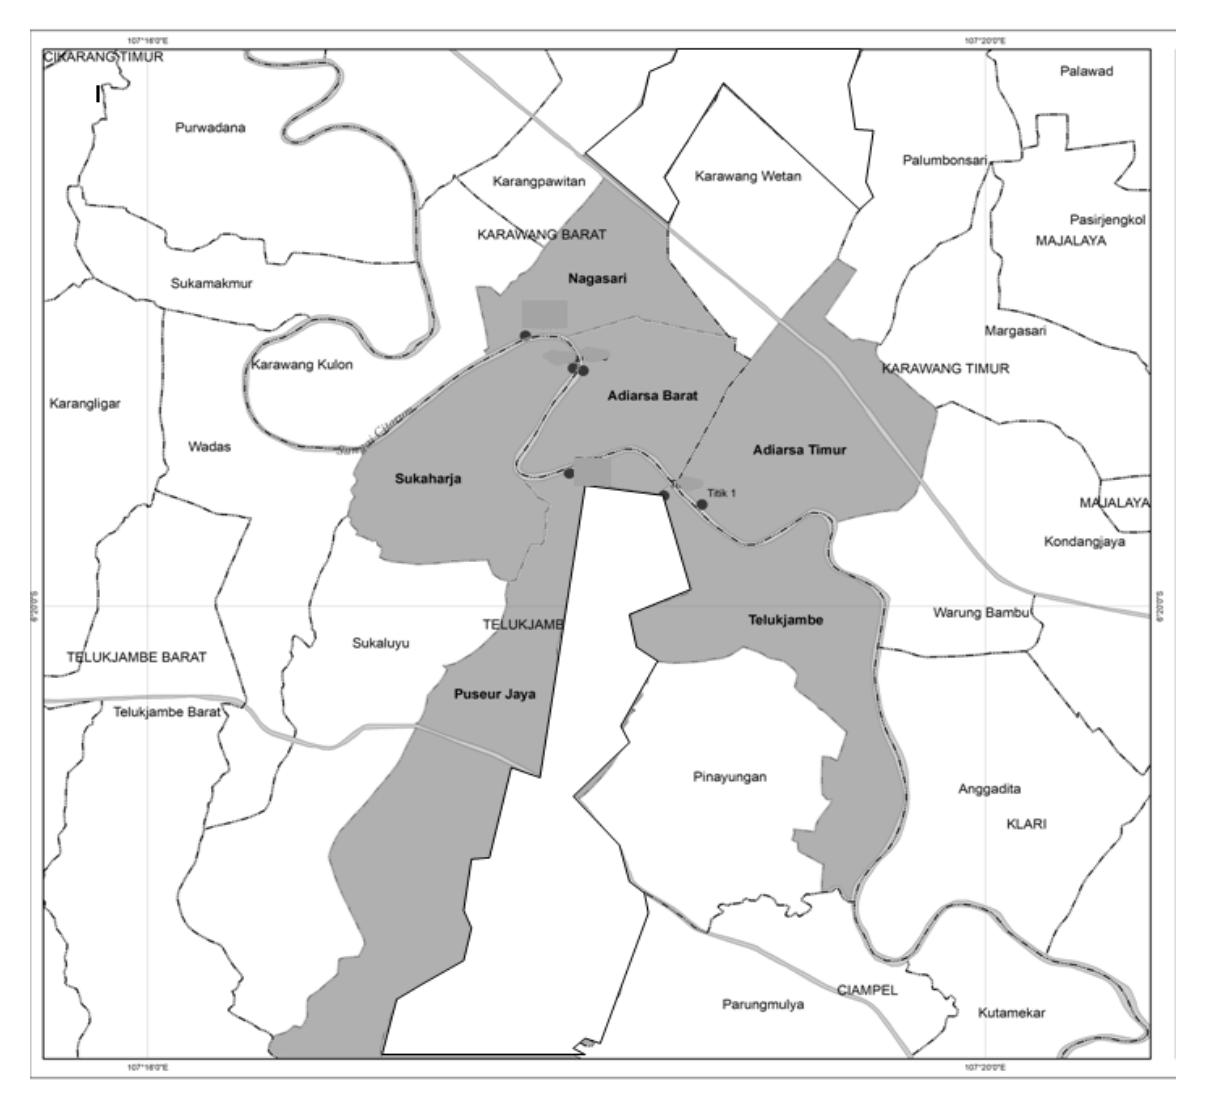
Figure 2. Map of Research Villages
Pollutant sources in 6 urban villages generated from household activities which increase greywater that entered the drainage channel and directly flowed into the Citarum River without any treatment. The condition of the drainage channel in the East Adiarsa, West Adiarsa and Telukjambe villages was in good condition and was well maintained but was surrounded by garbage from the settlements, while the condition of the drainage channel in Nagasari, Puseurjaya, and Sukaharja villages was in a poorly maintained condition and there was garbage in the drainage channel.
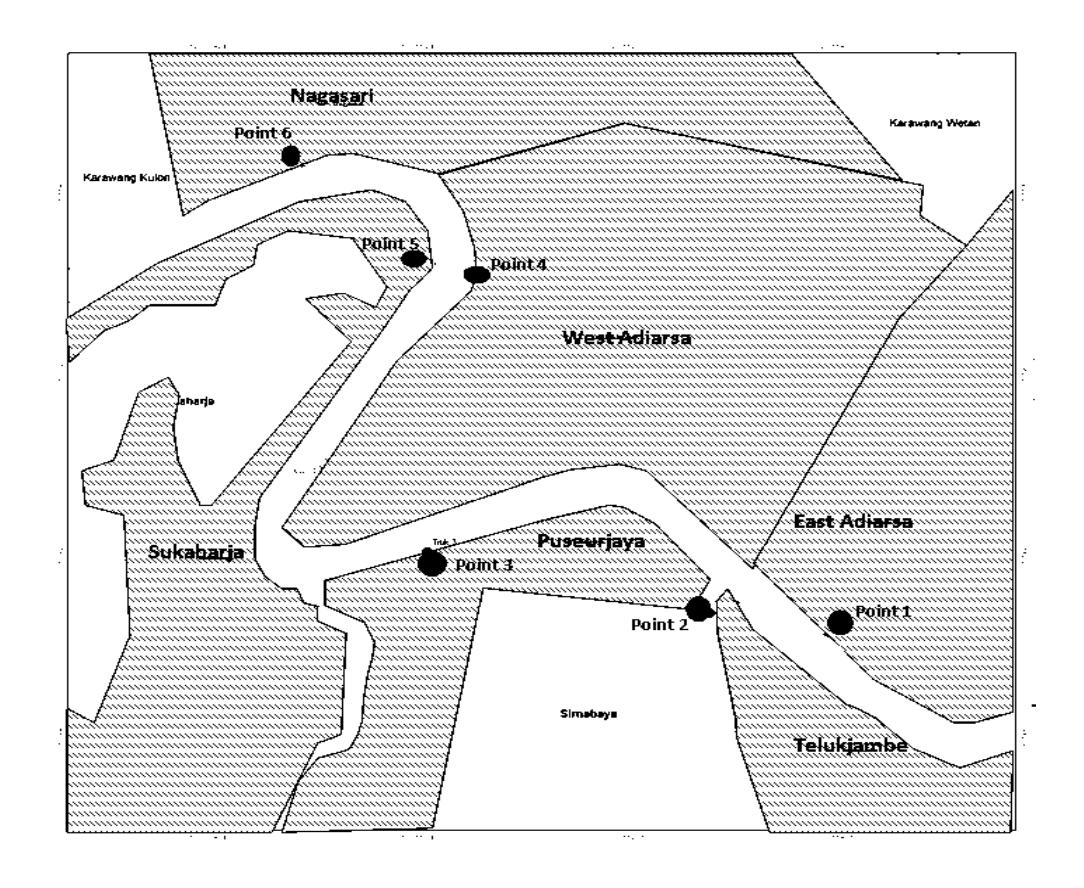
Figure 3. Map of Citarum River Sampling Points
The results of the water quality test in the drainage channel in Table 1 shows that the TSS parameters in almost all sampling locations were exceeded the quality standard except in the West Adiarsa at February and in the Puseurjaya at April. TSS value in river water caused by domestic wastewater has exceeded the quality which was 52 mg/L-84 mg/L (Suprihatin, 2014). The COD parameter at February in all sampling location were exceeded the quality standard while at April in the locations of Telukjambe and East Adiarsa were still below the quality standard. Higher COD concentration shows that the organic content cannot be degraded biologically (Suharto et al, 2019) The BOD parameters in all sampling locations at February and April showed exceeding quality standards.
Figure 4 and Figure 5 showed the parameters of BOD and COD in February and April at all sampling points compared with quality standards according to the Minister of Environment No.68 of 2016. COD parameters in the Karang Anyar river have exceeded 1.8 to 3.5 times that of the river water quality standard due to the inclusion of domestic wastewater wastewater (Puspita et al, 2016). Overall oil and grease parameters in the sampling location in February were exceeded the quality standard while in April as a whole still below the quality standard.
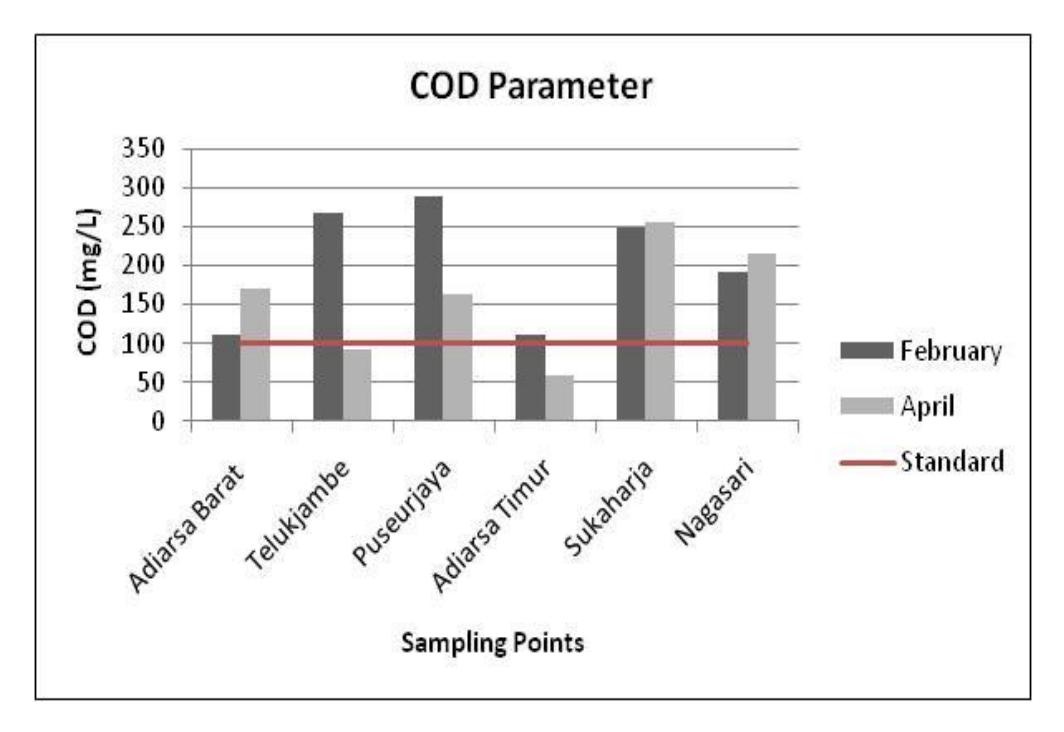
Figure 4. The value of COD concentrations of greywater
Table 1. Water Quality
| Location | ||||||||
|---|---|---|---|---|---|---|---|---|
| Months | Parameter | Standard | West | Teluk | Puseur | East | Sukahar | Nagasa |
| Adiarsa | jambe | jaya | Adiarsa | ja | ri | |||
| February | TSS (mg/L) | 30 | 24.5 | 221.5 | 90.5 | 131 | 182 | 288.5 |
| COD (mg/L) | 100 | 110.4 | 267.2 | 288 | 110.4 | 248 | 192 | |
| BOD (mg/L) | 30 | 132.125 | 274.3 | 180.17 | 69.065 | 205.975 | 172.16 | |
| Oil and Grease (mg/L) | 5 | 5.35 | 8.3 | 11.5 | 6.3 | 5.285 | 3.1 | |
| April | TSS (mg/L) | 30 | 117 | 85 | 34 | 111.5 | 72 | 76 |
| COD (mg/L) | 100 | 169.6 | 92 | 163.6 | 58.4 | 256 | 216 | |
| BOD (mg/L) | 30 | 106.095 | 57.51 | 102.345 | 137.605 | 59.005 | 135.125 | |
| Oil and Grease (mg/L) | 5 | 4 | 2.7 | 2.5 | 3.7 | 2.35 | 1.95 | |
Quality Standard: Minister of Environment Regulation No.68 of 2016
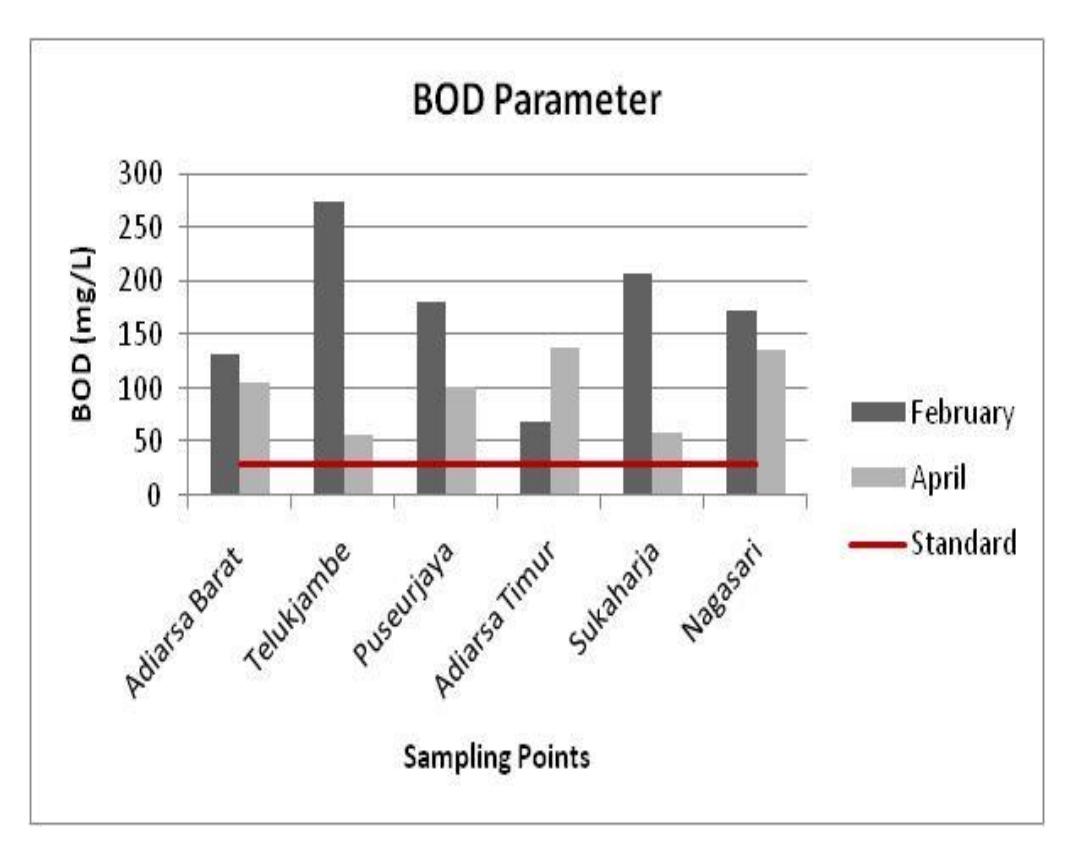
Figure 5. The value of BOD concentrations of greywater on drainage
During the 2 months sampling, it was seen that the COD and BOD parameters which had high concentrations and exceeded the quality standard according to the Minister of Environment Regulation No.68 of 2016 were found in the villages of Telukjambe, Puseurjaya, Sukaharja and Nagasari. The high value of COD and BOD concentrations on drainage in the 6 research villages shows the occurrence of water pollution due to activities from households that directly dispose of waste water to the drainage channel on the banks of the Citarum River. The high value of BOD5 indicates the presence of high organic matter in the wastewater which originates from kitchen sink as well as partially treated septic tank (Ling et al, 2012). The BOD value was likely to be the same as the COD value, but the BOD value may not be greater than the COD value. So in outline COD describes the amount of organic matter in water (Atima, 2015).
Domestic wastewater that generated form sinks and dishwasher contribute the mostof biodegradable organic substance (Wijaya and Soedjono, 2018). The high COD concentration causes the dissolved oxygen content in the water to be low (Kartika, 2012). If the dissolved oxygen level decreases, the animals that occupy these waters will
die. And if the levels of BOD and COD increase causing the waters to become polluted (Zulkifli et al, 2009).
Drainage channels with direct flow into the river can have an impact on pollution of the river body (Iskandar, 2016). Pollution on the drainage channel caused by community activities that do not maintain sanitation can cause disease, especially in the riverbanks. In maintaining the quality of drainage water that enters rivers, a control scenario in the form of communal wastewater was needed which requires active participation from the community in maintaining environmental quality and managing communal WWTPs.
CONCLUSION
Result of water quality on drainage cTSS parameters in almost all sampling locations exceed the quality standard except in February at the East Adiarsa village and in April at the Puseurjaya village. The COD parameters in February as a whole at the sampling location exceeded the quality standard while in April at Telukjambe and East Adiarsa village were still below the quality standard. The overall BOD parameters at the sampling location in February and April showed exceeding the quality standard. Oil and fat parameters in the sampling location in February as a whole exceeded the quality standard while in April as a whole still below the quality stone according to Minister of Environment Regulation No.68 of 2016. COD and BOD parameters that have high concentrations and exceed raw are found in the villages of Telukjambe, Puseurjaya, Sukaharja and Nagasari. Pollution on drainage channels caused by community activities that do not maintain sanitation can cause disease, especially in the riverbanks.