
INTRODUCTION
This densely populated residential area is due to the limited fulfillment of urban land which is increasing every year, one of the housing needs in Jakarta. Jakarta's high population growth rate has caused changes in areas that should have been green open spaces such as riverbanks into built up areas.
Physical damage to watersheds will damage the landscape and ecosystems along the river. Activities such as road construction, housing, trade centers will drastically change the geomorphology and hydrology of rivers and other catchments like that. As a result, it will change the structure of plants and water, which will result in water absorption into the soil and movement of water above the ground. These changes will have an impact on the lack of water supply during the dry season and floods in the rainy season
The buffer zones in the settlement area are required. Thi riparian serves to control the water cylcle, as water supply maintaining aquatic habitat (Fitri et al, 2017).
Building component is a priority rather than environmental component, because environmental component only support for a comfort, while the building component support for a comfort to do activity. That's why people more preferred than environmental component (Fitri et al, 2017).
The problem of increasing population has caused depression in the land around the river. The riverside area is increasingly filled with slums areas as well as squatter habitats that grow freely on the riverbanks accompanied by the daily behavior of the residents of the settlements. Behavior of citizens who do not care about the environment is increasingly having an impact on environmental degradation, one of which is the behavior of littering, domestic waste and other pollutants carelessly on the river body.
People's behavior impact on riverbanks to cosystems damage and river water pollution is including geo- physics-chemistry variables (type and volume of waste that goes into the river) and physical and chemical quality of river water. Aspects of geophysical-chemical and biological environments that have interaction one to another, have the ability to grow and develop, and can be used by communities to acquire their needs. Biological environment variable is mainly focused on aquatic and errestrial biological environments, i.e. water quality. Behavior of society on the banks does not support the preservation of river function, it increases the level of water pollution that inhibits the function of the river (Simaulan et al, 2013).
Baru Barat River which is located in the South Jakarta area is a man made river for flood and irrigation control. The length of Baru Barat River is 15,403 m with a width of three meters. In the catchment area of Baru Barat River in Jakarta there are 5 districts with 17 villages. The river wall is pavemented and the bottom of the water is gravel and sand. This study aims to determine the effect of activities on the banks of Baru Barat River on the water quality.
RESEARCH METHOD
This research was conducted in April-June 2019 located in Baru Barat River in Jakarta with a flow length of 15.4 Km with 7 sampling point for identification of water quality. The identification of activities on the banks of Baru Barat River is carried out to determine the potential pollutants that influence the river. Identification of activities is carried out along the river with a distance of 200 m from the edge of the river.
Water quality parameters are compared with the Governor of Jakarta Decree No. 582 year 2005 concerning Designation and Water River Quality Standards the Group B. The status of water quality is determined using the pollution index method in accordance with the Decree of the Minister of Environment No. 115 of 2003 concerning Guidelines for Determining the Status of Water Quality. Calculation of pollution index (PI) is done by using Eq (1). The 7 parameters used for calculate the PI are TDS, TSS, BOD, COD, DO, Phosphat (PO4), Nitrate (NO3). In determining PI, use quality standards according to Minister of Environment Regulation No. 82 of 2001 because it has more stringent limits. The PI calculation results are used for management decisions.
\[PI_{j} = \sqrt{\frac{(C_{i}/L_{|ij})_{M}^{2} + (C_{i}/L_{ij})_{R}^{2}}{2}}\](1)
Where
Ci = Observed concentration of i parameter
Li = Permissible limit of i parameter
M = Maximum value of (Ci/Lij)
R = Average value of (Ci/Lij)
Pollution Index (PI) Value Water Criteria Status
0 < PI < 1,0 Meets Quality Standards (Good), 1 < PI < 5,0 Low Polluted, 5 < PI < 10 Moderate Polluted, PI > 10 Heavily Polluted
Table 1. Coordinat of sampling point
| Coordinat | ||
|---|---|---|
| Sampling point | S | E |
| 1 | 6°20'15,2" | 106°49'45,6" |
| 2 | 6°18'17,5" | 106°50'14,0" |
| 3 | 6°16'58,4" | 106°50'39,3" |
| 4 | 6°15'43,4" | 106°50'34,9" |
| 5 | 6°14'40,7" | 106°50'33,7" |
| 6 | 6°13'27,4" | 106°50'50,3" |
| 7 | 6°12'43,2" | 106°50'39,5" |
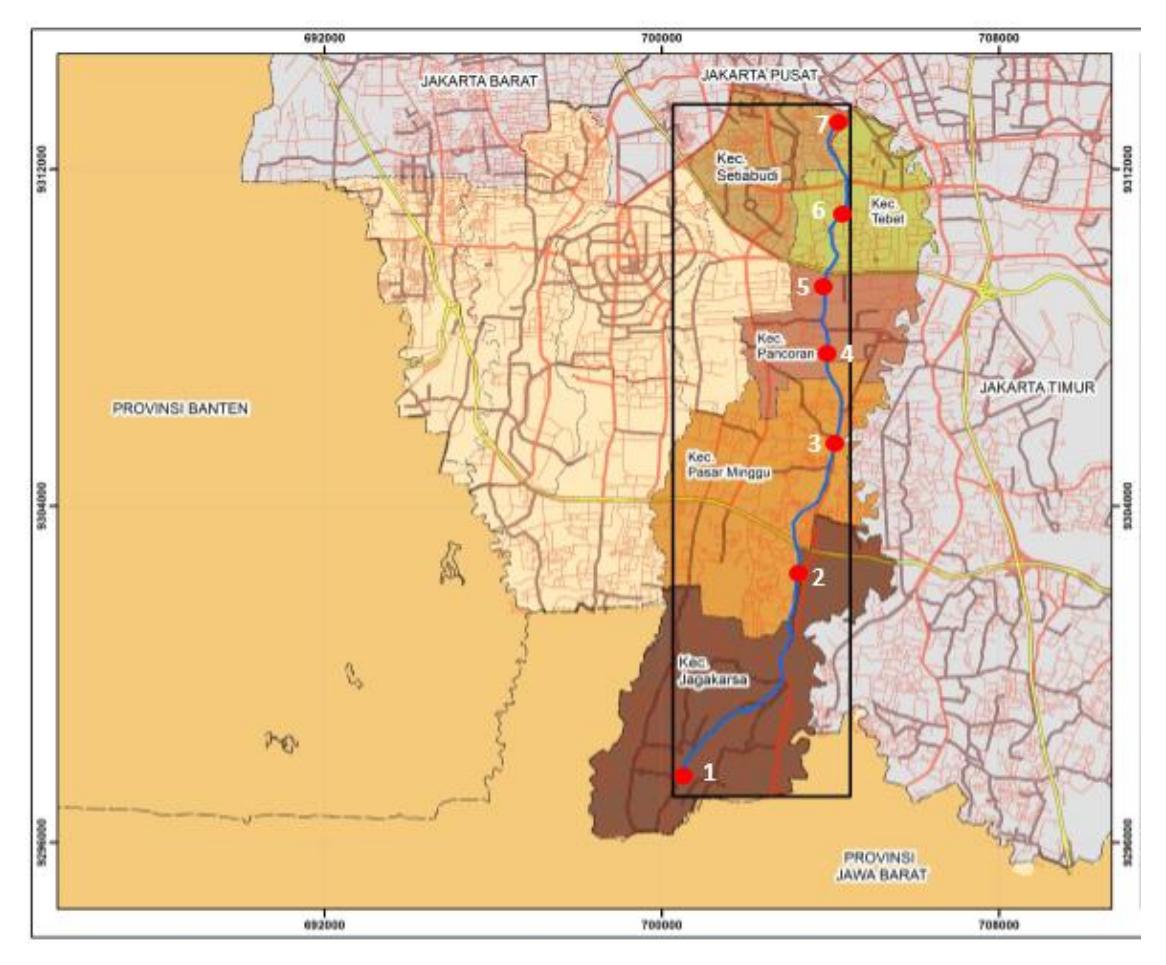
Fig. 1. Sampling point in Kali Baru River
RESULT AND DISCUSSION
Water Quality of Kali Baru River
According to Law No. 56/1960, the four classifications of population density are not dense with a density of 1-50 people/km2 , less densely populated 51-250 people/ km2 , quite solid 251-400 people/km2 and very dense with more density levels a total of 401 people/km2 . The sub-districts along the Kali Baru Barat are Jagakarsa, Pasar Minggu, Pancoran, Tebet and Setiabudi. The average population density in 5 districts along the Kali Baru Barat is 17,422,465 people/km2 meaning that the 5 districts have a very dense density. High population will occupy open spaces, among others on the banks of the river.
The growth population in the city very fast because the migration people from the village, and lack of affordable housing, so much people don't get a decent place (Sari et al, 2018). The activities around the Baru Barat River are office, workshop, schools, dealers, food stall, laundry, shops, beauty salons, guesthouses and gas stations (Table 1). The main pollutant source of the high population density is garbage and waste water. So far the government has made good efforts to manage waste in subdistricts along Kali Baru Barat. However, in some places there are still illegal waste points or temporary garbage storage sites that are not transported according to the specified time. As a result, waste will be degraded and produce leachate. Leachate that is formed will be carried by runaway water and into the river. Likewise, garbage can enter the river carried by the wind or running water. Consequently it will cause pollution to the river.
According to the Minister of Environment and Forestry Regulation No. 68 of 2016, every activity that produces domestic wastewater is obliged to treat the domestic wastewater it produces. But in general the activities that produce domestic wastewater, have not yet treated wastewater. Some who have already done so are offices and guesthouses.
Organic waste comes from housing, schools and food stalls. While inorganic waste comes from workshop, laundry, dealer and beauty salon activities. This waste source will add organic concentrations of BOD, COD, surfactants, TDS oils and fats in the waters.
Sources of pollutants from office, shopping, and school activities will produce organic waste, and inorganic waste such as paper, bottles and plastic packaging. Pollutants from housing, food stalls, and guest houses will produce black water, gray water, organic waste (food scraps) and detergent waste.
Sources of pollutants originating from salons, laundry, gas stations, dealers and workshops will produce phosphate waste in detergents, gray water waste, infiltrated solid particles and chemical compounds. This pollutant source will make the waters become smelly, can kill aquatic organisms and can cause eutrophication.
Based on the identification results, all points show that riverbank activities have the potential to water pollution cause organic, inorganic, and suspended solids enter the waters.
People who live Along the river edge and don't have land threatened to be displace and high social vulnerability occurs because the population doesn't get basic services (Sari et al, 2018).
The changing of land and increase the size of the population would cause the quality of water in water catchment areas, being vulnerable and being by human activity and pollution in the water catchment areas. (Pullanikkatil et al, 2015).
From the table 2-4 it can be seen that the BOD, COD and phosphate parameters at all sampling points exceed the quality standards. Input from drainage channels that carry pollutants from various activities to Kali Baru Barat has an influence on the quality of the water. Many household pollutants contain organic and organic pollutants such as detergents, cleaners, disinfectants and so on. These pollutants are persistent and require a long time to decompose naturally.
Total Suspended Solid (TSS) in Baru Barat River ranges from 7-100 mg/L. TSS Quality Standard of 100 mg/L. TSS in Kali Baru Barat is still below the quality standard in general, These suspended solids can be inorganic and organic particles. Inorganic particles such as mud, clay and other soil components that are brought into the waters through runoff water from open land. Whereas organic particles come from pollutants that are biologically degraded. TSS causes turbidity in water, is insoluble and cannot settle directly.
TSS criteria is inportance to define time-varying for surface water. TSS is dynamic in the river, the eposure duration and the ecotoicological sunbstances bonded to TSS. The characteristic of the receiving water play an impostant role in estimating risk of TSS (Rossi et al, 2006). TSS exposure significantly decreased the survival rate of the fishes (Nyanti et al, 2018). Increasing the load of TDS and TSS can reduce the quality of aquatic ecosystems through several mechanisms. TSS will increase water turbidity due to reduced light penetration which it's damages the photosynthetic activity of aquatic plants and decreases the oxygen content in water (Butler and Ford, 2018).
The total concentration of Total Disolve Solid (TDS) in Baru Barat River ranges from 98-601 mg/L with a quality standard of 500 mg/L.The TDS value is still below the quality standard, in general. The source of the pollution comes from settlements, restaurants whose waste contains solids dissolved from soap and garbage from activities around the river.
TDS contain minerals and organic molecules that provide benefits such as nutrients or contaminants such as toxic metals and organic pollutants. Changes in TDS concentrations in natural waters often result from industrial effluent, changes to the water balance and should be based on the effect of the ion on fertilization and egg development of aquatic organisms (Scannell and Duffy, 2007).
Dissoleved Oxygen (DO) concentration in Kali Baru Barat ranged from 0.8-4.6 mg/L with a standard quality of 3 mg/L. DO values are small and not in accordance with quality standards. This is caused by the entry of organic pollutants from settlements, restaurants, markets and so on. Degradation of organic matter will reduce DO value.
Fish habitat and a critical measure of stream health are affected by dissolved oxygen. Low dissolved oxygen is caused by exploitation of water resources and continued land use intensification (Franklin, 2014).
BOD concentrations in Baru Barat River ranged from 8.4-43.7 mg/L with a quality standard of 10 mg/L and COD ranged from 16-99.2 mg/L with a quality standard of 20 mg/L. Concentrations of BOD and COD that exceed quality standards at almost all sampling points are due to the large amount of organic material in the waters around the river that is sourced from domestic waste.
Point source, non point source and land development will add concentration values of NH3-N, BOD and COD, (Chowdhury et al, 2018). Water quality is affected by land use and anthropogenic activities on river banks (Suratman and Norhayati, 2013) The decomposition of organic substances in the sediment of need oxygen , this will disrupting the lives of fish and an organism benthic (Catianis et al, 2018). Human activities that disturb the waters will affect the quality of the waters and services provided by, aquatic ecosystems (Shen et al, 2017).
The bad impact of water pollution is the entry of pollutants into the food chain and can enter humans. Pollution needs to be controlled to improve the quality of the waters, the need for characteristics of organic concentrations in the waters to minimize the impact due to the decline of water quality (Wang et al, 2015). Water quality monitoring is needed to control pollution and measures to conserve water resources to support better ecological conditions. The DO water quality variable shows the freshness level of water and has a potential influence on river biota. COD detects water contamination due to domestic and industrial wastewater (Saraswati et al, 2019).
Tabel 1. Total population each district and activities around the river
| Sampling | District | Wide of | Population Total Density | Activities at riverbank | ||||||||||
|---|---|---|---|---|---|---|---|---|---|---|---|---|---|---|
| point | Area (km2 )* | Population* (peopel) | (people/km2 ) | 2 | 3 | 4 | 5 | 6 | 7 | 8 | 9 | 10 | ||
| 1 | Jagakarsa | 24,87 | 390,272 | 15,692.481 | 4 | 8 | 2 | 10 | 3 | |||||
| 2 | 4 | 1 | 1 | 1 | ||||||||||
| 3 | Pasar Minggu | 21,69 | 307,249 | 14,165.468 | 1 | 9 | 12 | |||||||
| 4 | Pancoran | 8,63 | 154,693 | 17,925.029 | 5 | 5 | 4 | 1 | 8 | |||||
| 5 | 4 | 1 | 2 | 4 | 1 | 1 | ||||||||
| 6 | Tebet | 9,03 | 211,287 | 23,398.339 | 9 | 5 | 2 | 8 | 5 | 1 | ||||
| 7 | Setia Budi | 8,85 | 140,985 | 15,930.508 | 8 | 12 | 1 | 7 | 4 | 1 | 1 | |||
Source:*) Jakarta Statistics Agency 2017
Information: 1. Office, 2. Workshop, 3. School, 4. Dealers, 5. Food stall, 6. Laundry, 7. Shop, 8. Beauty Salon, 9. Guesthouse, 10. Gas stations
Table 2. Water quality of Baru Barat River at April 2019
| No. | Parameter | Unit | Sampling point at April | |||||||||
|---|---|---|---|---|---|---|---|---|---|---|---|---|
| 1 | 2 | 3 | 4 | 5 | 6 | 7 | ||||||
| 1 | Temperature | (ºC) | 27 | 28 | 28 | 29 | 28 | 29 | 30 | normal water temp | ||
| 2 | TSS | mg/L | 60 | 40 | 100 | 40 | 30 | 100 | 40 | 100 | ||
| 3 | TDS | mg/L | 98 | 100 | 143 | 114 | 124 | 138 | 186 | 500 | ||
| 4 | DO | mg/L | 4.6 | 3.2 | 2.8 | 3.4 | 3.4 | 3.6 | 2.7 | 3 | ||
| 5 | pH | 7.1 | 6.8 | 6.8 | 6.9 | 7 | 7.1 | 6.9 | 6-8.5 | |||
| No. | Parameter | Unit | Sampling point at April | |||||||||
|---|---|---|---|---|---|---|---|---|---|---|---|---|
| 1 | 2 | 3 | 4 | 5 | 6 | 7 | ||||||
| 6 | COD | mg/L | 35.2 | 54.4 | 17 | 16 | 64 | 99.2 | 44.8 | 20 | ||
| 7 | BOD | mg/L | 18.5 | 29.7 | 12.9 | 10 | 26.9 | 43.7 | 19.6 | 10 | ||
| 8 | Phosphat | mg/L | 0.314 | 0.369 | 0.486 | 0.845 | 1.07 | 0.648 | 1.72 | 0.5 | ||
| 9 | Nitrate | mg/L | 0.064 | 0.069 | 0.031 | 0.015 | 0.11 | 0.026 | 0.707 | 10 | ||
Table 3. Water quality of Baru Barat River at Mei 2019
| No. | Parameter | Unit | Sampling point at | Quality | ||||||
|---|---|---|---|---|---|---|---|---|---|---|
| 1 | 2 | 3 | 4 | 5 | 6 | 7 | standard | |||
| 1 | Temperature | (ºC) | 27 | 28 | 28 | 29 | 30 | 29 | 30 | normal water temp |
| 2 | TSS | mg/L | 17 | 17 | 10 | 28 | 15 | 7 | 14 | 100 |
| 3 | TDS | mg/L | 136 | 119 | 144 | 159 | 148 | 114 | 168 | 500 |
| 4 | DO | mg/L | 4.5 | 1.7 | 3.8 | 2.1 | 2.7 | 4.3 | 2 | 3 |
| 5 | pH | 7.3 | 6.5 | 6.5 | 6.7 | 6.7 | 6.7 | 6.8 | 6-8.5 | |
| 6 | COD | mg/L | 16 | 25.6 | 41.6 | 28.8 | 48 | 83.2 | 25.6 | 20 |
| 7 | BOD | mg/L | 11.2 | 14.0 | 25.2 | 23.5 | 24.1 | 42.6 | 14.0 | 10 |
| 8 | Phosphat | mg/L | 0.20 | 0.21 | 0.71 | 0.81 | 0.74 | 0.48 | 1.18 | 0.5 |
| 9 | Nitrate | mg/L | 1.61 | 1.18 | 0.21 | 0.77 | 0.21 | 0.55 | 1.56 | 10 |
Table 4. Water quality of Baru Barat River at June 2019
| No. | Parameter | Unit | Quality | |||||||
|---|---|---|---|---|---|---|---|---|---|---|
| 1 | 2 | 3 | 4 | 5 | 6 | 7 | standard | |||
| normal | ||||||||||
| 1 | Temperature | (ºC) | 26 | 25 | 26 | 26 | 26 | 28 | 27 | water |
| temp | ||||||||||
| 2 | TSS | mg/L | 38 | 68 | 25 | 13 | 9 | 72 | 93 | 100 |
| 3 | TDS | mg/L | 195.5 | 235.5 | 601 | 222 | 183.5 | 242 | 336.5 | 500 |
| No. | Parameter | Unit | Quality | |||||||
|---|---|---|---|---|---|---|---|---|---|---|
| 1 | 2 | 3 | 4 | 5 | 6 | 7 | standard | |||
| 4 | DO | mg/L | 1.5 | 1.7 | 1 | 1.3 | 2.9 | 1.7 | 0.8 | 3 |
| 5 | pH | 6.9 | 6.8 | 6.5 | 6.8 | 7 | 6.5 | 6.8 | 6-8.5 | |
| 6 | COD | mg/L | 70.4 | 41.6 | 86.4 | 22.4 | 28.8 | 80.0 | 51.2 | 20 |
| 7 | BOD | mg/l | 28.0 | 22.4 | 39.2 | 8.4 | 9.5 | 22.4 | 11.2 | 10 |
| 8 | Phosphat | mg/L | 2.7 | 2.8 | 7.5 | 3.6 | 2.6 | 4.2 | 4.5 | 0.5 |
| 9 | Nitrate | mg/L | 0.09 | 0.09 | 0.10 | 0.09 | 0.09 | 0.11 | 0.08 | 10 |
Water Pollution Index at Kali Baru River
Water quality status is the level of water quality conditions that indicate polluted conditions or good conditions in a water source in time certain by comparing with the specified water quality standards. Water quality management based on this Pollution Index (IP) can provide input to decision makers in order to assess the quality of water bodies for an allotment and take corrective actions quality if there is a decrease in quality due to the presence of pollutants. In determining the Pollutant Index must determine the main locations of pollutant sources that contribute to the decline in water quality in the waters. Pollutant sources are point sources and non point sources (Dunca, 2018).
Tabel 5. Pollution Index (PI) of Baru Barat River
| 2019 | ||||||||
|---|---|---|---|---|---|---|---|---|
| Sampling point | April | May | June | |||||
| 1 | 4.59 | 2.76 | 9.97 | |||||
| 2 | 7.22 | 3.41 | 10.30 | |||||
| 3 | 4.66 | 6.13 | 27.12 | |||||
| 4 | 3.21 | 5.76 | 12.95 | |||||
| 5 | 6.65 | 5.89 | 9.39 | |||||
| 6 | 10.71 | 10.35 | 15.31 | |||||
| 7 | 6.42 | 4.38 | 16.29 | |||||
| Everage | 6.17 | 5.52 | 14.48 | |||||
| Present Status | 8.72 = Moderate polluted | |||||||
The calculation results show that PI is 8.72 where the level of pollution in the West Baru River is moderate polluted. Rivers are more vulnerable to pollution because of their role in bringing runoff from agriculture, urban wastewater and industrial waste (Huang et al, 2010). The main factors affecting river water quality are organic pollutants, pollution by fertilizers, hazardous and toxic substances, microbial pollutants and hydro morphological pressures that carry sediment (Gasparotti, 2013).
River water quality management can be effectively carried out if all parties are responsible for the sustainability of the function of the available resources. The problem at Baru Barat River is the presence of several illegal waste points left from activities that eventually enter the river and the absence of wastewater treatment.
The concept of community based waste management offers alternative waste management that is more integrated and efficient than conventional systems. The concept of waste management is at its source and empowers people to process valuable waste into goods of economic value.
Whereas one alternative to wastewater treatment that can involve the community in managing it is communal wastewater treatment. Considering that centralized processing cannot yet fully serve the population, communal processing is considered effective. Communal treatment is directed by the application of Wastewater Treatment Plants that are easy, inexpensive and integrated with the landscape. One of the wastewater treatment technologies that can be applied for settlement scale is artificial wetlands. Waste water (gray water) from households can be passed on artificial wetlands before entering the river. Thus household wastewater has been treated before entering the river.
CONCLUSION
The activities around the Baru Barat River are settlements, office, workshop, schools, deales, food stall, laundry, shops, beauty salons, guesthouses and gas station. BOD concentration range from 8.4-43.7 mg/L with a quality standard of 10 mg/L and COD range from 16-99.2 mg/L with a quality standard of 20 mg/L. Concentration of BOD and COD that exceed of quality standard at almost all sampling ponts. The results of Pollution Index (PI) is 8.72 where the level of pollution in the West Baru River is moderate polluted.