

INTRODUCTION
Since their introduction in 1930, the refrigerants based on chlor-fluor compounds, such as CFC and its family had taken a very important role in the development of refrigeration systems. This is due to their suitable physical and thermal properties as refrigerant. The chlor-fluor refrigerants also have some more desirable characters, such as: excellent stability, non-flammable, non-toxic, compatible to most component materials used in refrigeration systems, and relatively inexpensive. But, after realizing that CFC causes the ozone depletion, then, through several conventions i.e. Vienna Convention (March 1985), Montreal Protocol (September 1987) and their amendments, the use of ODS is being banned [1].
CFC-12 refrigerant was one of the most common refrigerants in Indonesia. Therefore, the ban of this refrigerant resulted a big impact on the application of CFC-12 in many refrigeration systems and finding the substitute of CFC-12 is very critical. Although there are some substitutes of CFC-12, there is a tendency on the use of R-134a as CFC-12 substitute since R-134a is the first CFC-12 substitute that is available in the Indonesian market and it has some good properties, such as non-toxic, non-flammable, and relatively stable. Besides these advantages, R-134a has some disadvantages such as: it is not a drop-in substitute to CFC-12, relatively expensive, has significant GWP, very often it is less efficient than CFC-12. For Indonesia and other humid tropical countries, the synthetic lubricant required by this refrigerant very often causes problems due to its hygroscopic property.
These disadvantages of R-134a have pushed Institute of Technology of Bandung (ITB) to revisit the old ideas of using natural refrigerants, such as hydrocarbon (HC), ammonia, or CO<sub>2</sub>. Since early of 1990s, ITB has been investigating the application of hydrocarbon refrigerants as substitute of CFC-12 [2-10]. The HC refrigerant has good features such as it is a drop-in substitute of CFC-12, generally more efficient that CFC-12 or R-134a, good compatibility to most common materials used in refrigeration systems, its raw materials are available in Indonesia, and it is has a competitive price.
ITB has been concentrating their hydrocarbon refrigerant research mainly on the mixtures of propane, nbutane, and isobutane as CFC-12 substitute [4-10]. These hydrocarbon refrigerants are commonly called as propane - natural butane (PNB) refrigerants. The PNB was intensively investigated because its three components exist in Indonesian natural gases and its preliminary test showed its good performance. The research done by ITB was adopted by all Indonesian producers of HC refrigerants, therefore all of Indonesian HC refrigerants are also PNB refrigerants. This paper reports performance comparisons of Indonesian PNB refrigerant to CFC-12 and propane-isobutane (PIB) refrigerant. The performance comparisons were done during the development of the PNB refrigerant in the Thermodynamics Laboratory of IURC-ES ITB, during its field test, and recently in the Laboratory for Thermodynamics, Engines and Propulsion System LTMP-PUSPITEK Serpong as a reconfirmation of previous tests.
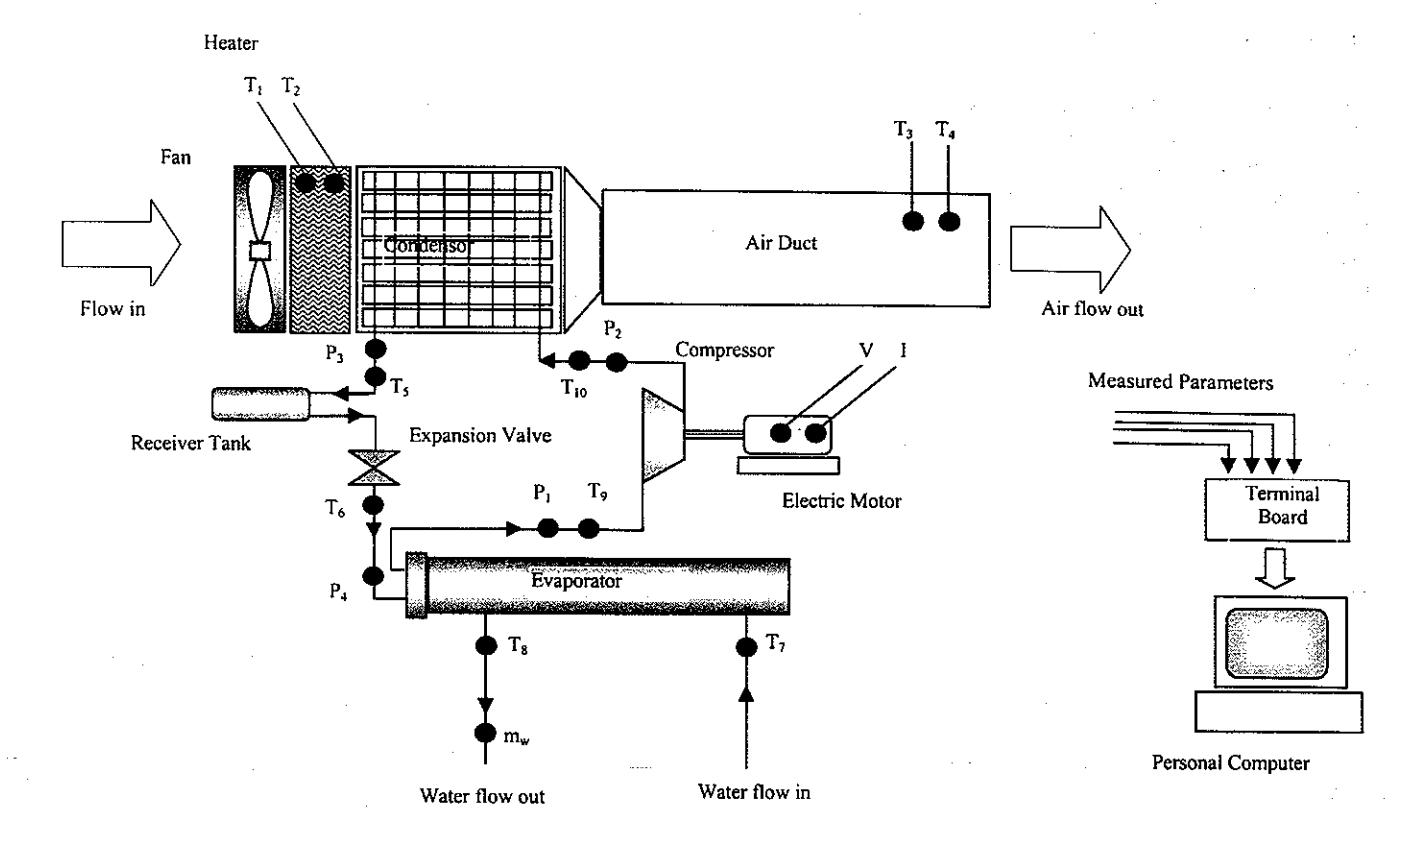
Fig.1 Schematic diagram of ITB test equipment
PERFORMANCE TEST IN IURC-ES ITB
A series of experiments has been done to find the best PNB composition to substitute CFC-12 and to find the best HC refrigerant charge. The experiments utilized a refrigeration test system (see Fig. 1). The system is driven by a 3 HP open type compressor. The electric power consumed by the compressor is measured by measuring its current and voltage. Air is driven by a fan to cool the condenser, then the air is flowed through to a duct which is equipped with a dry and wet thermometer so that the air temperature and relative humidity can be measured. The refrigerant is flowed through a shell-and-tube heat exchanger that acts as an evaporator. The evaporation energy is obtained from the water that is flowed through the shell-side of the evaporator. To measure the evaporation energy, the water temperatures at the evaporator inlet and outlet are measured. The system is also equipped with several temperature and pressure sensors, so that the refrigerant states at several locations can be obtained. These refrigeration states are needed to evaluate the system performance (in term of its coefficient of performance, COP).
Before the system can be used to test the performance of hydrocarbón (propane-butane) refrigerant, the system has to be run with CFC-12. The CFC-12 charge that gives the best performance and its COP has to be experimentally determined. Then, the amount of CFC-12 charge and its COP value were taken as a charge and COP reference when compared to the PNB performances. Based on the experiment, it was found that the CFC-12 optimum charge (refrigerant charge reference) for the system is 3.58 [8,10].
After the reference refrigerant charge and reference COP had been obtained, then the system was used for comparing performances of various compositions of PNB refrigerant. Four different PNB compositions were used in the experiment, namely sample A through D. These refrigerant samples have the similar saturation characteristics to those of CFC-12. For every PNB composition that was used, the system was run with various refrigerant charges. By comparing values of COP that were obtained at those refrigerant amounts, the best performance for every refrigerant composition can be obtained.
The influence of refrigerant charge to the system COP for various refrigerant compositions is shown in Fig. 2. The system performance shown in the figure is the COP evaluated on the refrigerant side (COP<sub>Ref</sub>). Due to high pressure limitation in the system, the experiment was done with refrigerant charge less than 1600 grams. The figure shows that all refrigerant samples have the same COP-refrigerant charge curves, i.e. COP increases with increasing refrigerant charge. When the refrigerant charge is increased, at first - for small amount of refrigerant
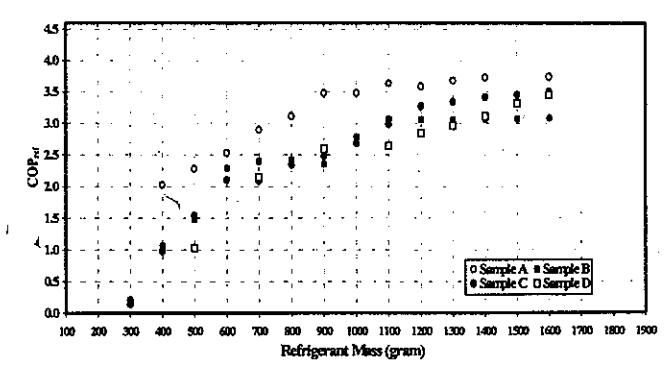
Fig. 2 Influence of refrigerant charge on system performance (Average condenzation temperature = 30 °C)
charges - the COP sharply increases, then it increases slower with larger refrigerant charges, and finally becomes practically constant at large refrigerant charges. It can be concluded that the necessary amount of PNB refrigerant charge is between 1300 and 1600 grams, which are associated with 28.2 and 35 percents of CFC-12 (reference) charge, respectively.
The performance characteristics plot, i.e. COP<sub>Ref</sub> versus evaporating temperature, for various samples are shown in Fig. 3. The figure shows that refrigerant sample A and C can be considered as the refrigerant with best compositions with COP<sub>Ref</sub>'s that are significantly larger than the one of CFC-12. Although in average COP<sub>Ref</sub> of sample C is smaller than the one of sample A (see Fig.. 2), sample C is still considered as a good refrigerant since it works with lower evaporating temperatures compared to sample A.
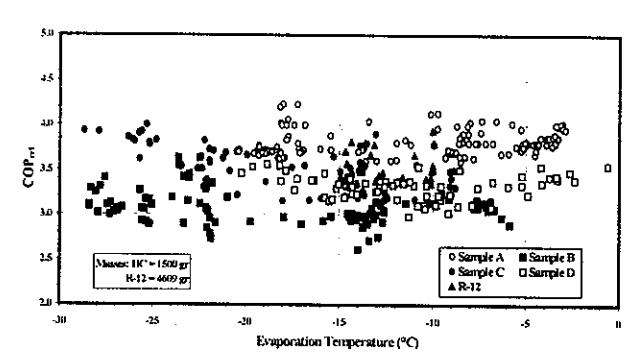
Fig. 3 Comparison of refrigerant performance (Average Condensation Tennerature = 30°C)
PERFORMANCE FIELD TEST
As a field test, the PNB refrigerant developed by ITB was tested in a milk cooler unit. In the test, performance of developed PNB was compared to performance of PIB and CFC-12. Detailed descriptions of the test are explained in other papers [5-8, 10, 11]. The results of the field test are summarized in Table 1.
Table 1 Comparison of system performance with PIB, PNB and R-12
| PIB | PNB | R-12 | |
|---|---|---|---|
| Consumed Electrical Energy, kWh | 29.0 | 27.2 | 32.75 |
| Effective COP | 1.9 | 2.0 | 1.7 |
| Run Time, second | 165 | 156 | 193 |
| Cooling Rate, °C/sec | -0.115 | -0.122 | -0.098 |
The test showed that both PIB and PNB consume less energy compared to CFC-12 in order to give the same cooling. PIB and PNB consume 29.0 and 27.2 kWh respectively, but R-12 consumes 32.75 kWh to cool down the water inside the milk/tank. Considering this fact, we can conclude that both PIB and PNB are 11.5 and 16.9 % more efficient than CFC-12, respectively. The effective coefficient of performance system, which is defined as the ratio of gained cooling energy to consumed electrical
energy, obtained from the test with PIB, PNB and CFC-12 are 1.9, 2.0 and 1.7, respectively.
PERFORMANCE TEST IN LTMP SERPONG
The PNB refrigerant that has been developed by IURC-ES ITB was adopted by an Indonesian refrigerant producer and was produced with as HYCOOL* HCR-12 refrigerant. To reconfirm the test results that have been previously obtained, a series of tests were done in LTMP Serpong. In these tests, performance of the HCR-12 refrigerant was compared to an European PIB refrigerant, and CFC-12.
The laboratory equipment in LTMP Serpong has better controllability compared to the equipment in IURC-ES ITB. A schematic diagram of the test facility in LTMP Serpong is shown in Fig. 4. The system consists of a primary (or refrigeration) loop. The refrigerant mass flow rate in this loop can be controlled and measured. The condenser of the primary loop releases heat to a secondary closed loop where the heat is transported to a water chiller heat exchanger and the heat is rejected there. This secondary loop controls the condenser operation temperature. The evaporator of the primary loop was installed at the end of an air duct so that the load of the evaporator, i.e. the refrigeration load of the primary loop can be controlled. The evaporator temperature of the primary loop is also controllable. Detailed descriptions of the test facility and procedure are given in another paper [11].
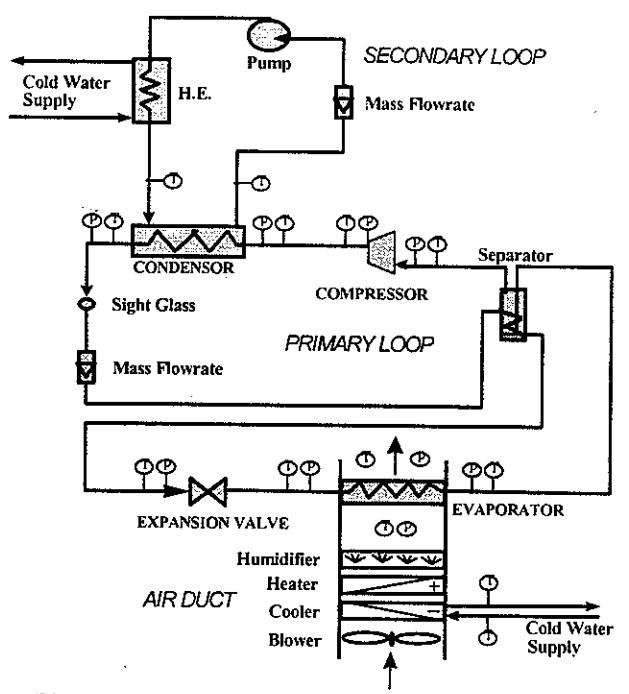
Fig. 4 Schematic diagram of LTMP test equipment
Table 2 Refrigerant comparison with air temperature at 27 °C
| Refrigerant | Evap. Press kPa | Cond Press KPa | Press Ratio | Refr. Load kW | Elec. Power kW | COP |
|---|---|---|---|---|---|---|
| CFC-12 | 286 | 1108 | 3.87 | 19.8 | 12.0 | 1.65 |
| HCR-12 | 300 | 1012 | 3.75 . | 21.5 | 11.7 | 1.84 |
| PIB | 292 | 947 | 3.63 | 19.1 | 11.3 | 1.69 |
Table 3 Refrigerant comparison with air temperature at 22 °C
| Refrigerant | Evap. Press kPa | Cond Press kPa | Press Ratio | Refr. Load kW | Elec. Power kW | COP |
|---|---|---|---|---|---|---|
| CFC-12 | 282 | 1103 | 3.91 | 19.2 | 11.9 | 1.61 |
| HCR-12 | 297 | 1010 | 3.76 | 21.2 | 11.6 | 1.83 |
| PIB | 291 | 944 | 3.64 | 18.8 | 11.2 | 1.68 |
Summaries of test results for air temperatures at the evaporator entrance of 27 and 22 °C are given in Tables 2 and 3, respectively. These tables show that both HYCOOL HCR-12 and PIB worked with lower compressor pressure ratios and lower electric power than CFC-12. The tables also show that among the three refrigerants, HCR-12 had the largest refrigeration load, and PIB had the smallest refrigeration load. HCR-12 also had the largest effective COP, followed by PIB and CFC-12 had the smallest effective COP. From theses figures we can conclude that compared to the effective COP of CFC-12, HCR-12 showed about 12% higher effective COP, and PIB showed about 3% higher effective COP.
CURRENT DEVELOPMENT OF INDONESIAN HC REFRIGERANT
From experiences in laboratory, field tests and applications, it turns out that the performance of developed PNB is excellent, its energy 'efficiency' is very high, usually higher than the ones of PIB and CFC-12. The major limitation of the PNB refrigerant, and also of other HC refrigerants, is their flammability. Recently, IURC-ES ITB has developed a modified PNB, which is called as HCR-12*LFS, that has higher Lower Explosion Limit (LEL) compared to LEL of ordinary PNB.
The performance of HCR-12+LFS has been compared to the performance of CFC-12 or HCR-12. A detailed description of the performance test, i.e. its equipment, procedure, and results are given in an other paper [11]. Among HCR-12, HCR-12+LFS and CFC-12, PNB refrigerant HCR-12 has the highest COP, and COP of HCR-12+LFS is very similar to the COP of CFC-12. It is need to be explained that the HCR-12+LFS refrigerant is still being developed/improved.
CONCLUSIONS AND RECOMMENDATION
The test results consistently show that HCR-12, i.e. PNB, has better COP compared to PIB and CFC-12. But, it is not yet clear the reason why PNB has better COP. It might be related to the presence of normal butane in the mixture. It is need further investigation to determine the reasons.
It needs to be stressed that the results discussed here are specifically for refrigerants used in the tests, i.e. the refrigerants that we made in IURC-ES ITB or
HYCOOL. Since the performance of a refrigerant depends on its composition, impurities, etc, therefore the results that are discussed here may not be generalized for every PNB refrigerants.
ACKNOWLEDGMENT
The research that was done in IURC-ES ITB was supported by URGE Project, Directorate General of Higher Education, Ministry of Education and Culture, Indonesia. The research in LTMP was financially supported by Swisscontact and its test facilities were provided by LTMP. Therefore, the authors gratefully acknowledge those parties that have supported the research.