

1. INTRODUCTION
Since found in 1930, CFC (Chloro-Fluoro-Carbon) refrigerant had a very important role in the development of refrigeration systems. This happened because of its suitable physical and thermal properties as a refrigerant, and it is a stable, non-flammable, non-toxic, and relatively inexpensive substance.
In 1974, Rowland and Molina discovered ozone depletion and published their hypothesis that some materials, which are called as ODS (Ozone Depleting Substances), including CFC cause the ozone depletion. Then, through conventions such as Vienna Convention (March 1985), Montreal Protocol (September 1987) and their amendments, people try to ban the use of ODS. On 13 May 1992, Indonesia ratified the Vienna Convention and Montreal Protocol, and banned the CFC import to Indonesia starting at the beginning of 1998.
R-12 refrigerant is one of the most common refrigerants in Indonesia. Therefore, the ban of CFC has a big impact on the application of R-12 in many
refrigeration systems and the substitute of R-12 is very critical. Although there are some substitutes of R-12, there is a tendency that people propose R-134a as R-12 substitute since R-134a is the first R-12 substitute that is available in the Indonesian market and it has some good properties, such as non-toxic, non-flammable and relatively stable. Besides these advantages, R-134a has some disadvantages such as it is not a drop-in substitute to R-12, relatively expensive, has a potential to cause global warming effect (has significant GWP), and has to be imported.
Other alternatives for R-12 are hydrocarbon refrigerants, such as PIB (propane/Iso-butane), or PNB (propane/n-butane). Although these refrigerants have some advantages such as drop-in substitute to R-12, friendly to the environment (zero ODP and negligible GWP), relatively inexpensive, the raw materials are available in Indonesia, and technically can be produced in Indonesia, these refrigerants are not commonly known in Indonesia.
Considering the phasing out of R-12 at the beginning of 1998, it is expected that gradually some refrigeration systems that operate on R-12 have to be replaced or retrofitted. One industry that uses refrigeration machine in its activity is dairy industry. In Indonesia, this industry is run by dairy cooperatives.
Around 100,000 Indonesian dairy farmers are members of small and medium scale dairy cooperatives. The R-12 phase out will have a strong impact to the cooperatives, since their milk cooling systems operate on R-12 refrigerant. There are 203 dairy cooperatives in Indonesia and most of them cannot afford to replace their milk cooling systems to R-134a systems. This condition makes the application of hydrocarbon refrigerants to milk cooling systems becomes more interesting.
2. RESEARCH ON APPLICATION OF HYDROCARBON REFRIGERANT
Research on refrigerant mixture has been done in ITB since 1984. The research was done in Refrigeration, Air Conditioning, and Cryogenics Laboratory of the Mechanical Engineering Department. The research focused on the mixture of CFC and HCFC refrigerants. Research on hydrocarbon refrigerant mixture started in 1994 in Thermodynamics Laboratory, IURC- ITB. The research covers the thermodynamics properties of the mixtures, run tests of the refrigerants on small scale and medium scale laboratory test benches. The good and promising results obtained from the laboratory tests and the need of alternative refrigerants by the dairy industry have encouraged the researchers to apply the hydrocarbon refrigerant on a larger system i.e. the milk cooling system. The first research on application of hydrocarbon refrigerant on a milk cooling system was done on Ujung Berung Cooperative's (KUD Sinar Jaya) milk-cooling system in 1996. The research grant obtained from Directorate General of Higher Education, Indonesian Ministry of Education and Culture, and the refrigerant was provided by PERTAMINA Directorate of Processing (Propane/N-butane) and ECOZONE -Swisscontact (Propane/I-butane).
2.1 Research Objectives
In this research project a milk cooling system designed for R-12 refrigerant has been retrofitted and switched to hydrocarbon refrigerants, which are Propane/I-butane (PIB) and Propane/N-butane (PNB). The research has two major objectives:
- 1. To compare the performance of the milk cooling system if it is operated with R-12, PIB and PNB refrigerants, and
- 2. To popularize the application of hydrocarbon refrigerants in Indonesia.
The main performance parameters investigated in the research are electrical energy consumption, rate of tank temperature change, and coefficient of performance of the system.
2.2. Test Equipment and Procedure
The research was conducted by partially adopted ISO 5708 milk cooling test standard. The research cannot fully follow ISO 5708 since there are some limitations in controlling the operating parameters. For examples, the ambient air temperature was not controlled and there was a limitation in the water supply flow rate. Some test procedures that were recommended by ISO 5708 were not relevant to the current research, for example the tank thermal insulation test. Therefore those test procedures were not done in the research.
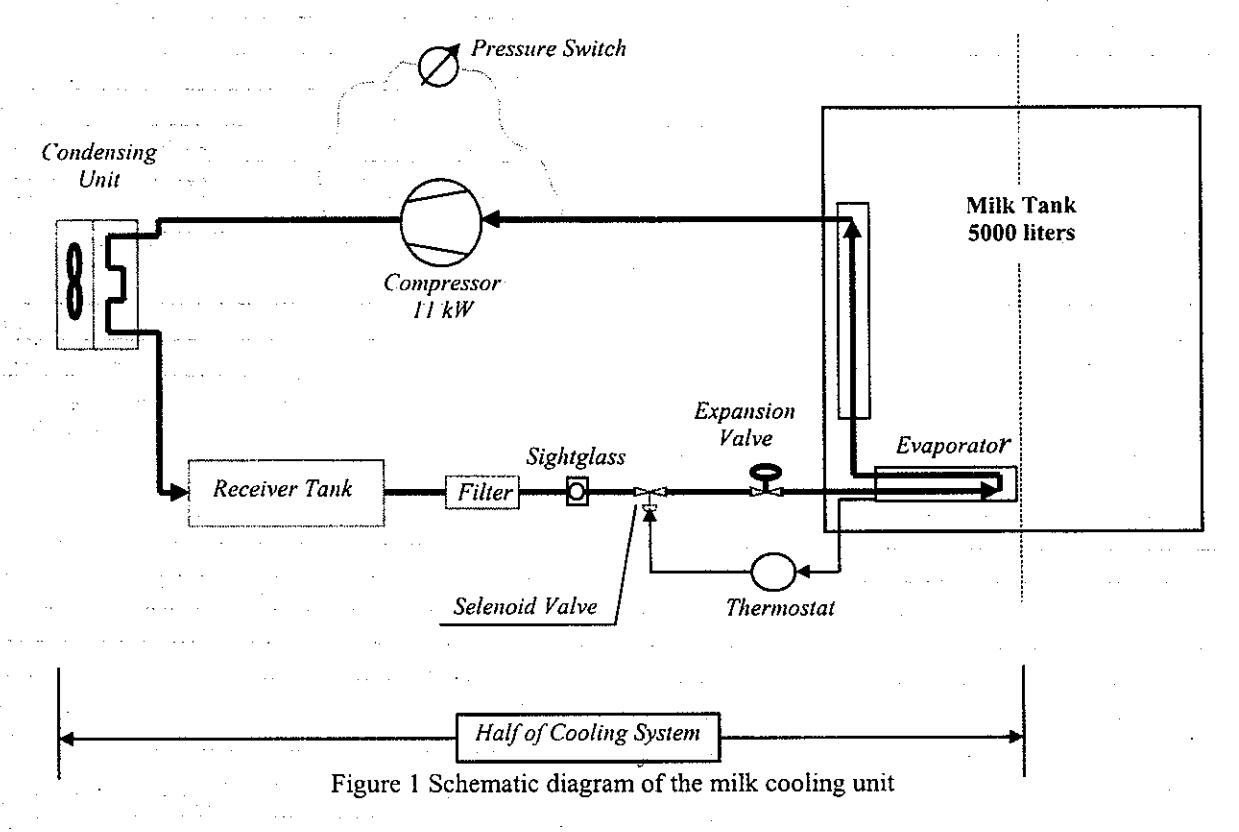
A milk cooling unit made by NDA Engineering, New Zealand was used in the research. The milk-cooling unit is schematically shown in Fig. 1. Basically, the milk cooling unit consists of two identical refrigeration loops and a 5000 liter milk tank. Each refrigeration loop is driven by a 11 kW, 3-phase electrical motor and can be operated independently.
ISO 5708 recommends to use water as the cooled substance, instead of milk. It is recommended that the milk tank is filled with 35°C water up to its full capacity. But in the current research there was a limitation in the water supply, so that the test was done with only one refrigeration loop operated, and the tank was filled only to half of its capacity, i.e. 2500 liters. Because of the limitation in water heater capacity, the water temperature was set close to the ambient air temperature, i.e. to 23°C.
At the beginning of each test run, the tank was filled with 2500 liters of water. Then, one refrigeration loop was operated until the tank temperature reached 4°C when the cooling unit automatically stopped. At the beginning and at the end of each test run, and at every ten minutes during the performance test, the following measurements were done:
- The temperature inside the tank was measured by using a type K thermocouple and an "Autotherm" thermocouple display unit,
- 2. The electrical energy consumption was measured by using a kWh-meter,
- The cooling system pressures at the compressor suction and discharge by using pressure gages, and
- 4. The test run elapse time by using a digital stopwatch.
To compare the performance of the system with different refrigerants, the performance test was repeatedly done with R-12, PIB and PNB refrigerants.
2.3. Test Results
The electrical energy consumed by the system during the test for each refrigerant are shown in Fig. 2. From that figure it is clearly seen that the electrical power (reflected as the slope of Fig. 2) is almost independent from the type of refrigerant that is used in the system. Although the power consumption is almost independent from the type of refrigerant, the consumed electrical energy is strongly influenced by the refrigerant used in the system. Both PIB and PNB refrigerant consume less energy compared to R-12 in order to give the same cooling effect. PIB and PNB consume 29.0 and 27.2 kWh respectively, but R-12 consumes 32.75 kWh to cool down the water inside the milk tank. Considering these facts, we can conclude that both PIB and PNB are 11.5 and 16.9 % more efficient respectively than R-12.
The effective coefficients of performance systems, defined as the ratio of gained cooling energy to consumed electrical energy, obtained from the tests with PIB, PNB and R-12 are 1.9, 2.0 and 1.7 respectively.
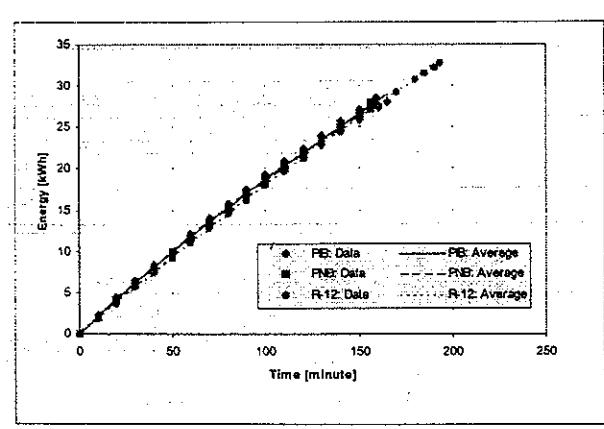
Fig. 2. Cumulative electrical energy consumption for different refrigerants.
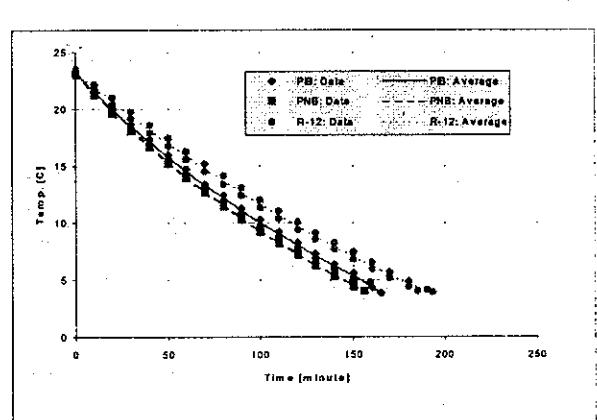
Fig. 3. Rate of temperature change for different refrigerants.
Similar results were also obtained in term of rate of temperature change as shown in Fig. 3. The figure shows the history of water temperature inside the milk tank during the tests for the three refrigerants. The times that were needed to cool down the water from 23°C to 4°C with PIB, PNB and R-12 are 165, 156 and 193 seconds respectively, that are associated with the rates of temperature change of -0.115, -0.122 and -0.098 °C/sec, respectively.
To give a clear comparison of the system performance with the three refrigerants, the obtained test results are summarized in the following table.
Table 1. Comparison of System Performance with PIB, PNB and R-12
| PIB | PNB | R-12 | |
|---|---|---|---|
| Consumed | 29.0 | 27.2 | 32.75 |
| Electrical Energy, | |||
| kWh | |||
| Effective COP | 1.9 | 2.0 | 1.7 |
| Run Time, second | 165 | 156 | 193 |
| Cooling Rate, | -0.115 | -0.122 | -0.098 |
| °C/sec |
2.4 Test Conclusion
The research showed that propane-butane mixtures were successfully applied in a milk-cooling unit as drop-in substitutes of R-12 refrigerant. The propane-butane refrigerants can be directly applied to a system designed for R-12 without any system modification.
Among the three refrigerants compared in the research, it was found that propane/n-butane (PNB) gives the best system performance, propane/I-butane (PIB) gives slightly worse performance compared to propane/N-butane, and R-12 gives the worst performance. The application of PNB reduces 16.9% energy consumption, while PIB reduces 11.5% energy consumption compared to R-12.
3. RESULTS OF HYDROCARBON REFRIGERANT RETROFITTING ON OTHER MILK COOLING SYSTEMS
The good performance and reduced energy consumption showed by the Ujung Berung milk-cooling system has encouraged other cooperatives to retrofit their milk-cooling systems with hydrocarbon refrigerant. The results of hydrocarbon retrofitting on some milk-cooling units promoted by Swisscontact are shown in Tables 2 to 6.
4. CONCLUSION
The test results and data observations done on several milk-cooling unit retrofitted by hydrocarbon refrigerant show that the use of hydrocarbon refrigerant reduces:
- the refrigerant charge to the system up to 40% of CFC refrigerant,
- the discharge pressure,
- · the energy consumption, and
- the electric motor current,
- and increases:
the cooling rate and the rate of temperature decreas.
5. ACKNOWLEDGMENT
The research was conducted in dairy cooperative KUD Sinar Jaya. The PNB refrigerant was provided by PERTAMINA, and the PIB refrigerant was provided by ECOZONE, the Netherlands and Swiss Contact-SMEP, Malang. The research was supported by URGE Project, Directorate General of Higher Education, Ministry of Education and Culture, Indonesia. The test data of other milk-cooling units were obtained from Swisscontact-SMEP. Therefore, the authors gratefully acknowledge those parties that have supported the study.
6. REFERENCES
- 1. Ardiansyah, W, 1994, Application of Propane n-Butane Mixture as R-12 Refrigerant Substitute, Bandung, Institute of Technology Bandung, (Indonesian).
- Suwono, A., Samudro, H.M. Tandian, N., and Ardiansyah, W., 1995, Theoretical and Experimental Study of the Aplication of proipane/n-butane Mixture as Refrigerant Replacing R-12, 19<sup>th</sup> International Congress of Refrigeration Proceedings, Vol. IVa, p. 552
- 3. Suwono, A., Pasek, A.D., and Tandian, N.P., 1996, Development of the Application of Propane/n-Butane Mixture as CFC-Refrigerant Substitute, Seminar on Alternative Refrigerants, Bandung, (Indonesian).
- 4. -----, 1981, International Standard ISO 5708: Refrigerated Bulk Milk Tanks, ISO, Switzerland.
Table 2 Test result HC retrofitting* (KUD Puspo together with Nestle September 1996) 1x12HP/1x9kW
| R22 | Propane | Difference | |
|---|---|---|---|
| Running time | 4.0 Hour | 4.1 Hour | +2.5% ⊕ |
| Temperature of Content (water 4000 liter) | 253.5°C | 253.5°C | - |
| Cooling Gradient δT/δt | 5.4°C/hr | 5.2°C/hr | +3.7% ⊕ |
| НР | 15.6 Bar | 13.7 bar | -12.2% © |
| LP | 2.4 Bar | 2.6 Bar | +8.3% ⊕ |
| HP/ LP | 6.5 Bar | 5.3 Bar | -18.5% ◎ |
| Pipe temperature HP side | 36.4°C | 36.5°C | +0.3% 😩 |
| Pipe temperature LP side | 10.5 Bar | 10 Bar | -5% ◎ |
| Refrigerant charge | 15.1 kg | 8.6 kg | -43% © |
| Power Consumption | 33.7 kWh | 28.9 kWh | -14.2% © |
| Power | 8.42 kW | 7.05 kW | -16.3% ◎ |
| Current | 16 A | 13 A | -18.8% ☺ |
| Efficiency (COP) | 2.98 | 3.47 | +16% ◎ |
*) Source: se
Table 3 Test result HC retrofitting*
(PT. Cijangel, August 1996)
Hermetic Compressor, 2HP/ 1.5 kW
| R12 | Propane | Difference | |
|---|---|---|---|
| Running time | - | - | |
| Temperature of Content (milk 500 liter) | 2°C | 2°C | - |
| Cooling Gradient δT/δt | • | _ | |
| HP | 235 psig | 195 psig | -17% ☺ |
| LP | 25 psig | 25 psig | +0% 😩 |
| HP/ LP | 9.4 psig | 7.8 psig | -3.8% ☺ |
| Pipe temperature HP side | _ ~ | - | - |
| Pipe temperature LP side | - | ||
| Refrigerant charge | 5 kg | 2 kg | -60% ☺ |
| Power (calculated) | 3.2 kW | - 2.0 kW | -37% ☺ |
| Phase Current | 3.5 A | 2.2 A | -37% ☺ |
| Efficiency (COP) | - | 27780 |
*) Source: the smeet
Table 4 Test result HC retrofitting* (KUD Tanjungsari Oct 97)
1x15HP/1x11kW engine
| R22 | Propane | Difference | |
|---|---|---|---|
| Time used to build up ice bank | 15.0 Hours | 11.0 Hours | -27% 😊 |
| Cooling Gradient δT/δt (with 2 units) | 1.73°C/hr | 2.36°C/hr | +36% ☺ |
| HP | 220 psi | 180 psi | -18% ☺ |
| LP | 25 psi | 25 psi | +0% ⊕ |
| HP/LP | 8.8 psi | 7.2 psi | -18% © |
| Pipe temperature HP side | - | - | - |
| Pipe temperature LP side | - | - | |
| Refrigerant content | 50 kg | 20 kg | -60% © |
| Power consumption (inc.lights&others) | 407 kWh | 287 kWh | -29% © (acc. PLN-16%) |
| Power | 27.1 kW | 26.1 kW | -3.7% ⊜ |
| Current/ phase | 29.7 A | 28.6 A | -3.7% ⊕ |
| Efficiency (COP) | - | - | - |
Remark: Superheat adjusted for HC
*) Source:
Table 5 Test result HC retrofitting* (KUD Cikajang Garut Nov 97) 2x30HP/2x22kW engines
| R22 | Propane | Difference | |
|---|---|---|---|
| Time used to build up ice bank (2 cooling units) | 15.0 Hours | 12.0 Hours | -20% ☺ |
| Cooling Gradient δT/δt (with 2 units) | 1.73°C/hr | 2.16°C/hr | +25% ☺ |
| HP | 210 psi | 170 psi | -19% © |
| LP | 18 psi | 18 psi | +0% 😑 |
| HP/ LP | 11.6 psi | 9.44 psi | -18.6% © |
| Pipe temperature HP side | - | • | |
| Pipe temperature LP side | - | - | - |
| Refrigerant content/ unit | 50 kg | 19 kg | -62% 😊 |
| Power consump./ 1 unit (calculated) | 342 kWh | 197 kWh | -42% ☺ |
| Power/ lunit (calculated) | 22.8 kW | 16.4 kW | -28% ☺ |
| Current/phase/ lunit | 25 A | 18 A | -28% ☺ |
| Efficiency (COP) | - |
Remark: Superheat adjusted for HC
*) Source: se smep
Table 6 Test result HC retrofitting* (KUD Sukabumi Des 97) 2x30HP/2x22kW
| R12 | PIB | Difference | |
|---|---|---|---|
| Time used to build up ice bank | ₽. | ||
| (2 cooling units) | - | - | - |
| Cooling Gradient δT/δt (with 2 units) | 44 | - | - |
| HP | 170 psi | 175 psi | +3% ⊜ |
| LP | 8 psi | 10 psi | + 25 😩 |
| HP/ LP | 21.25 psi | 17.5 psi | -18.0% © |
| Pipe temperature HP side | |||
| Pipe temperature LP side | - | - | - |
| Refrigerant charge | 50 kg | 15 kg | -70% © |
| Power consump./ I unit (calculated) | - | - | |
| Power/ lunit | *************************************** | ····· | |
| (calculated) | - | - | |
| Current/phase/ lunit | 15 A | 13 A | -13% © |
| Efficiency (COP) | - | - |
Remark: Superheat adjusted for HC
*) Source: sa smep