

Ringkasan
Pengaruh ketebalan benda uji terhadap keretakan pada beban statik telah banyak dilakukan. Kajian biasanya dilakukan dengan menganggap plastisitas ujung retak, yaitu kondisi tegangan dekat ujung retak, berada pada kondisi regangan dan tegangan bidang. Tulisan ini melaporkan hasil kajian numerik dan eksperimental pengaruh kondisi tegangan pada rongga yang menyatu akibat pulsa intensitas tegangan. Durasi pulsa yang digunakan adalah 20, 40, dan 80 µs. Pengamatan terhadap permukaan yang patah memperlihatkan adanya beberapa rongga di daerah inklusi dimuka ujung retak. Rongga utama tersebut terbentuk dari menyatunya rongga-rongga kecil. Hasil pengamatan juga menunjukkan bahwa lokasi rongga utama tidak dipengaruhi oleh durasi impuls, dan ukuran rongga utama akan mengecil dengan menurunnya durasi pulsa. Simulasi metode elemen hingga menunjukkan bahwa normalisasi tegangan hidrostatik di muka ujung retak tidak dapat menjelaskan hasil-hasil dari percobaan. Sebagai contoh ketangguhan retak spesimen dengan tebal 10 mm ternyata lebih kecil jika dibandingkan dengan ketangguhan retak spesimen dengan tebal 3mm. Contoh lainnya adalah daerah terbentuknya rongga yang tidak bergantung pada tebal spesimen.
Key words: Stress pulse duration, Dynamic fracture toughness, Dynamic loading, Stress-state, Dominant
1. INTRODUCTION
Aluminum alloy 7075-T6 is one of the most important engineering alloys and has been utilized extensively in aircraft structures because of its high strength-to-density ratio. For safety and economic considerations, the knowledge of the mechanical properties and the dynamic fracture behaviors is of utmost importance. In 7075-T651 alloy, dimple fracture mainly takes place even under impulsive loading conditions [1]. Dimple fracture of metals usually develops through three stages: the first stage is void nucleation at the interface of matrix and a secondary particle or in a secondary particle due to its break, the second stage is void growth and the final stage is void coalescence with a crack if a critical condition is reached. Hancock and Mackenzie [2], Hancock and Brown [3] and Hancock [4] examined void nucleation and growth at various tri-axial stress levels through experiments on notched bar with different notch root sharpness. They showed that three stages are significantly affected by tri-axial stress and strain. Another result by Broek [5] showed that the void initiation strongly depends on the size of the inclusion particle at the nucleation site, and Schwalbe [6] showed that fracture toughness depends on particle spacing, and the homogeneity of particle distribution. However, up to now, there has been little work concerning the systematic effect of strain rate on the plastic flow response, as well as the evolution of the microstructure, during dynamic impact deformation. From the deformability view point and for structural design purposes, it is necessary to characterize the mechanical properties of 7075 aluminum alloy over a wide range of strain rate.
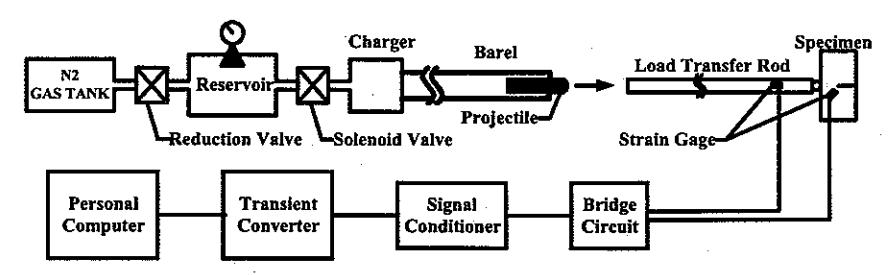
Figure 1. One-point impact experiment set-up.
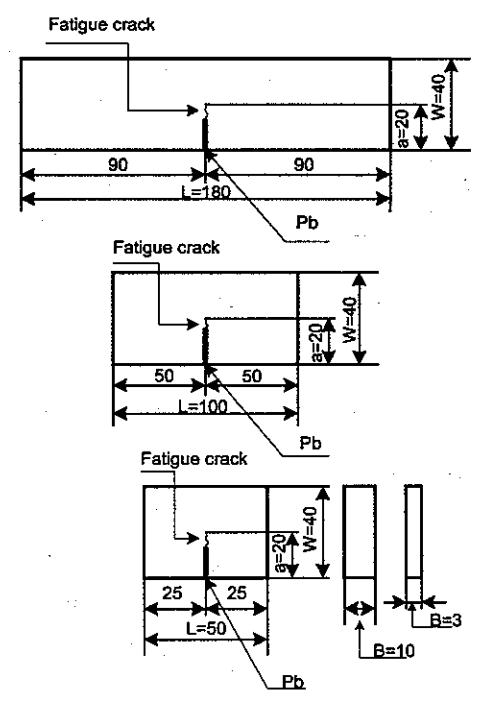
Figure 2. Specimen geometry and dimension (unit: mm).
In the previous work [1], the authors carried out impact fracture toughness tests under the plane strain conditions for the 7075-T651-aluminum alloy. The experimental results indicated that one or few dominant voids were nucleated around 110 µm away from an initial crack tip and grew with dynamic stress intensity to coalesce with the initial crack tip at the final stage. To clarify the dimple fracture mechanism in various aspects, this work uses 3 mm thick specimen, so that a stress condition close to plane stress could prevail in the specimen and investigation of the dimple fracture is focused on the effect of loading rates and stress conditions near the crack tip.
2. EXPERIMENTAL METHOD
2.1. Experimental Set-up
The experimental apparatus primarily consists of a gas gun, a projectile and a load transfer rod as shown in Fig. 1. A pre-cracked specimen shown in Fig. 2 is placed by attaching the midpoint of the specimen ligament side to the round end of the load transfer rod. A cylindrical barrel 2000 mm in length and 30 mm in inner diameter is utilized.
When the solenoid valve is opened, the nitrogen gas flows into the barrel to push the projectile. The compressive stress wave generated by the collision travels in the rod and partially propagates into the specimen.
Although having no support, the specimen is bent and swung back due to inertia effect. Then, the specimen vibrates in a bending mode at its natural frequency. The natural frequency strongly depends on specimen compliance, namely the specimen length. The shorter specimen has a higher natural frequency. The specimen geometry and dimensions shown in Fig. 2 are used in the experiment. These specimens provide three different time histories of stress intensity factor at the crack tip. This type of loading called one-point bending. The nitrogen gas pressure and the projectile traveling distance in the barrel change the amplitude of stress intensity.
2.2. Material and Specimen
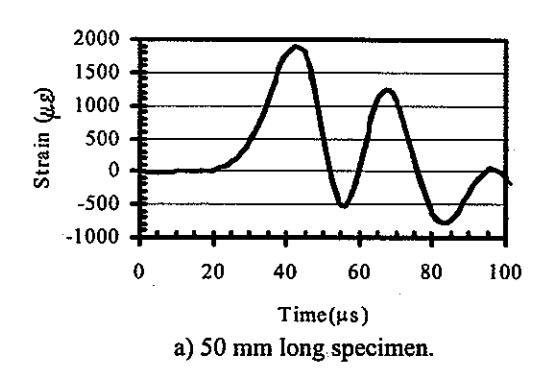
The material used in the experiment is 7075-T651 aluminum alloy. The mechanical properties and chemical compositions are given in Tables 1 and 2. As explained above, a specimen sustains different time histories of the stress intensity depending on its geometry. The measurement of stress intensity showed that the time history of the stress intensity at the crack tip has 80 µs duration, for the 180 mm long specimen, 40 µs duration for the 100 mm long specimen, and 20 µs duration for the 50 mm long specimen, at a half of the first amplitude. Two examples of measured stress intensity pulses are shown for the 50 mm and 180 mm long specimens in Fig. 3. The stress pulse duration is defined as the duration at the half of first pulse amplitude.
Table 1. Mechanical properties of Al 7075-T651.
| Tensile strength (MPa) | 570 | |
|---|---|---|
| 0.2% Proof stress (MPa) | 523 | |
| Elongation (%in 50 mm) | 11 | |
| Young's Modulus (GPa) | 71 | |
| Density (Kg/m3) | 2700 | |
| Poisson's ratio | 0.33 | |
| Rayleigh wave velocity (m/s) | . 3741 | |
Table 2. Chemical composition of Al 7075-T651 (wt%).
| Si | Fe | Cu | Mn | Mg |
|---|---|---|---|---|
| 0.4 | 0.5 | 1.5 | 0.3 | 2.5 |
| Zn | Cr | Ti | Aluminum | |
| 5.6 | 2.3 | 0.3 | Remaining | |
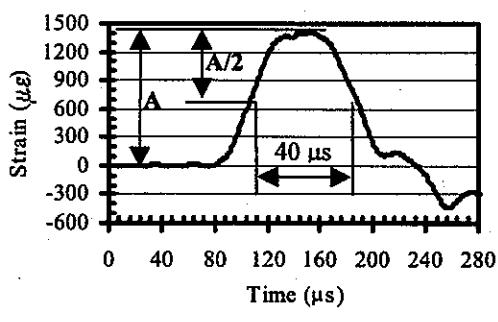
b) 180 mm long specimen.
Figure 3. The time histories of specimens at a half of first amplitude; a) 20 \(\mu\)s and b) 80 \(\mu\)s pulse duration.
2.3. Measurement of Dynamic Stress Intensity
Dynamic stress intensity history in each specimen was measured by a strain gage with a 1 mm gage length mounted at 7 mm away from the crack tip. The method was developed by Dally and Sanford [7] and the detail of the strain gage position is shown in Fig. 4. The angles \(\alpha\) and \(\theta\) of the strain gage depend on the Poisson's ratio \(\nu\) of the specimen material. The strain in the X´ direction may be expressed in the following series:
\[2G\varepsilon_{XX} = A_0 r^{-1/2} \begin{bmatrix} k \cos(\theta/2) - \\ (1/2)\sin\theta \sin(3\theta/2)\cos 2\alpha + \\ (1/2)\sin\cos(3\theta/2)\sin 2\alpha \end{bmatrix}\]
\[+B_0(k+\cos 2\alpha) + A_1 r^{1/2} \left[ \frac{k+\sin^2(\theta/2)\cos 2\alpha}{(1/2)\sin\theta \sin 2\alpha} \right]\] (1)
\[+B_1r[(k+\cos 2\alpha)\cos\theta-2\sin\theta\sin 2\alpha]\] where G is the shear modulus, \(A_0\) is \(K_1/\sqrt{2\pi}\), \(k=(1-\nu)/(1+\nu)\) and \(A_1\), \(B_0\), and \(B_1\) are constants. If \(\alpha\) and \(\theta\) are chosen so that the second, the third, and the forth terms in the right hand side of the above Eq. (1) are zeros, the strain \(\varepsilon_{x'x'}\) near the crack tip is accurately expressed by only the first term. As the Poisson's ratio of the aluminum alloy is approximated as 1/3, \(\alpha\) and \(\theta\) become \(60^0\), and eventually the dynamic stress intensity
Figure 4. The mounting and position of the strain gage.
factor is given by substituting the strain reading into the Eq. (1) as follows:
\[K_{\rm I} = E \, \varepsilon_{\rm x.x.} \, \sqrt{(8/3)\pi r} \,. \tag{2}\] where E is Young's modulus.
It should be noted that this relation was derived on the basis of static conditions. However, a stress and a strain field near a crack tip impinged by a stress wave could also be expressed by the same equation. So, Eq. (2) also valid for the dynamic stress conditions.
2.4. Dynamic Fracture Test
For each specimen geometry, at least eight identical specimens having a crack of the same length were prepared and a stress intensity pulse of different amplitude was applied to each specimen. As a projectile strikes the load transfer rod, and a compressive stress wave propagates through a specimen, the specimen is bent and swung back due to the inertia effect. As expected, the strain gages mounted at a distance of 7 mm from a crack tip is exposed by a diffraction wave from the crack tip about 1.87 \(\mu s\) after the stress wave impinge the crack tip. The maximum strain of the first pulse on the strain-time trace is used to calculate a dynamic stress intensity factor. The crack instability may takes place by the first pulse if the amplitude sustained by the crack is large enough.
3. EXPERIMENTAL RESULTS
3.1. Dynamic Fracture Toughness
The crack growth was examined for each specimen with an optical microscope after an impact test. The experimental results are shown for the 10 mm thick specimen in Fig. 5 and for the 3 mm thick specimen in Fig. 6. In the figures, the amplitude of the first dynamic stress intensity pulse, which is measured by a strain gage mounted near the crack tip, is plotted against the pulse duration with the crack growth inspection result. The open circle means that the crack grew under the stress intensity pulse, while the solid one indicates no crack growth occured. The critical dynamic stress intensity for the crack initiation or dynamic fracture toughness is defined as the midpoint between the maximum solid mark
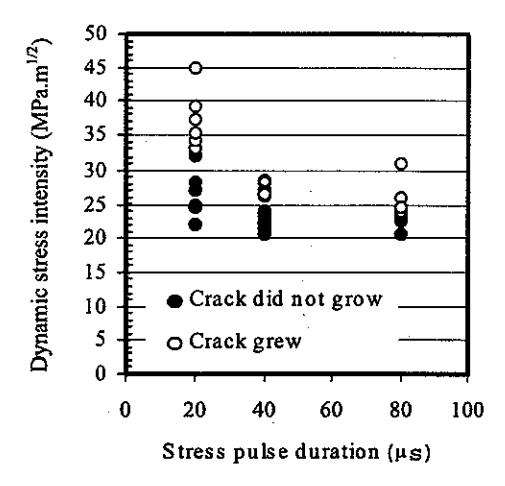
Figure 5. Dynamic stress intensity as a function of pulse duration (10-mm thickness).
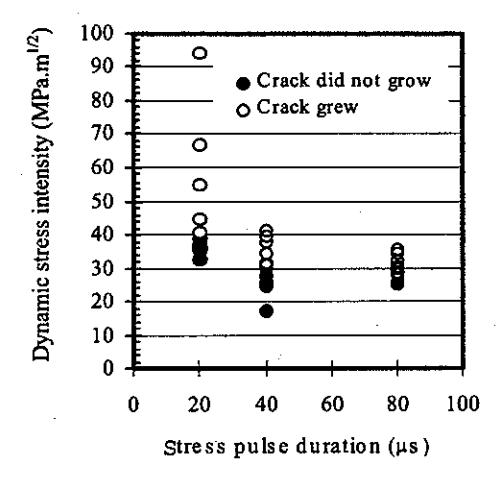
Figure 6. Dynamic stress intensity as a function of pulse duration (3-mm thickness).
and the minimum open mark. The dynamic fracture toughness is shown in Fig. 7. The dynamic fracture toughness \(K_{\rm Id}\) increases as the pulse duration decreases from 80 \(\mu\)s to 20 \(\mu\)s. As shown in the figure, the dynamic fracture toughness \(K_{\rm Id}\) for the 10 mm thick specimen is apparently smaller than for the 3 mm thick specimen over all the pulse durations. According to the ASTM E399 size requirement for the plane strain condition, the 10 mm thick specimen can provide a valid plane strain fracture toughness value over the tested pulse duration. On the other hand, in the 3 mm thick specimen, the crack initiation takes place under the condition close to the plane stress.
To provide evidence that the crack sustained low stress intensity at the initiation for the thicker specimen and longer pulse duration, the stretched zone width (SZW) was measured on the electron microscopic photograph of the fracture surface. The stretched zone (SZ) indicates crack tip blunting prior to physical crack extension. A number of works tried to relate the geometry of the stretched zone (SZ) to fracture toughness \(K_{IC}\) and revealed that the correlation between \(K_{IC}\) and stretched zone displacement (SZD) or stretched zone width (SZW) [8-10]. The SZW was measured at the middle and the
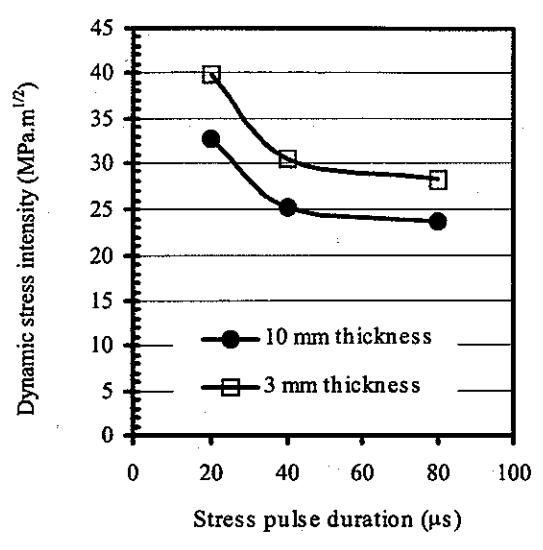
Figure 7. Dynamic fracture toughness of specimens 10-mm and 3-mm thickness.
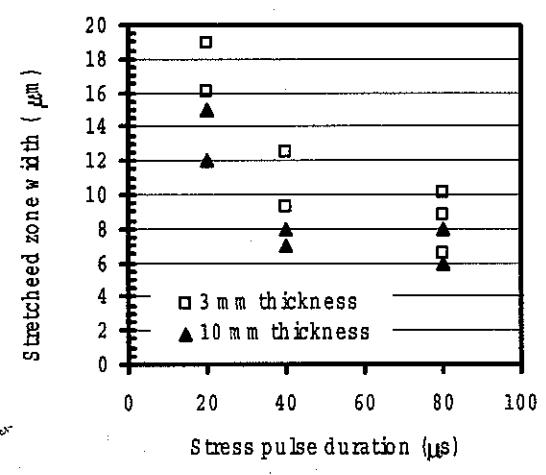
Figure 8. Stretched zone width as a function of pulse duration.
quarters of specimen thickness from specimen surface for each specimen. The mean value is calculated for every portion and is presented as a function of pulse duration in Fig. 8. This result corresponds well to the dynamic fracture toughness shown in Fig. 7. So, the result shown in Fig. 8 supports the experimental results of the dynamic fracture toughness shown in Fig. 7.
3.2. Dimple Fracture
Morphological features of fracture surfaces under the short pulse loading were examined by a scanning electron microscope (SEM). The microscopic fracture surfaces under impact loading are shown in Figs. 9 and 10. The fractographs indicate that dimples cover the whole fracture surface. Prudent observation reveals a single large void or a large void created by coalescence of small voids exists ahead of the crack tip. Close-up observation is shown in Fig. 11. At the bottom, a secondary particle is separated into two. The element analysis by an X-ray micro-analyzer showed secondary particles of Zn and Mg inside the large void.
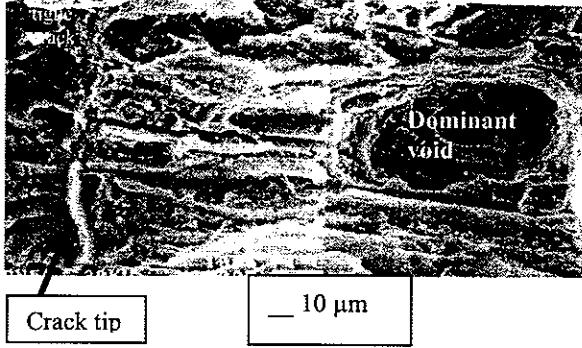
Figure 9. A dominant void site ahead of the crack tip for specimen 10-mm thickness; 80 µs pulse duration.
Figure 10. A dominant void site ahead of the crack tip for specimen 3-mm thickness; 80 µs pulse duration.
Figure 11. The close-up fractography of dominant void which surrounding by the small voids, and secondary particles of zinc and magnesium inside the void.
After a stress intensity with an amplitude slightly smaller than the dynamic fracture toughness is applied, the specimen is sectioned along the middle plane parallel to the specimen surface. The sectioning of the specimen enables observation of voids nucleated ahead of the crack tip as shown in Fig. 12. The crack tip is at the center bottom of figure. Ahead of the crack tip, several voids are nucleated at inclusions. It should be noted that coalescence of the crack tip and the voids did not occur.
Figure 12. The development of void at the inclusion site ahead of the crack tip.
To examine the dominant void, the dominant void size and its distance from the crack tip were measured on the fractographs and plotted as a function of stress intensity pulse duration in Figs. 13 and 14. The experimental results are scattered in a wide spectrum. This wide scattering reflects the randomness in the inclusion size and its spatial distribution. If the average value for each pulse duration is taken as shown in Figs. 13 and 14, it may be seen that the void nucleation site of the dominant void is independent of pulse duration. Because the voids are nucleated at inclusion, as shown in Fig. 12, the nucleation site must depend only on spacing of inclusions ahead of the crack tip or the inclusion distribution density in the specimen. The dominant void size slightly depends on the pulse duration as shown in Fig. 13. The size is around 40 µm of 80 µs durations, and increases very slightly as the duration decreases to 40 µs, whereas the size decreases to around 32 µm, for the duration of 20 μs.
4. NUMERICAL ANALYSIS AND DISCUSSION
The finite-element code ANSYS<sup>TM</sup> was used for a numerical stress and strain analysis. A dynamic elastic-plastic stress analysis was carried out under plane strain and plane stress conditions to examine the tri-axial stress conditions ahead of the crack tip. Two-dimensional mesh models were generated for three kinds of specimen geometries as shown in Fig. 2. A half of the model is shown in Fig. 15 (a) and fine meshes are used for the
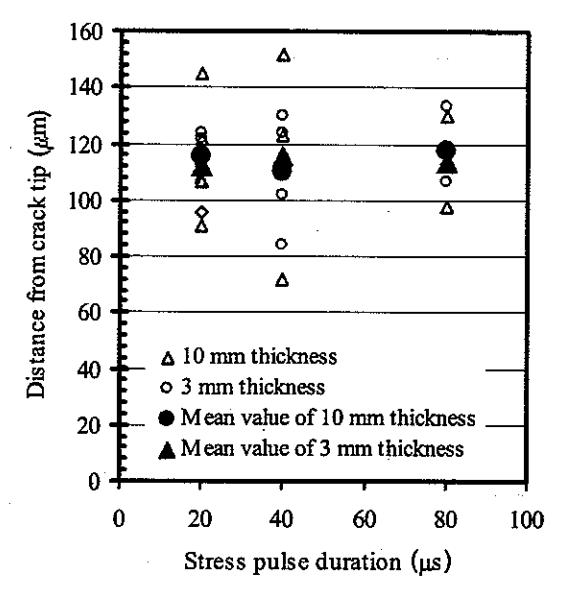
Figure 13. The dominant void distance as a function of pulse duration.
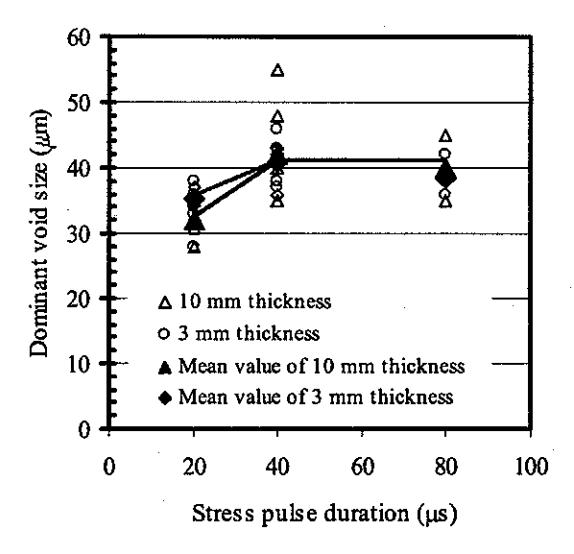
Figure 14. The dominant void sizes as a function of pulse duration.
crack tip region is shown in Fig. 15 (b). Six-node triangle meshes are used for the far field and singular meshes are used for the crack tip region. The crack tip mesh size is one four-hundredth of the crack length. Applied loads to three kinds of specimens were determined, so that the loads would generate the same amplitude 25 MPa \(\sqrt{m}\) of the stress intensity pulses for three specimen geometries in elastic analyses.
Plastic zones ahead of the crack tip under the plane strain condition are shown for the 180 mm and the 50 mm long specimen in Figs. 16 and 17. Because visco-plastic properties are not taken into the consideration in the analysis, the same size of the plastic zone is generated. The plastic zone under the plane stress condition is shown in Fig. 18. The comparison between the plastic zones in Figs. 17
Figure 15. Two-dimensional mesh model for the 50 mm long specimen: a) A half mesh model and loading condition; b) The close up of mesh model at the crack tip region.
and 18 reveals that a much larger plastic zone is developed under the plane stress condition.
For the 180 mm long specimen, the mean of the normal stress components, namely the hydrostatic stress on the crack line is plotted as a function of distance from the crack tip in Figs. 19 and 20. Under the plane strain condition shown in Fig. 19, the hydrostatic stress increases with the distance from the crack tip and reaches the peak at the position of 75 \(\mu\)m from the crack tip. On the other hand, under the plane stress condition shown in Fig. 20, the hydrostatic stress increases up to 350 MPa as the distance from the crack tip increases to 50 \(\mu\)m and becomes constant over the range from 50 \(\mu\)m to 150 \(\mu\)m as the time reaches 38 \(\mu\)s.
The inclusion spacing in the material used in the experiment is around 100 µm [1]. In plane stress condition, the hydrostatic stress is almost constant within the region over 50 µm to 150 µm ahead of the crack tip. If the inclusion exists 100 µm ahead of the crack tip, a void could nucleated at the inclusion site. Under the plane strain condition, the hydrostatic stress reaches the peak of 1000 MPa at the position 75 um from the crack tip and decreases to 930 MPa at the void nucleation site, 110 µm ahead of the crack tip. It may be interpreted from this result that the existence of the inclusion is so dominant for the void nucleation that it could overshadow the difference of 70 MPa in the hydrostatic stress. The magnitude under the plane strain condition is much higher than under the plane stress condition. Therefore, a void could nucleated under a lower stress intensity level in the plane strain condition than under
Figure 16. Plastic zones size as a strain under the stress intensity pulse of 80 µs duration at 165 µs after impact loading (plane strain condition).
Figure 17. Plastic zones size as a strain under the stress intensity pulse of 20 μs duration at 40 μs after impact loading (plane strain condition).
Figure 18. Plastic zones size as a strain under the stress intensity pulse of 80 µs duration at 165 µs after impact loading (plane stress condition).
the plane stress condition as expected by experimental results [2,3]. The Von Misses equivalent strain contours inside the plastic zone are also shown for both stress
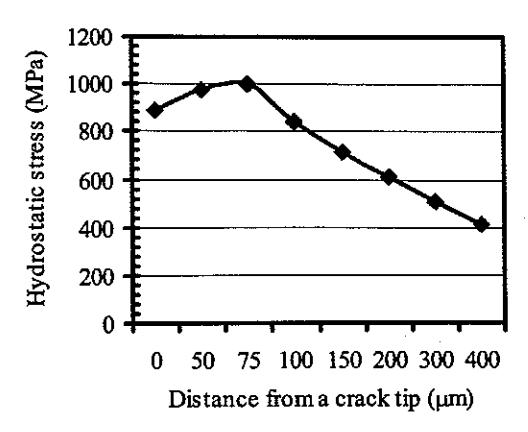
Figure 19. Hydrostatic stress as a function of distance from a crack tip (plane strain condition).
conditions in Figs. 16 and 17. The strain is much higher for the plane stress condition than for the plane strain condition. Because the obtained experimental results indicate that the dynamic fracture toughness is apparently lower under the plane strain condition than that of the thin specimen weakly dominated by the plane stress condition, the strain does not seem to play a significant role on the void nucleation and the growth process in this experimental condition.
The FEM analysis provided no difference in the crack tip plasticity for three specimen geometries when they were subjected to the same amplitude of the dynamic stress intensity, because the FEM code does not take into account the visco-plastic behaviors of the material. The experimental results [11] of a loading rate effect on mechanical properties of the 7075-T73 aluminum alloy showed that this alloy was substantially not susceptible against the strain rate up to 10<sup>5</sup>/s. The FEM analysis indicates that the strain rate at the crack tip under the plane strain condition is around 2.8x10<sup>3</sup>/s as seen in Figs. 16 and 17. However, the dynamic fracture toughness significantly increases as the duration of the stress intensity pulse decreases from 40 us to 20 us. The SEM observation shown in Figs. 9 and 10 indicate that the microscopic morphological features of the fracture surfaces are identical under 20, 40 and 80 µs stress intensity pulse durations. The dimples cover the whole fracture surface and fine voids are nucleated as void sheet to connect the crack tip and a dominant void. This suggests that the same fracture mechanism takes place under all the durations of the stress intensity pulses. On the other hand, the dynamic fracture toughness remarkably increases under the 20 µs pulse duration as shown in Fig. 7.
To explain the tremendous increase in the dynamic fracture toughness as the duration of the stress intensity pulse decreases to 20 \(\mu s\), visco-plastic behavior in the plastic deformation near the crack tip must be taken into consideration. In other words, under a very fast loading rate such as the 20 \(\mu s\) stress intensity pulse, enhancement of the yield strength and the flow stress may reduce the plastic deformation ahead of the crack tip and delay the nucleation and the growth of voids. Also, the traveling time of the plastic stress wave cannot be long enough for
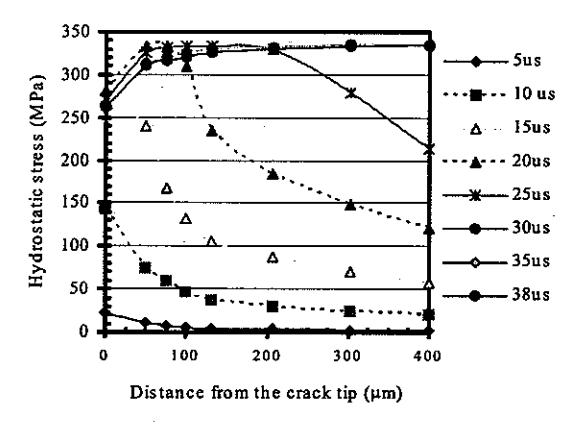
Figure 20. Hydrostatic stress as a function of distance from a crack tip (plane stress condition).
the wave to spread neat the crack tip fully. This may result in the intensive plastic deformation adjacent to the crack tip and a very wide SZW as shown in Fig. 8. So, visco-plastic behavior described above must be considered to better understand the dynamic fracture toughness under the short stress intensity pulse duration.
5. CONCLUSIONS
In this work, the dynamic fracture toughness tests using a single stress intensity pulse were carried out for 7075-T651 aluminum alloy specimens of 10 and 3 mm thick. In the thick specimen, the plane strain condition prevails and quasi-plane stress condition prevails in the thin specimen. The conclusions are as follows:
- (1) The dynamic fracture toughness remarkably increased as the pulse duration decreased to 20 \(\mu\)s.
- (2) The experimental and numerical results showed that the crack tip stress-strain fields have significantly contribute to the development of void initiation model for local criteria to establish dimple fracture.
- (3) The hydrostatic stress ahead of the crack tip can accounts for the experimental findings that the void nucleation site is independent of the stress condition such as the plane strain and plane stress. The nucleation site is significantly associated with the inclusion spacing. The dominant void size decreased when the pulse duration decreased to 20 µs.
- (4) The fast loading rate effect on dynamic fracture toughness suggests the visco-plastic behaviors ahead
6. ACKNOWLEDGEMENT
I would like to thank Prof. Hiroomi Homma of Toyohashi University of Technology for his continued support throughout the course of this research effort in addition to his many insightful comments, notably on the detailed aspects of this work.