

M E S I N
Jurnal Teknik Mesin Vol. 20, No. 2, Oktober 2005 No. ISSN: 0852-6095
Diterbitkan oleh : Departemen Teknik Mesin, FTI
Institut Teknologi Bandung
Surat ijin : STT No. 964/DIT-JEN/PPG/STT/1982.
MESIN Vol. 20 No. 2 i
DAFTAR ISI
| Studi Numerik Pengaruh Jumlah dan Puntiran Swirler Vanes pada Aliran | |
|---|---|
| Masuk Tabung I Gede Parwatha, Firman Hartono, Hisar M. Pasaribu, Djoko Sardjadi dan Aryadi Suwono | 40 |
| Analysis of Using Alternative Refrigerants for Energy Saving in Design Framework of Air-Conditioning System I Made Astina, Prihadi Setyo Darmanto, Warsito and Edwin Adryanto | 49 |
| Pengembangan Metode Simulasi Sistem Pengkondisian Udara Energi Surya Agus Hermanto, Aryadi Suwono, Abdurrachim dan Ari D. Pasek | 58 |
| Measuring and Compensating for Off-Line to Running Machinery Movement Phan Anh Tuan, Zainal Abidin and Komang Bagiasna | 68 |
| Analisis Frekuensi pada Uji Tak Merusak Ultrasonik Amoranto Trisnobudi | 73 |
M E S I N
Jurnal Teknik Mesin
Vol. 20, No. 2, Oktober 2005
I Made Astina<sup>(1)</sup>, Prihadi Setyo Darmanto<sup>(1)</sup>, Warsito<sup>(2)</sup> and Edwin Adryanto<sup>(1)</sup>
(1) Mechanical Engineeering Department, Faculty of Industrial Technology, ITB Jalan Ganesha 10 Bandung (2) PT Wijaya Karya, Jalan DI Panjaitan Kav 9 Jakarta Timur
Ringkasan
Isu-isu lingkungan telah memaksa kita untuk mencari refrigeran alternatif yang ramah lingkungan. Peningkatan konsumsi energi sebagai konsekuensi penggunaan sistem pengkondisi udara perlu diimbangi dengan usaha untuk memperoleh sistem-sistem yang efisien. Kesesuaian dalam aplikasi dan efek modifikasi dari siklus kompresi uap dikaji dalam penelitian ini untuk menjawab kedua hal tersebut. Untuk memperoleh gambaran yang sesuai dengan aplikasi yang sesungguhnya, analisis terhadap perancangan ulang dari suatu sistem dilakukan sehingga akhirnya memperoleh hasil yang realistis. Hasil-hasil menegaskan bahwa pemilihan refrigerant yang tepat pada sistem pengkondisi udara dapat memperbaiki kinerja sistem. Beberapa group hidrokarbon (HC) dan hidrofluorkarbon (HFC) mempunyai kinerja termodinamik yang baik dan bahkan lebih baik dari refrigeran R-22 yang pada waktunya nanti akan dilarang penggunaannya. Dengan penggunaan refrigeran-refrigeran alternatif ini, emisi CO2 dapat dikurangi sebagai akibat penghematan energi berbahan bakar fosil dengan peningkatan kinerja sistem pengkondisi udara.
1. INTRODUCTION
Life style of man changes harmonically with human culture and economic ability. Indonesia, as tropical country that lies in the equator has a hot climate throughout all year. More air-conditioning systems used in buildings cause increase of energy consumption. They are not only in public buildings but also in residential houses.
Ozone-depleting and global-warming potentials are two issues relating refrigerants in respect to the environment. Montreal protocol is a form of comittment of International society to reduce the ozone depletion. On the other hand, global warming issue was responded through Kyoto protocol. The environmental issues of using refrigerants and consuming fuels are well
responded by selecting alternative refrigerants that have properties such as environmental friendly and good energy transport.
Thermodynamic simulation approaches are used to reveal thermodynamic performance of the alternative refrigerants. Thermodynamic properties calculated from thermodynamic model can be used to figure out performance of alternative refrigerants. Generally, not all thermodynamic models are available for all fluids. Furthermore, thermodynamic properties for certain fluids can be derived from available thermodynamic model. This is conducted in this study in simulating performance of thermodynamic cycles.
Other study results relating to the study topic were also considered to make clear the problem. Devotta et al. [1]
investigated implementation of several fluids and then pointed out that using R-134a needs larger compressor size. R-290 (propane) was also stated that it has a good prospect, even though it is hazard due to its flammability. Granryd [2] reviewed application of HC as refrigerants. Acceptability of public to HC as refrigerants depends on policy of a country, besides rationally technical considerations. Bivens and Minor [3] pointed out that no candidate of alternative refrigerants appears and able to compete with HFC refrigerants in comparison from their performance, cost, and safety. Several other papers reported efforts for finding alternative refrigerants [4-7].
2. RESEARCH METHODOLOGY
The methodology combines thermodynamic simulation of refrigeration cycles and a case study of designing of an air-conditioning system. Alternative refrigerants were investigated on their performance and other properties related to their application. Cooling load, which is an important task in designing of air-conditioning system, was estimated based on Carrier [8] and ASHRAE [9].
Air-conditioning system in the Sasana Budaya Ganesha Auditorium ITB was selected as object study to investigate the existing building and redesign efficient air conditioning system concerning alternative refrigerants. The auditorium shape is half of circle with air-conditioned area around of 2495 m<sup>2</sup>. This area can be divided into three large rooms that can be merged anytime. It can be used partially when fewer people involved in an activity.
Thermodynamic properties were calculated from thermodynamic models either MBWR type or Helmholtz type. Thermodynamic models were used to calculate thermodynamic properties of R-290 [10], isobutane (R-600a) [10], normal butane (R-600) [10], difluoromethane (R-32) [11], pentafluoroethane (R-125) [12], 1,1,1,2-tetrafluoroethane (R-134a) [13], 1,1,1-trifluoroethane (R-143a) [14], and 1,1-difluoroethane (R-152a) [15]. Gaseous emission of \(CO_2\) and energy saving were also analyzed to reveal real effects of alternative refrigerants.
3. OPTIMIZATION AND RESULTS
3.1 Cooling-Load Estimation
Cooling load was estimated in accordance with heat transfer characteristics. Thermal storage effect of material, all heat transfer modus were considered on the estimation. Table 1 lists estimated monthly maximal cooling loads based on the largest activity in the auditorium. The maximal load occurs in January. However, this result cannot be referred to determine size of chiller in designing of air-conditioning systems. Detailed schedule and variance of activities should be considered to estimate cooling loads of the system so that efficient system can be established.
Right selection of chiller capacity plays an important role on operation and initial costs. Three groups of activities were defined to find sizes of chillers. The calculation results for each activity are described in Figs. 1 to 3. Considering these results, suitable chiller sizes for most possible activities can be provided.
Table 1. Monthly maximal cooling load<sup>1</sup>
| Mn | RSH KW | RLH kW | OASH KW | OALH kW | GTH KW | GTH TR |
|---|---|---|---|---|---|---|
| Jan | 409.1 | 395.3 | 204.1 | 214.2 | 1222.6 | 348 |
| Feb | 402.9 | 395.3 | 143.7 | 160.6 | 1102.6 | 314 |
| Mar | 423.9 | 395.3 | 143.7 | 19.9 | 982.8 | 280 |
| Apr | 488.5 | 395.3 | 172.5 | -119.5 | 936.7 | 266 |
| May | 550.7 | 395.3 | 189.7 | 112.0 | 1247.8 | 355 |
| Jun | 404.7 | 395.3 | 201.2 | -62.3 | 939.0 | 267 |
| Jul | 398.0 | 395.3 | 212.7 | -211.7 | 794.3 | 226 |
| Aug | 393.4 | 395.3 | 178.2 | -174.3 | 792.6 | 225 |
| Sept | 396.2 | 395.3 | 201.2 | -432.1 | 560.7 | 159 |
| Oct | 407.9 | 395.3 | 224.2 | -9.962 | 1017.4 | 289 |
| Nov | 411.5 | 395.3 | 229.9 | -350.5 | 686.2 | 195 |
| Dec | 395.8 | 395.3 | 172.5 | 159.4 | 1122.9 | 319 |
Musical concert activities based on schedule time from morning to midnight
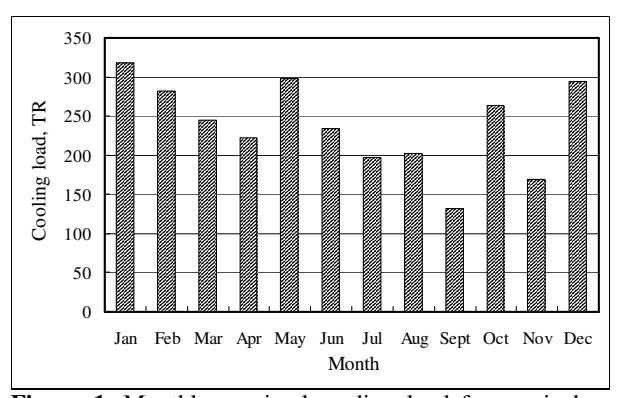
Figure 1. Monthly maximal cooling load for musical concert activities started from 18.00.
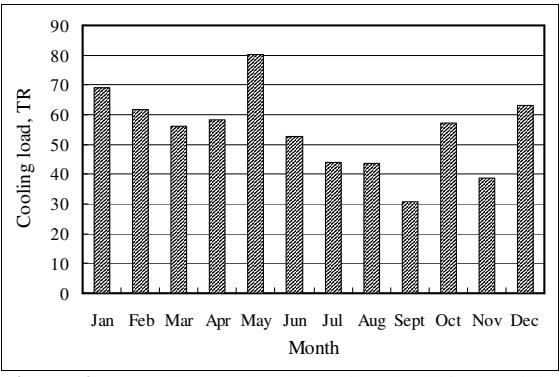
Figure 2. Monthly maximal cooling load for wedding parties
Cooling load simulation was based on the three activities. It shows that their monthly maximal cooling loads differ significantly. The musical concert activities
started at 18.00 have maximal cooling load of 319 TR as shown in Fig. 1. The condition is generally caused by latent load of people in the auditorium, assuming around 5000 people in each certain activity. It occurs in January at 18.00. This may be a consequence of the initial starting situation of the events.
The wedding parties are assumed have population of 1000 people. Maximal cooling load at these ceremonies is estimated of 80 TR occurring in May at 14.00. The actual modus of cooling load is likely lower than 60 TR.
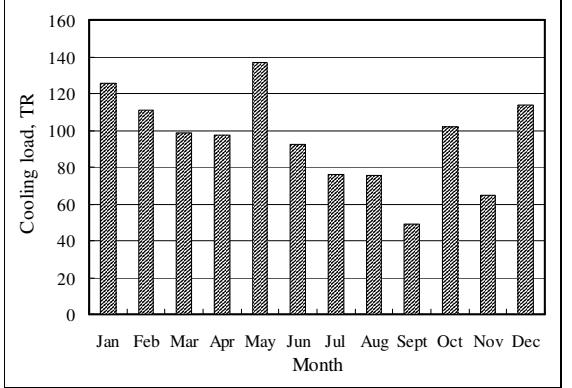
Figure 3. Monthly maximal cooling load for graduation ceremonies
Figure 3 shows estimation of cooling load for graduation ceremonies in the auditorium. The graduation ceremonies are attended by 2000 people. Maximal cooling load at these ceremonies is estimated of 158 TR occurring also in May at 14.00. Modus of cooling load is predicted lower than 100 TR. Most maximal cooling loads for each the above activities are contribution of latent heat load. The load modus occurs at either January or May as a concequence of higher relative humidity occurs at this months.
Maximal cooling load calculated from the first estimation in Table 1, which presents monthly-maximal cooling load without thoroughly concerning all possible activities, are compared with the three other activities. The result indicates the significance of accurate analysis of cooling load in determining chiller sizes. In case of using the largest cooling load from the result in Table 1, it causes an over estimated chiller size that leads to an inefficient system and higher initial cost.
Varying monthly maximal cooling loads for the three activities are very useful to select and divide chiller sizes so that the system can work efficiently. Common method used in design, i.e. using a certain number of the same chiller size for the auditorium, cannot meet variant cooling load due to variables of alternatives in the auditorium. The three alternative activities can be met by using three different chiller sizes so that operation selection of chiller gives close to each the maximal cooling load. For example, Carrier provides watercooled chiller with sizes of 145.9 TR, 104.3 TR, and 58.8 TR with refrigerant R-134a. Maintenance schedule should also be considered to number of chillers and size. Space may limit the number of chillers. In case of space is available, determination of 4 chillers consisting of 2 x 100 TR and 2 x 60 TR chillers are more suitable with respect to operation and maintenance aspects.
3.2 Optimal Condition and Simulation
The base of cycle in thermodynamic simulation is vapor-compression cycle. The cycle was simulated from the simple one to modified cycles. The simple cycle is illustrated schematically in Figs. 4 to 6. The modified ones are aimed to improve the efficiency.
Figure 4. Simple vapor-compression cycle
Figure 5. Regenerative vapor-compression cycle
Figure 6. Intercooler vapor-compression cycle
Optimal conditions of cycle were obtained by varying operation temperatures of evaporator and condenser. This condition relates to an environmental atmosphere condition and room conditioned. The results were based on thermodynamic properties of R-22 of Kamei et al. [16]. The results in Fig. 7 show effects of condenser and evaporator temperatures to performance of the simple vapor-compression cycle. Decrease of condenser temperature improves performance of the cycle. On the other hand, increase of evaporator temperature improves the performance.
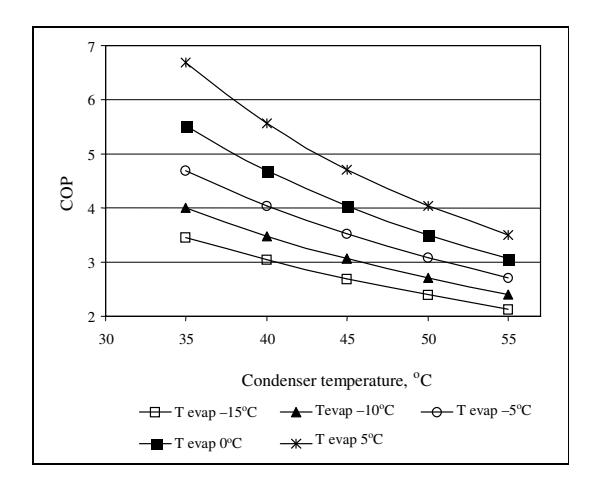
Figure 7. Influence of condenser temperature on COP of the simple vapor-compression cycle
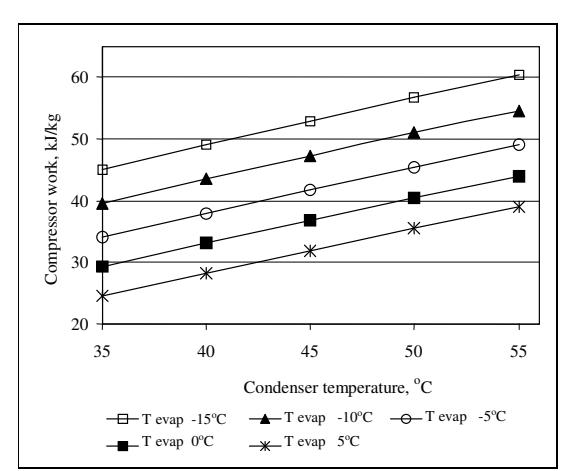
Figure 8. Compressor work of the simple vaporcompression cycle at various operation
Figure 8 shows effect of condenser and evaporator temperatures on compressor work. Increase of condenser temperature causes an increase in the energy needed by compressor. In contrast, an increase of evaporator temperature reduces the energy consumed by compressor.
Maximal COP for the modified cycle with regenerative heat exchanger can be found by varying refrigerant temperature rise in the heat exchanger. Since evaporator and condenser temperatures are constrained by the operation condition, thus these operations were determined in accordance with the optimal condition of the simple cycle of R-22. Fluctuations of COP with respect to refrigerant temperature rise in a regenerative heat exchanger with evaporator and condenser temperatures of 0°C and 40°C, respectively, is shown in Fig. 9. The temperature rise between 3 to 5°C performs better COP. The largest COP is 4.72, which slightly higher than the simple-cycle COP. This largest value is achieved at superheated-vapor refrigerant temperature rise of 4°C and sub-cooled liquid refrigerant temperature down to 3.3°C for evaporator and condenser temperatures of 0°C and 40°C respectively.
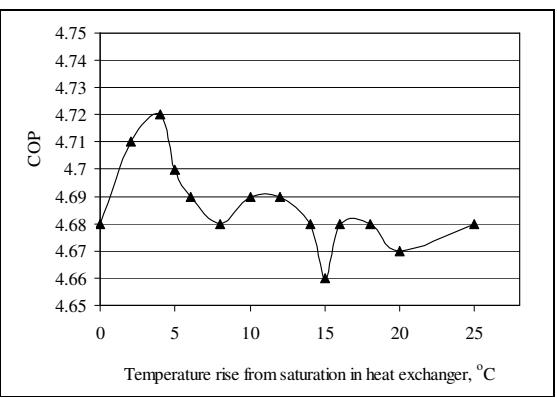
Figure 9. Trend of COP with respect to refrigerant temperature rise in a regenerative heat exchanger
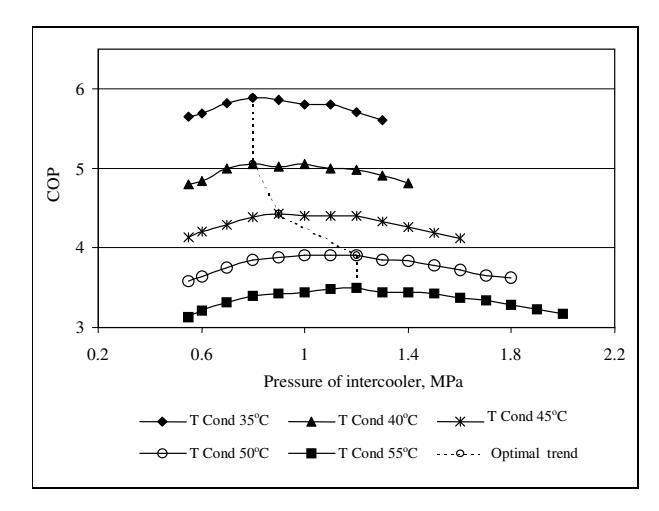
Figure 10. Pressure of intercooler with evaporator temperature of \(0^{\circ}C\)
Optimal condition of the modified cycle with intercooler compressor was determined by varying the intercooler pressure for the same optimal evaporator and compressor temperatures of the simple cycle. The intercooler pressure influence to COP is shown in Fig. 10. Maximal COP of 5.05 for evaporator and condenser temperatures of 0°C and 40°C, respectively occurs at pressure of between 0.8 and 1.0MPa. However, condensation of gaseous refrigerants cooled by intercooler should be avoided since this can destroy compressor.
Comparison of the three cycles is summarized in Fig. 11. It confirms that the modified cycle with the regenerative heat exchanger insignificantly improves performance of the simple vapor-compression cycle. On the other hand, the modified cycle with an intercooler has more significant improvement. This improvement requires more expensive additional equipment.
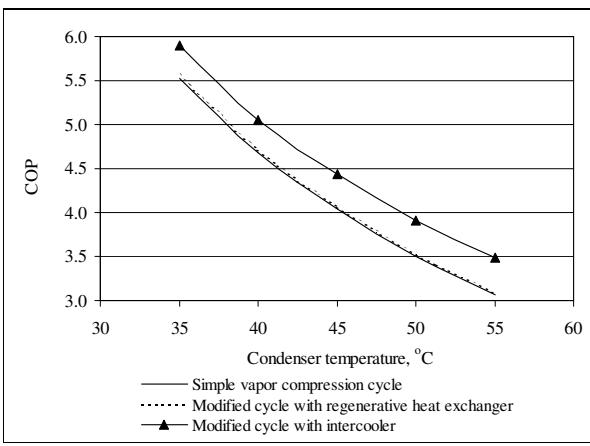
Figure 11. Comparison of COP of the three cycles at evaporator temperature of 0°C
3.3 Alternative Refrigerants
Based on the optimal condition of R-22, simulations of alternative refrigerants, especially for pure fluids, were conducted for the simple vapor-compression cycle. This consideration was taken as consequence of effort to find an alternative refrigerant for retrofitting an existing R-22 chiller.
Table 2 Alternative refrigerants effect on simple vaporcompression cycle
| Fluid | q e kJ/kg | Wc kJ/kg | r p | COP |
| R-22 | 155.40 | 33.18 | 3.08 | 4.68 |
| R-32 | 239.69 | 52.71 | 3.05 | 4.55 |
| R-125 | 77.88 | 19.77 | 2.99 | 3.94 |
| R-134a | 142.19 | 30.43 | 3.47 | 4.67 |
| R-143a | 123.09 | 29.07 | 2.95 | 4.23 |
| R-152a | 235.76 | 48.28 | 3.44 | 4.88 |
| R-290 | 266.51 | 58.16 | 2.89 | 4.58 |
| R-600 | 288.18 | 59.24 | 3.68 | 4.86 |
| R-600a | 258.45 | 54.18 | 3.40 | 4.77 |
The comparison of alternative refrigerants performance in a refrigeration cycle with evaporator temperature of 0°C and condenser temperature of 40°C is listed in Table 2. This result is based on the same mass flow rate of refrigerants. Higher ratio pressure is needed for R-600 and it is then followed by R-134a.
Effect of alternative refrigerants on refrigeration capacity at various condenser temperatures is shown in Figure 12. Alternative refrigerants that have better refrigeration capacity than R-22 are R-32, R-152a, R-290, R-600, and R-600a. On the other hand, Figure. 13 shows comparison of performance of the cycle for various alternative refrigerants. R-152a has the best COP. It should be noted that those analyses were based on the optimal operation of R-22 in simple vapor compression cycle.
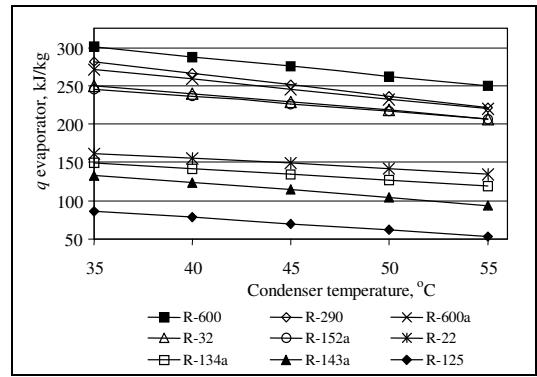
Figure 12. Cooling capacity of alternative refrigerants in simple vapor-compression cycle at evaporator temperature of 0°C
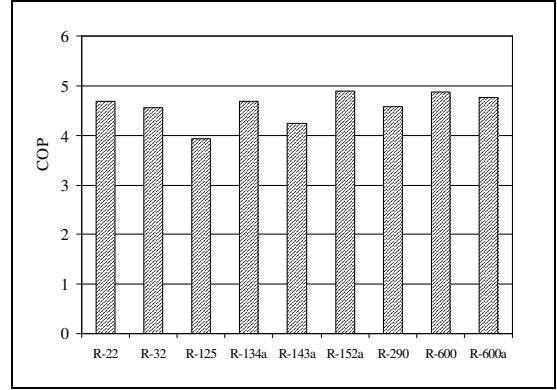
Figure 13. Comparison of COP of simple vaporcompression cycle at evaporator and condenser temperatures of 0°C and 40°C, respectively
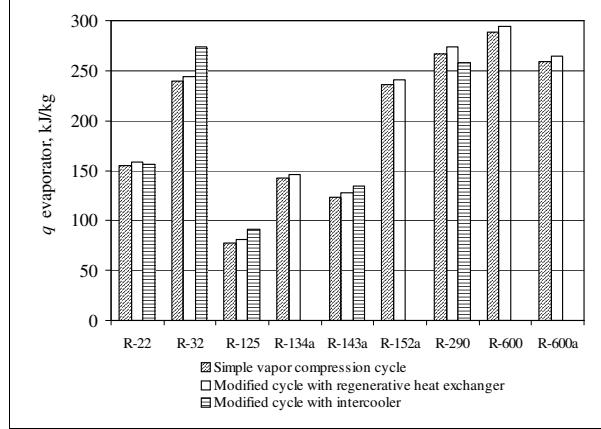
Figure 14. Comparison of refrigeration capacity for the three cycles at evaporator and condenser temperatures of 0°C and 40°C, respectively
Comparisons of the performance for the three cycles are shown in Figure. 14 to 17. It should be noted here that these comparisons were based on operation condition of condenser and evaporator referring to optimal condition of R-22. These results show that modified cycles do not always improve its theoretical performance due to nonoptimal operation condition may cause the performance to be worse than the simple vapor-compression cycle. Several alternative refrigerants such as R-152a, R-600, and R-600a cause that performance of the modified cycle with intercooler drastically drops so that they are excluded from the figures.
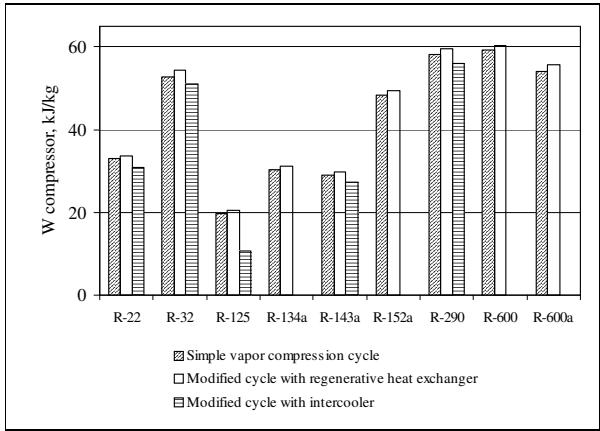
Figure 15. Comparison of compressor work for the three cycles at evaporator and condenser temperatures of 0°C and 40°C, respectively
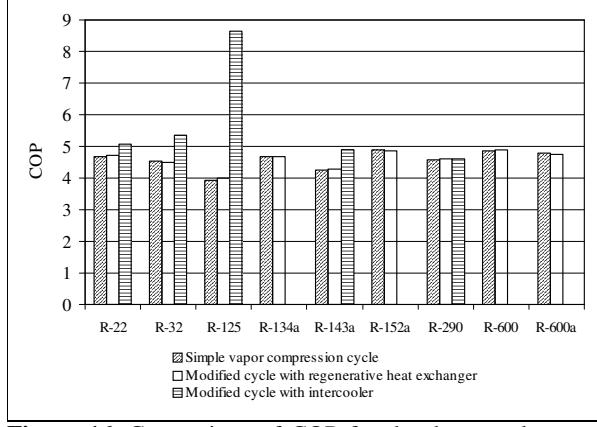
Figure 16. Comparison of COP for the three cycles at evaporator and condenser temperatures of 0°C and 40°C, respectively
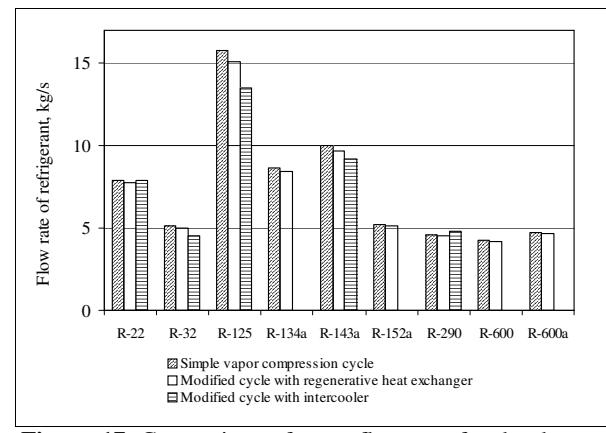
Figure 17. Comparison of mass flow rate for the three cycles at evaporator and condenser temperatures of 0°C and 40°C, respectively, and refrigeration capacity of 350 TR
4. DISCUSSIONS
Simulation results confirm that operation condition and thermodynamic properties of fluid plays important role in thermodynamic analyses. Evaporator and condenser temperatures are related to a room conditioned and environment temperatures, respectively. Water-cooled chiller has better performance due to lower condenser temperatures, causing better performance as shown in Figure. 7. This behavior is not limited on R-22, but it is also valid for other alternative refrigerants. These results confirm that water-cooled chiller is better than aircooled chiller. However, right selection judgment should also consider other aspects, such as costs of make-up water for cooling tower, local policy relating environment, and maintenance costs.
Cooling-load estimation was accurately conducted in order to meet the actual cooling load for each possible activity. If this proposed systems is compared to existing air-conditioning system in the auditorium, significant different system size is obtained. The existing system, which consists of 3 x 120 TR chillers of R-22, can cover the present estimation of the cooling load. If one chiller is operated for small event such as a wedding party, the capacity of chiller is around 40% larger than the actual load. The chiller will not operate efficiently. Variance of the selected chiller sizes can be expected to match various activities. Currently, the existing chillers cannot treat and control air for musical concert activity. Not all chiller working properly may cause this insufficient. This agrees with result of interview to technical staffs at the site and with the site investigation.
Behavioral assessment of alternative refrigerants for implementation of retrofitting R-22 was described in Section 3.3. There are several refrigerants having better COP than R-22, such as R-152a, R-600 and R-600a. The result was based on an optimal condition for implementation of R-22, i.e. evaporator and condenser temperatures of 0°C and 40°C, respectively. However, these refrigerants are flammable so that fire risks should be paid more attention in their implementation. The fire risks are reduced if chiller units are allocated in an open place. HC refrigerants either R-600 or R-600a have no problem with lubrication of compressor.
Compressor work and size can be judged by either mass flow rate or volumetric rate of alternative refrigerants for a certain refrigerating capacity. R-600, R-600a, R-152a, and R-290 cause its compressor work per unit of mass flow rate becomes larger than the one of R-22 as indicated in Table 3. Mass flow rate of R-600 is smaller among the simulated alternative. The relative volumetric refrigeration capacity of R-600 is estimated around 50% of R-22. This large difference should be reduced in retrofitting so that an existing machine can be used without significant differences of operation condition and capacity. Therefore, compressor can work optimally when it operates using R-22. A proposed strategy is that mixing it with other refrigerants so that volumetric refrigeration capacity reaches near the value of R-22.
Table 3. Energy consumption of the simple vaporcompression cycle for evaporator and condenser temperatures of 0°C dan 40°C, respectively
| Fluid | qe kJ/kg | Wc kJ/kg | mrf kg/s | COP | Csp. E. kW | Spc. E. kW/ TR | |
|---|---|---|---|---|---|---|---|
| R-22 | 155.4 | 33.2 | 7.01 | 4.68 | 232.6 | 0.75 | |
| R-32 | 239.7 | 52.7 | 4.54 | 4.55 | 239.6 | 0.77 | |
| R-125 | 77.9 | 19.8 | 13.99 | 3.94 | 276.5 | 0.89 | |
| R-134a | 142.2 | 30.4 | 7.66 | 4.67 | 233.1 | 0.75 | |
| R-143a | 123.1 | 29.1 | 8.85 | 4.23 | 257.3 | 0.83 | |
| R-152a | 235.8 | 48.3 | 4.62 | 4.88 | 223.1 | 0.72 | |
| R-290 | 266.5 | 58.2 | 4.09 | 4.58 | 237.7 | 0.77 | |
| R-600 | 288.2 | 59.2 | 3.78 | 4.86 | 223.9 | 0.72 | |
| R-600a | 258.5 | 54.2 | 4.21 | 4.77 | 228.4 | 0.74 | |
Selection of refrigerant-type chiller in transition situation is very difficult due to strategic decision and situation is still developing. Research result and local policy also influence this selection, so that further analyses plays important role on strategic decision. National interests and International interests are two forces that may be contradictive. Selection of an alternative refrigerant also affects maintenance and operation costs and initial cost.
Table 4. CO2 emission of the simple vapor-compression cycle for evaporator and condenser of 0°C dan 40°C, respectively
| Fluid | Wc kJ/kg | mrf kg/s | COP | E, kW | CO2 Lbs | |
| R-22 | 33.2 | 7.01 | 4.68 | 232.6 | 2149 | |
| R-32 | 52.7 | 4.54 | 4.55 | 239.6 | 2213 | |
| R-125 | 19.8 | 13.99 | 3.94 | 276.5 | 2555 | |
| R-134a | 30.4 | 7.66 | 4.67 | 233.1 | 2154 | |
| R-143a | 29.1 | 8.85 | 4.23 | 257.3 | 2377 | |
| R-152a | 48.3 | 4.62 | 4.88 | 223.1 | 2061 | |
| R-290 | 58.2 | 4.09 | 4.58 | 237.7 | 2197 | |
| R-600 | 59.2 | 3.78 | 4.86 | 223.9 | 2069 | |
| R-600a | 54.2 | 4.21 | 4.77 | 228.4 | 2110 | |
1) Calculated based on CO2 emission average of fuel resources: CO2 lb/kWh =1.54 for USA [17]
Environmental effect and economic analyses that are listed in Tables 4 and 5 illustrate comparisons of several parameters. More energy saving can be achieved by alternative refrigerants. It can contribute in reducing gaseous emission of CO2 due reduction of fuel consumption. In case of the effort in finding alternative
refrigerant for a new refrigeration system is conducted, opportunities of reducing the emission and energy saving is more significant than the retrofitting effort of refrigerants.
Table 5. Electric consumption based on compressor load
| Fluid | 1 Chiller | 2 | Load | Spc E. | Elec. 3 | ||
|---|---|---|---|---|---|---|---|
| I | II | III | Act | TR | kW/ TR | Cost Rp. | |
| V | A | 58.8 | 132,340 | ||||
| R-22 | V | B | 104.3 | 0.75 | 234,746 | ||
| V | V | C | 250.2 | 563,120 | |||
| V | V | V | F | 309.0 | 695,461 | ||
| V | A | 58.8 | 126,933 | ||||
| R-152a | V | B | 104.3 | 0.72 | 225,155 | ||
| V | V | C | 250.2 | 540,114 | |||
| V | V | V | F | 309.0 | 667,047 | ||
| R-600 | V | A | 58.8 | 106,170 | |||
| V | B | 104.3 | 0.72 | 188,326 | |||
| V | V | C | 250.2 | 451,766 | |||
| V | V | V | F | 309.0 | 557,936 | ||
| R-600a | V | A | 58.8 | 108,286 | |||
| V | B | 104.3 | 0.74 | 192,078 | |||
| V | V | C | 250.2 | 460,768 | |||
| V | V | V | F | 309.0 | 569,054 | ||
1) I: 58.8 TR; II: 104.3 TR; III: 145.9 TR
It looks that retrofitting has constraints such as the possibility of compressor works at the condition near the existing refrigerant. Several researches focusing on alternative refrigerants of HC reduced flammability by mixing the refrigerant with other fluids. Mixtures of either HC or HFC refrigerants were implemented on refrigerating system. Experimental works for the implementation of the mixture refrigerants were reported elsewhere [1, 4, 6, 7]. Accuracy of these works depends on the effort result in preparing thermophysical properties for the mixtures. Without accurate data, the analysis works cannot be conducted well.
Thermodynamic, transport, and thermal properties data are important data in developing efficient thermal system, not only refrigeration system but also power systems. Up to now, only a few of fluids have International models that can derive reliable thermophysical properties [18]. Even though there is a constraint, efforts to implement alternative refrigerants are also antusiative. Practical way may sometimes be conducted to evaluate performance of thermal systems. Mixing of special property fluid are opportunity in reducing flammability of their application. R-125 is 2) Refrigeration capacity of 309 TR, it operates around 6 hours.
2) Activities, A: wedding parties (1000 people); B: graduation ceremonies (2000 people); C: musical concert activities (5000 people); F: full capacity
3) Commercial electric cost assumed as Rp. 625.00/kWh
HFC refrigerant that is prospective to be used as blend fluids to reduce flammability, even though its thermodynamic performance is not very good. Open space for chiller installation can be given as alternative solution to avoid fire risks. Location of chiller on roof is also possible alternative solution in practice including metropolitan building.
CONCLUSIONS
Retrofitting, which is effort to find drop-in alternative refrigerants, is very important for developing country to solve environmental issues. Selection of alternative refrigerants contributes on energy saving. Considering national resources and potentials, judgment in refrigerant selection should be involved in order to get economical cost. Correct selection of refrigerants plays important role on saving energy and earth.
Two groups of alternative refrigerants, i.e. HC and HFC refrigerants have competitive performances. In consideration of Indonesian interests, determining HC refrigerants as alternative refrigerants gives more valuable policy. R-32 and R-290 have good energy transport property, but both of them are flammable.
Flammability of alternative refrigerants is still problem up to now. Mixtures of alternative refrigerants are opportunity in reducing flammability in their application. R-125 is HFC refrigerant that is prospective to be used as blend fluids to reduce flammability. Open chiller space is an alternative for flammable refrigerants.
NOMENCLATURES
Csp. : Capacity
COP : Coefficient of performance
E : Consumption Energy
Elec. : Electric GTH : Grand total heat m : Mass flow Mn : Month
OALH : Outdoor air latent heat OASH : Outdoor air sensible heat
q : Heat flow
p r : Ratio of pressure
Rp. : Indonesian Currency (Rupiah)
RLH : Room latent heat RSH : Room sensible heat
Spc. : Specific
TR : Ton Refrigeration, 1 TR = 3.517 kW
W : Work
Subscripts
e : Evaporator c : Compressor rf : Refrigerant
ACKNOWLEDGEMENT
We would like to thank Faculty of Industrial Technology ITB for supporting this thermodynamic simulation.
5. REFERENCES
- 1. S. Devota, A.V. Waghmare, N.N. Sawant, and B.M. Domkundwar, Alternatives to HCFC-22 for Air Conditiners, Applied Thermal Engineering, 21, 703-715, 2001.
- 2. E. Granryd, Hydrocarbons as refrigeans –an overview, International Journal of Refrigeration, 24, 15-24, 2001.
- 3. D.B. Bivens and B.H. Minor, Fluoroesthers and Other Generation Fluids, International J. Refrigeration, 21(7), 567-576, 1998
- 4. O.R. Neilsen, Application of HC Refrigerants in Refrigerating System and Heat Pumps, Proc. Seminar on Ods Phase-out: Solutions for the Refrigeration Sector, Kuta Bali, pp. 97-101, 1999.
- 5. T. Sulistiyanto, P. Atmadi, N. Damitri, C. Soekardi, and Kafi'uddin, Energy Saving Potential by Utilization of Hydrocarbon Refrigerant in Commercial Buildings, Proc. Seminar on Ods Phase-out: Solutions for the Refrigeration Sector, Kuta Bali, pp. 138-143, 1999.
- 6. N.P. Tandian, A. Suwono, A.D. Pasek, T. Hardianto, T.A.F. Soelaiman, B.T. Prasetyo, and Kafi'uddin, Performance Testing of Indonesian Hydrocarbon Refrigerants, Proc. Seminar on Ods Phase-out: Solutions for the Refrigeration Sector, Kuta Bali, pp. 133-137, 1999.
- 7. R.S. Argawal, Retrofitting of Domestic and Small Capacity Commercial Refrigerating Appliances Using Hydrocarbon Blends, Proc. Seminar on Ods Phase-out: Solutions for the Refrigeration Sector, Kuta Bali, pp. 40-47, 1999.
- 8. Carrier Air Conditioning Co, Handbook of Air Conditioning System Design, New York, McGraw-Hill, 1965.
- 9. ASHRAE, ASHRAE Handbook: Fundamentals, SI Edition, 1993.
- 10. B.A. Younglove and J.F. Ely, Thermophysical properties of fluids. II. Methane, Ethane, Propane, Isobutane and Normal butane, Journal of Physics and Chemical Reference Data, 16, 577-798, 1987.
- 11. I M. Astina and H. Sato, A Rational Helmholtz Fundamental Equation of State for Difluoromethane with an Intermolecular Potential Background, International Journal of Thermophysics, 24(4), 963-990, 2003.
- 12. I M. Astina and H. Sato, A Rational Fundamental Equation of State for Pentafluoroethane with Theoretical and Experimental Bases, International Journal of Thermophysics, 25(1), 113-131 (2004).
- 13. I M. Astina and H. Sato, A Fundamental Equation of State for 1,1,1,2-Tetrafluoroethane with Intermolecular Potential Energy Background and Reliable Ideal-Gas Properties, Fluid Phase Equilibria, 221, 103-111, 2004.
- 14. E.W. Lemmon and R.T. Jacobsen, An International Standard Formulation for the Thermodynamic
- Properties of 1,1,1-Trifluoroethane (HFC-143a) for Temperatures From 161 to 450 K and Pressures to 50 MPa, Journal of Physics and Chemical Reference Data, 29(4), 521-552, 2000.
- 15. I M. Astina and H. Sato, A Rigorous Thermodynamic-Property Model for Fluid-Phase 1,1-Difluoroethane (R-152a), International Journal Thermophysics, 25(6), 1713-1733, 2004.
- 16. A. Kamei, S.W. Beyerlein, and R.T. Jacobsen, Application of nonlinear regression in the development of a wide range formulation for HCFC-22, International Journal of Thermophysics, 16(5), 1155-1164, 1995.
- 17. A. Wilson, J. Thorne, and J. Morril, Consumer Guide to Home Energy Savings, 7<sup>th</sup> edition, American Council for an Energy-Efficient Economy, California, 1999.
- 18. K. Watanabe and J.W. Widiatmo, Alternative Refrigerants and Their Thermophysical Properties, Proc. Seminar on Ods Phase-out: Solutions for the Refrigeration Sector, Kuta Bali, pp. 71-80, 1999.
- 19. A. Woolf, An Alternative Coding for hydrofluorocarbons and Their Ethers, International Journal of Refrigeration, 20(6), 452-455, 1997.