

M E S I N
Jurnal Teknik Mesin Vol. 20, No. 2, Oktober 2005 No. ISSN: 0852-6095
Diterbitkan oleh : Departemen Teknik Mesin, FTI
Institut Teknologi Bandung
Surat ijin : STT No. 964/DIT-JEN/PPG/STT/1982.
MESIN Vol. 20 No. 2 i
DAFTAR ISI
| Studi Numerik Pengaruh Jumlah dan Puntiran Swirler Vanes pada Aliran | |
|---|---|
| Masuk Tabung | |
| I Gede Parwatha, Firman Hartono, Hisar M. Pasaribu, | |
| Djoko Sardjadi dan Aryadi Suwono | 40 |
| Analysis of Using Alternative Refrigerants for Energy Saving in Design Framework of Air-Conditioning System | |
| I Made Astina, Prihadi Setyo Darmanto, Warsito and Edwin Adryanto | 49 |
| Pengembangan Metode Simulasi Sistem Pengkondisian Udara Energi Surya | |
| Agus Hermanto, Aryadi Suwono, Abdurrachim dan Ari D. Pasek | 58 |
| Measuring and Compensating for Off-Line to Running Machinery Movement | |
| Phan Anh Tuan, Zainal Abidin and Komang Bagiasna | 68 |
| Analisis Frekuensi pada Uji Tak Merusak Ultrasonik | |
| Amoranto Trisnobudi | 73 |
M E S I N
Jurnal Teknik Mesin
Vol. 20, No. 2, Oktober 2005
Phan Anh Tuan<sup>(1)</sup>, Zainal Abidin<sup>(2)</sup> and Komang Bagiasna<sup>(2)</sup>
(1)Mechanical Engineering Departement - ITB (2)Dynamic Laboratory, PAU-ITB
Ringkasan
Umumnya, mesin-mesin rotasi yang dihubungkan satu dengan yang lainnya akan mengalami perubahan posisi selama dijalankan dan kondisi ini akan mempengaruhi kesesumbuan poros selama beroperasi. Selama ini, karakteristik pergerakan mesin rotasi di industri dari keadaan diam hingga berputar belum pernah diukur. Padahal, besar pergerakan mesin yang terjadi sangatlah penting untuk diketahui sebelum menyimpulkan apakah pergerakan itu cukup siknifikan atau dapat diabaikan. Makalah ini akan memperlihatkkan karakteristik ketidaksesumbuan poros dalam keadaan panas dan dingin. Tujuan penelitian ini adalah untuk menganalisis pengaruh temperatur terhadap ketidaksejajaran pada mesin rotasi yang sudah pernah disebutkan pada beberapa referensi sebelumnya tetapi tidak pernah diselidiki. Tujuan utama penelitian ini adalah untuk memperoleh karakteristik ketidaksesumbuan panas dan untuk mengkompensasi pergerakan mesin dari keadaan diam hingga mesin berputar (OL2R). Hasil eksperimen dan analisis menunjukkan bahwa kondisi ketidaksesumbuan poros berubah selama beroperasi dan hal tersebut sangat mempengaruhi tingkat getaran pada mesin-mesin rotasi. Dalam kasus ini, semakin kecil nilai misalignment, semakin kecil tingkat getaran pada mesin rotasi.
NOTATION
x = Displacement
m = Mass
g = gravity
M = Bending moment
\(\dot{\Delta}\) = Deflection
U = Potential energy
P = Weight
1 = Length
E = Modulus of elasticity
J = Inertial cross-section moment
1. INTRODUCTION
Coupling-connected machinery is popularly used in industries, in which misalignment always occurs and is unexpected. When excessive misalignment occurs, the machine will experience excessive axial and radial
forces on the bearings, which reduce bearing's life under dynamic operating conditions. A previous research had shown that vibration due to misalignment is a strong function of machine speed and coupling stiffness [1].
Understanding how to determine and correct excessive misalignment in plant equipments is essential for machine reliability and smooth operation. Furthermore, the cost of doing alignment is typically very small when compared with the cost of the lost of the production of failing equipment [2].
The OL2R machinery movement is the movement of rotating shafts from stand still to running condition. This movement may be caused by many factors but the most influencing factor is considered to be temperature change.
MESIN Vol. 20 No. 2 68
In order for the shafts to run collinearly under normal operating condition, it is desirable to know the amount and direction of OL2R movement. Thus, allowing to position the machinery's shafts under off-line condition so that they are align in running condition. This process is meant to compensate for off-line to running change.
2. METHODS FOR MEASURING MISALIGNMENT
Many years ago, people had to align only by dial indicators. Many setups could be used for measuring misalignment by this way. Generally, there are three methods: face – and – rim, reverse – indicator, and face – face – distance. The restriction of these methods is the way to get data in operating condition of the machine (high temperature).
One development in misalignment instrument is infrared tool. This tool allows to measure misalignment in high temperature condition [3]. However, due to developing of laser technology this type of instrument does not widely used nowadays.
In the 1980's, the laser instruments became available and they are the good instruments for measuring machine's alignment in both cool and hot conditions. There are two types of laser instruments used for alignment produced by Prüftechnik. One of those instruments is called OPTALIGN and the other one is called ROTALIGN.
3. EXPERIMENTAL APPARATUS AND PROCEDURE
The setup for doing experiment is a pair of generatorelectric motor. Hot misalignment experiment is measured by Face/Rim two dial indicators method. The setup for measuring misalignment using dial indicators is shown in Figure 3. For measuring misalignment by Rim/Face two indicators, the aligner has to read the value of the dial indicators at the angular shaft position of 0, 90, 180, 270 degrees. The data is taken when the temperature of the motor's shaft reached to 24.6°C, 39.6°C, 63.8°C and 78.9°C.
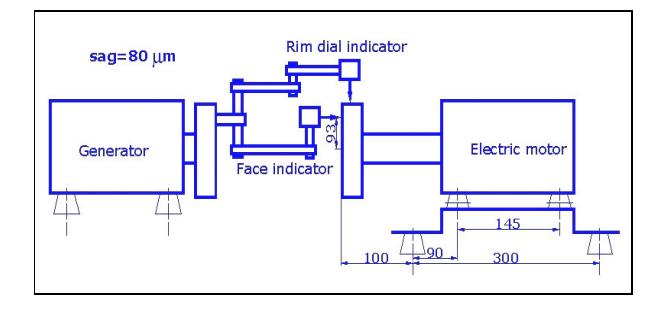
Figure 3. Setup for experiments
The off-line to running machinery movement is measured by laser sensors. The movement of vertical and horizontal planes is measured in two different
occasions. Figure 4 shows the setup for measuring OL2R movement. Two laser sensors are used for measuring OL2R movement of shafts of the generator and the electric motor. Sensor 1 measures the movement of electric motor's shaft and sensor 2 measures the movement of generator's shaft.
Figure 4. Setup for measuring OL2R movement
4. RESULTS AND DISCUSSION
4.1 Hot Misalignment
The results of measurement obtained in the hot experiment are shown in Figure 5. The numbers outside the circles are values of Rim indicator reading while the numbers inside the circles are values of Face indicator reading. Based on the values shown in Figure 5, the misalignment can be calculated as shown in Figure 6 and 7. Figure 6 is circles that show the values of misalignment while Figure 7 is triangles that show the detail of angular misalignment. Around the circles in Figure 6, the highest row numbers are the values of measurement and the lowest row numbers are the values for calculating misalignment. The offset misalignment is determined by dividing the value of Rim by two. In Figure 7, the direction of the triangles shows the wider positions (Top and North) of the angular misalignment. The values of angular misalignment shown in those triangles are got from the value of Face in the circles. In this figure, the word 'Sta' means stationary machine (the generator) and the word 'Adj' means machine to be adjusted for alignment (the motor). Finally, the offset misalignment is shown in Table 1 and the angular misalignment is shown in Table 2.
Based on the results appear in Table 1 and Table 2, two graphs that show the influence of temperature on misalignment could be drawn as in Figure 8 and Figure 9. Figure 8 demonstrate the influence of temperature on offset misalignment while Figure 9 shows similar influence on angular misalignment. The vertical axis of those graphs is the values of misalignment and the horizontal axis is the values of temperature.
69 MESIN Vol. 20 No. 2
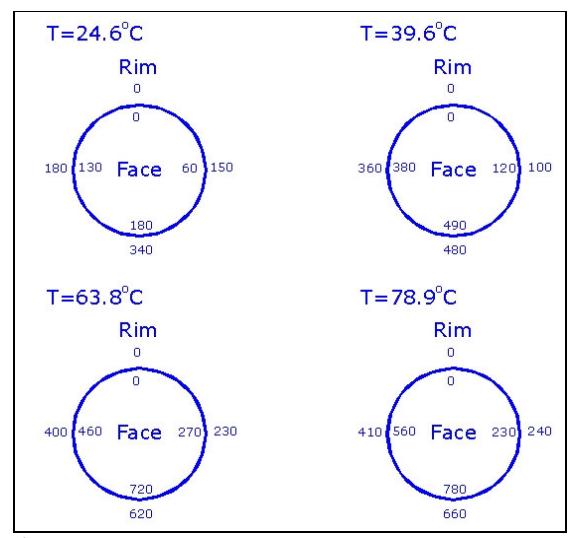
Figure 5. Result of measuring hot misalignment
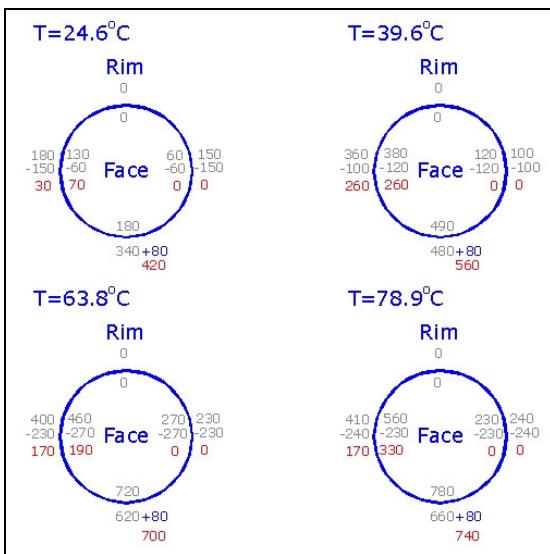
Figure 6. Hot misalignment
Table 1. Hot offset misalignment
| Offset misalignment (µm) | ||||
|---|---|---|---|---|
| oC 24.6 | oC 39.6 | oC 63.8 | oC 78.9 | |
| Vertical | 210 | 280 | 350 | 370 |
| Horizontal | 15 | 130 | 85 | 85 |
Table 2. Hot angular misalignment
| Offset misalignment (µm) | ||||
|---|---|---|---|---|
| oC 24.6 | oC 39.6 | oC 63.8 | oC 78.9 | |
| Vertical | 180 (T) | 490 (T) | 720 (T) | 780 (T) |
| Horizontal | 70 (N) | 260 (N) | 190 (N) | 330 (N) |
(T means wide at Top and N means wide at North)
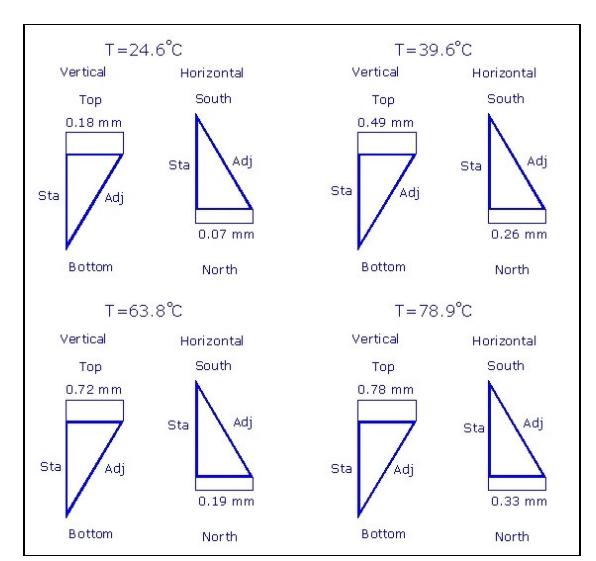
Figure 7. Hot angular misalignment
4.2 OL2R Machinery Movement
The OL2R movement is measured by laser sensors. The movement of shafts in vertical and horizontal planes is measured in two different occasions. The shaft movement in vertical plane as a function of running time and raising temperature is shown in Table 3 while in horizontal plane's one is shown in Table 4.
Based on the results of measurements, some graphs that show the influence of temperature on movement are drawn as in following figures. Figure 10 shows the influence of temperature change on motor shaft movement. Figure 11 shows the influence of temperature change on movement of the generator's shaft. Figure 12 shows the differential movement between electric motor's shaft and generator's shaft. This graphs show that the higher the temperature of the shafts, the higher the differential movement between electric motor's shaft and generator's shaft, and thus the misalignment between these two shafts.
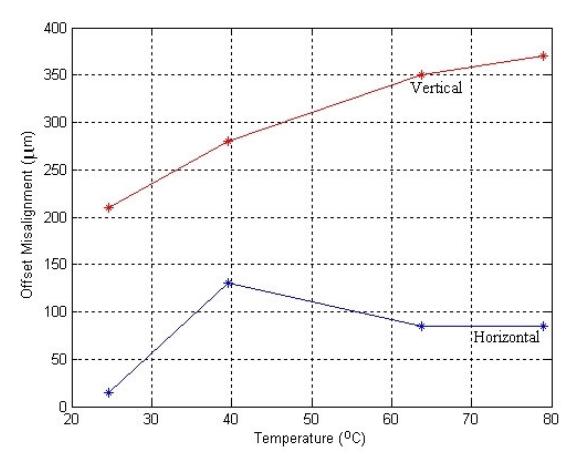
Figure 8. Graph of hot offset misalignment
MESIN Vol. 20 No. 2 70
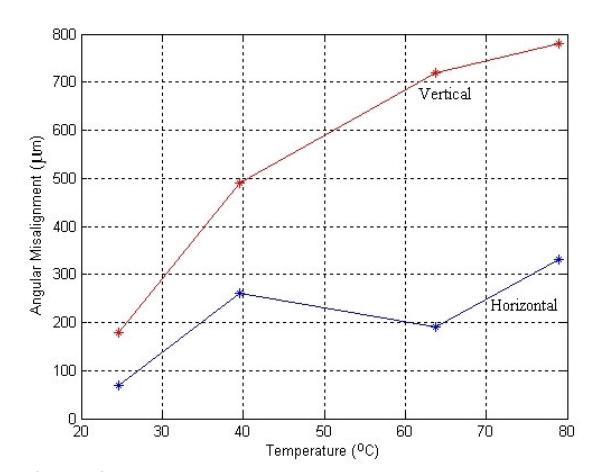
Figure 9. Graph of angular misalignment
Table 3. Shaft position of vertical plane
| Electric Motor's | Generator's shaft | |||
| Time | shaft | |||
| (minu | Positi | Temperatu | Temperatu | |
| te) | on | re | Position | re |
| (µm) | oC | (µm) | oC | |
| 0 | 8 | 25.3 | 2 | 25.3 |
| 5 | 15 | 32.9 | 6 | 26.3 |
| 10 | 54 | 40.1 | 20 | 26.9 |
| 15 | 65 | 46.5 | 23 | 27.5 |
| 20 | 96 | 49.8 | 41 | 28.2 |
| 25 | 115 | 57.5 | 51 | 29.7 |
| 30 | 119 | 61.7 | 54 | 30.4 |
Table 4. Shaft position of horizontal plane
| Electric Motor's | Generator's shaft | |||
|---|---|---|---|---|
| Time | shaft | |||
| (minu | Positi | Temperat | Temperat | |
| te) | on | ure | Position | ure |
| (µm) | oC | (µm) | oC | |
| 0 | 7 | 24.9 | 2 | 24.9 |
| 5 | 21 | 33.2 | 6 | 27.1 |
| 10 | 35 | 39.9 | 8 | 28.2 |
| 15 | 46 | 47.2 | 15 | 29.0 |
| 20 | 54 | 51.1 | 17 | 29.3 |
| 25 | 62 | 55.6 | 21 | 29.9 |
| 30 | 66 | 58.9 | 24 | 30.1 |
4.3 Compensating for OL2R Movement
The OL2R movement is compensated by lowering the position of the electric motor's feet. The compensation method for OL2R movement in this way is shown in Figure 13. The inboard feet of the electric motor are reduced 200µm while the outboard feet are reduced 100µm.
Vibration levels of the system are measured in two conditions, before and after compensation, using a Multi-channels Spectrum Analyzer (MSA). Figure 14 shows the vibration spectrum before compensation while Figure 15 shows the vibration spectrum after compensation.
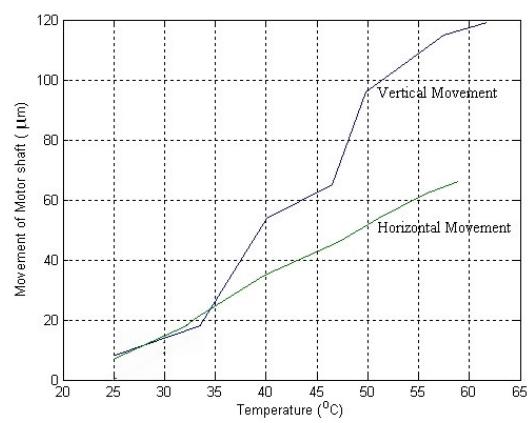
Figure 10. Position of electric motor's shaft
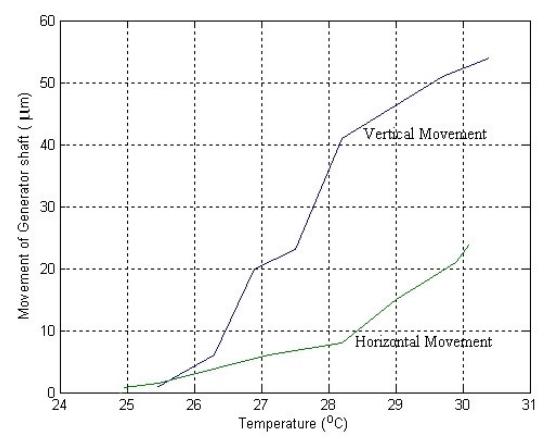
Figure 11. Position of generator's shaft
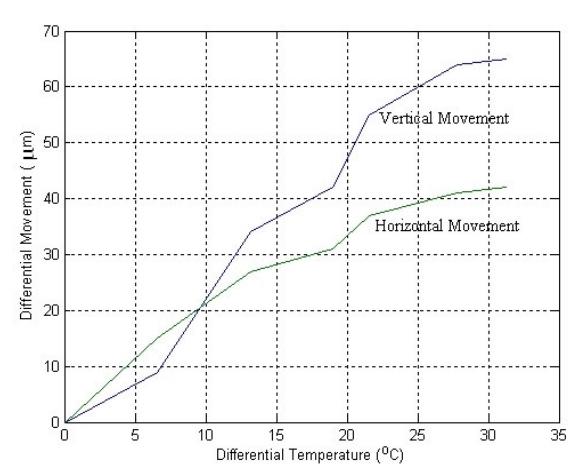
Figure 12. Differential movement between two shafts
Based on the result shown on Figures 14 and 15, a comparison graph of vibration level obtained before and after compensation is drawn as in Figure 16. The separate star (*) points are RMS levels of power spectrum before compensation and the star (*) points on the lines are RMS levels of power spectrum after compensation. As shown in this figure, after compensation, the vibration level in vertical plane reduces by 31.5% while the vibration level of horizontal plane reduces by 28.5% and the vibration level of axial plane reduces by 38.4%.
71 MESIN Vol. 20 No. 2
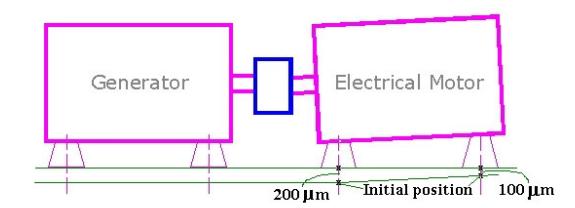
Figure 13. Compensation for OL2R movement
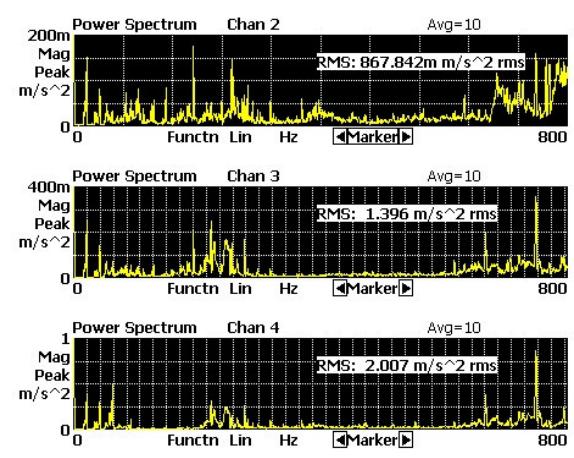
Figure 14. Vibration spectrum before compensation
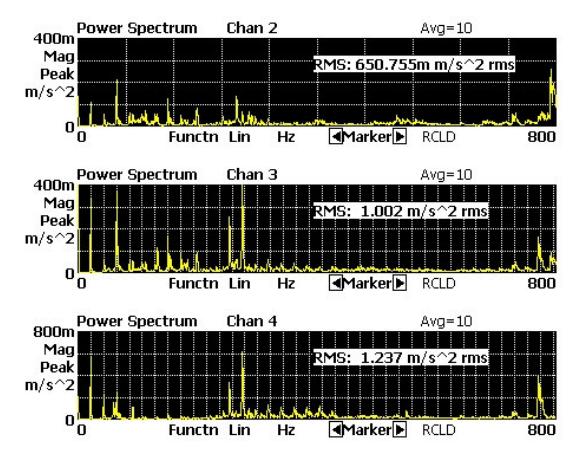
Figure 15. Vibration spectrum after compensation
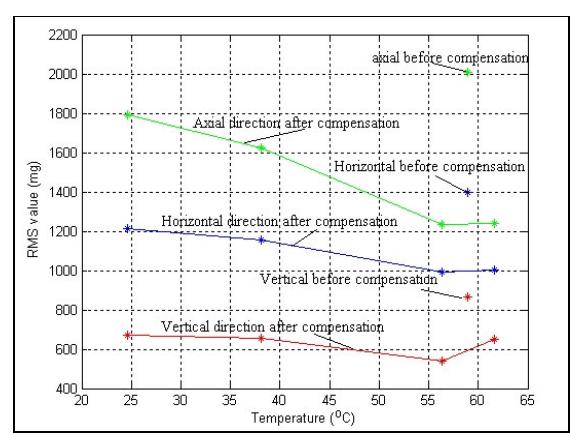
Figure 16. Vibration levels between before and after compensation
5. CONCLUSION
The experimental results show that misalignment always occurs in rotating machinery and the misalignment has strong influence on the vibration level of the machinery. In general case, the smaller the misalignment value, the smaller vibration level of the system.
The graphs in figures 10-12 have demonstrated that the increase of temperature cause the shaft movement during running time. Differential movement of the shafts causes of increasing of misalignment level thus raising vibration level.
It is possible to compensate for OL2R movement so that the vibration level reduces during operating condition.
6. REFERENCES
- [1] S. Ganeriwala., The Truth behind Misalignment Vibration Spectral of Rotating Machinery, Richmond – VA 23228, www.spectralquest.com
- [2] VibrAlign magazine, Dynamic Movement White Paper, VibrAlign Inc, Richmond – VA 232326, www.vibralign.com 2002
- [3] M.M James., Discovering Misalignment with Infrared: The damage is done, Technical Services Representative, Mississippi Power Company, 2001
MESIN Vol. 20 No. 2 72