

M E S I N
Jurnal Teknik Mesin Vol. 21, No. 1, April 2006
Diterbitkan oleh : Program Studi Teknik Mesin, FTI
Institut Teknologi Bandung
Surat ijin : STT No. 964/DIT-JEN/PPG/STT/1982.
MESIN Vol. 21 No. 1 i
DAFTAR ISI
| Analisis besar kesalahan magnitude fungsi respon frekuensi hasil pengujian dengan metode eksitasi kejut akibat keterbatasan panjang waktu rekam | |
|---|---|
| Agusmian Partogi, Zainal Abidin dan Komang Bagiasna | 1 |
| Modifikasi top cyclone untuk meningkatkan kinerja suatu pabrik semen Prihadi Setyo Darmanto dan Arief Syahlan | 10 |
| Influence of sintering temperature and holding time on tensile strength and shrinkage of pvc specimen on indirect pressure-less sintering process S.A. Widyanto, S. Riyadi, A.E. Tontowi, Jamasri and H.S. Rochardjo | 16 |
| Crack detection using operating deflection shape | |
| Tran Khanh Duong , Djoko Suharto, Komang Bagiasna, Zainal Abidin | 21 |
| Pack carburizing pada sprocket sepeda motor dengan material baja karbon rendah | |
| Budi Hartono Setiamarga, Novi Kurniawati dan Umen Rumendi | 28 |
M E S I N
Jurnal Teknik Mesin
Vol. 21, No. 1, April 2006
Tran Khanh Duong (1) , Djoko Suharto (2) , Komang Bagiasna (3) , Zainal Abidin (3)
- (1) Former Master Student, Mechanical Engineering Dept – Institut Teknologi Bandung, Mechanical Engineering Faculty – Hanoi University of Technology
- (2) Mechanical Engineering Department Institut Teknologi Bandung
- (3) Dynamic Laboratory, Center of Engineering Science Institut Teknologi Bandung
Ringkasan
Penelitian ini menyajikan pengembangan metoda deteksi retak berbasis getaran yang menggunakan analisis Operating Deflection Shape(ODS) terhadap data yang diukur oleh Laser Doppler Vibrometer (LDV). Verifikasi terhadap metoda tersebut dilakukan melalui kaji numerik dan eksperimen. Program NASTRAN digunakan untuk mengkaji model numerik 2 D dan 3D. Balok dengan dua jenis retakan digunakan untuk studi kasus 2 D. Sedangkan untuk kasus 3D pelat spesimen digunakan sebagai studi kasus. Panjang retakan and lokasinya merupakan parameter-parameter yang digunakan untuk melihat kemampuan metoda yang dikembangkan dalam mendeteksi keberadaan dan lokasi retak. Hasil kajian numerik menunjukkan bahwa keberadaan retak dapat dideteksi dengan menggunakan penurunan frekwensi pribadi, dan lokasi retak dapat secara akurat ditentukan dengan menggunakan metoda S.Sd.D.Ms (Square of the Second Derivative of the Deviation of the Mode Shape) yang dikembangkan. Ketepatan metoda prediksi kemudian divalidasi secara ekperimen. Pengukuran FRF ODS dilakukan untuk mendapatkan modus getar. Tiga jenis spesimen diuji, yaitu balok tanpa retak, dengan retak tengah ganda dan dengan retak tepi ganda. Dari hasi-hasil pengujian yang dihasilkan dapat disimpulkan bahwa metoda yang dikembangkan mampu mendeteksi lokasi retakan.
1. INTRODUCTION
Visualization of vibratory movement of a machine or structure is one of the most powerful techniques available for the diagnostics and troubleshooting today. Operating Deflection Shape (ODS) is the term used for this visualization technique. The most powerful ability of the ODS analysis is its ability to determine the mode shape of the structure under operating condition, without shutting down the machine. The method of ODS determination based on modal model makes the testing
simple because it does not require too many points of measurement. This combined technique has been developed by Kromulski and Hojan [1].
There has been an increasing application of Laser Doppler Vibrometer (LDV) for vibration measurement for the last 5 years. The advantages of LDV over conventional vibration sensors are non-contact measurement which is able to measure on a surface with extreme temperature, and easy to relocate the measurement positions. Many researches on application of LDV for vibration analysis have been performed. Deflection-shape measurement technique based on Hilbert transform measured by using a scanning LDV has been developed by Kang et al [2]. Locating the position of structural damage using ODS measured by a scanning LDV has been conducted by Pai and Jin (2000).
Some researches on global inspection method to monitor the structural health were based on ODS analysis, while others based on other analysis. Hou et al [3] and Hera and Hou [4] concentrated on damage detection in mechanical structures using wavelet analysis. This research identifies damage by comparing the natural frequencies and damping ratios obtained by analyzing two segments of data, recorded before and after damage [5]. However, there are cases when damage is not a sudden phenomenon and rather characterized by a progressive degradation of system parameters, mainly the change of the structural stiffness such as in the case of corrosion and fatigue. Moreover, this work could not be used when there is no historical data before the damage. Another research [6] was done based on ODS analysis and used the slope ratio to detect the existence and location of cracks. This research was able to detect the existence of cracks by considering the decrease of the natural frequency when there is a crack but this research did not show clearly the location of the crack. Because of that, a new reliable failure detection method to monitor the structural health based on current data without relying on the historical data is needed. The main purpose of this research is to work out the new method
2. BASIC THEORY
2.1. Influence of the Crack on the Stiffness Matrix in Finite Element Model.
A four-beam finite element model shown in Figure 1 is used to represent a fixed-fixed beam. The influence of the crack on the stiffness in the model will be illustrated as follow.
Figure 1. A four-beam finite element model used to represent a fixed-fixed beam.
The crack may be represented as a given reduction in stiffness of each element. This type of crack will not chance the mass matrix. The stiffness of the first element will be given by the expression \([\alpha_1 K_e]\). Here \(K_e\) is the local stiffness matrix of an individual element and \(\alpha_1\) is a factor used to represent the crack. The local stiffness matrix of the first beam element containing crack in Figure.1 becomes:
\[\alpha_{1}K_{e} = \frac{EI}{l^{3}} \begin{bmatrix} 12\alpha_{1} & 6l\alpha_{1} & -12\alpha_{1} & 6l\alpha_{1} \\ 6l\alpha_{1} & 4l^{2}\alpha_{1} & -6l\alpha_{1} & 2l^{2}\alpha_{1} \\ -12\alpha_{1} & -6l\alpha_{1} & 12\alpha_{1} & -6l\alpha_{1} \\ 6l\alpha_{1} & 2l^{2}\alpha_{1} & -6l\alpha_{1} & 4l^{2}\alpha_{1} \end{bmatrix}\](1)
This methodology can also be applied to the second, the third, and the fourth beam elements. The stiffness formulation in the local coordinate system is the same for all elements and the factor, \(\alpha_i\), will be used to represent the stiffness reduction of i element. In other words, the local stiffness matrix for element number i is presented by \(\alpha_i K_e\). Hence, the combining stiffness matrix is given in equation (2).
This stiffness matrix with mass matrix will produce a six-degree of freedom system equation of the fixed-fixed beam model. Changing the parameter of each \(\alpha_i\) will change the vibration amplitude of the corresponding element and its mode shape. It is expected also that the crack will have a significant influence in the mode shape and create a discontinuity in the crack location so that a singular point on the mode shape of the beam element will appear and can be detected.
\[[K] = \frac{EI}{l^3} \begin{bmatrix} (12\alpha_1 + 12\alpha_2) & (-6\alpha_1 + 6\alpha_2)l & -12\alpha_2 \\ (-6\alpha_1 + 6\alpha_2)l & (4\alpha_1 + 4\alpha_2)l^2 & 6\alpha_2l \\ -12\alpha_2 & -6\alpha_2l & (12\alpha_2 + 12\alpha_3) \\ 6\alpha_2l & 2\alpha_2l^2 & (-6\alpha_2 + 6\alpha_3)l \\ 0 & 0 & -12\alpha_3 & (2) \\ 0 & 0 & 6\alpha_3l \end{bmatrix}\] \[\text{[rumus tidak dapat ditampilkan dengan baik — lihat PDF asli]}\]
2.2. Crack Location Detection Based on Historical Data Figure 2 shows the comparison of the mode shape of the cracked and intact beam. The mode shape is derived from fixed-fixed beam with center crack at the middle of the beam using Nastran code.
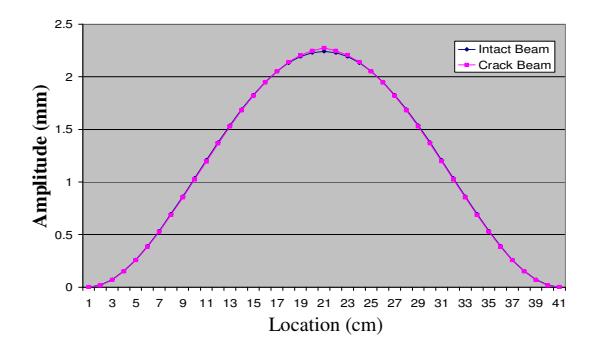
Figure 2. Comparison between mode shapes of an intact and a cracked beam (first mode).
After some observations it is found that the deviation of the mode shape of the cracked and intact beam contains singular point. Hence it is proposed to calculate the second derivative of the deviation of the mode shape (Sd.D.Ms) in order to show the singular point or the crack on the specimen. The deviation is derived from magnitude (MAG) of intact beam and cracked beam mode shape as follow:
\[DEV^{i} = MAG_{intact}^{i} - MAG_{Crack}^{i}\] (3)
The first and the second derivative of the deviation then are calculated using equations (4) and (5):
\[Fd.D.Ms^{i} = \frac{DEV^{i} - DEV^{i+1}}{\Delta r}\] (4)
\[Sd.D.Ms^{i} = \frac{Fd.D.Ms^{i} - Fd.D.Ms^{i+1}}{\Delta x}\] (5)
Furthermore, to enhance the Sd.D.Ms value, it is further observed that it is better to use its square defined as Square of Sd.D.Ms or S.Sd.D.Ms. This value will be used to detect the location of the cracks.
2.3 Crack Location Detection without Historical Data
In practice, it is very rare to obtain a mode shape of an intact structure and ODS usually are constructed from data obtained from machinery or structure in as is condition. Hence, it is likely that the measured data contained cracks or damages in the structure. However, since mode shape deviation of a cracked and an intact beam is required to detect the location of the cracks, an idea to create a virtual intact beam is proposed. Using a three-point averaging method, the discrete data from a cracked beam are recalculated by the following equation:
\[MAG_{\text{Virtual Intact}}^{i} = \frac{MAG_{Crack}^{i-1} + MAG_{Crack}^{i} + MAG_{Crack}^{i+1}}{3}\] (6)
The virtual intact mode shape is almost the same as the mode shape of the intact beam and can be used to replace the mode shape of the intact beam.
3. NUMERICAL STUDY
3.1 Two-Dimensional Model
A fixed-fixed beam (FFB) with the dimensions 400 x 40 x 4 mm is considered in this study (Figure 3). Two types of crack are simulated, namely a center crack and an edge crack. Simulation is carried out for three types of crack configuration:
- 1. Center and edge cracks with various lengths at the middle of the beam.
- 2. Center and edge cracks at different locations.
- 3. Multiple center cracks at different locations.
Figure 3. Center crack model on FFB
To illustrate the phenomenon of the natural frequency drops, Table 1 shows the comparison of the three natural frequencies of intact and center cracked beams with various crack lengths.
It is clearly seen that the trend of the frequency drop is obvious in the 1st and the 3rd natural frequencies, while in the 2nd natural frequency the change is small. Based on this result, the decrease of the natural frequency can be used to detect the existence of the crack and the length of the crack has a significant role in the natural frequency drop.
Table 1. Comparison of natural frequencies of beam with various lengths of center crack
| Center Crack at the middle of the beam: | ||||
|---|---|---|---|---|
| 1st Mode | 2nd Mode | 3rd Mode | ||
| Crack Length | (Hz) | (Hz) | (Hz) | |
| Intact Beam | 132.06 | 364.31 | 715.58 | |
| 0.125d=5mm | 131.7 | 364.3 | 713.11 | |
| 0.25d=10mm | 131.74 | 364.3 | 713.07 | |
| 0.375d=15mm | 130.54 | 364.29 | 704.25 | |
| 0.5d=20mm | 130.52 | 364.29 | 704.03 | |
| 0.625d=25mm | 127.9 | 364.23 | 685.91 | |
| 0.75d=30mm | 127.82 | 364.23 | 685.32 | |
By considering the three first mode shapes, the phenomenon of the natural frequency drop will be explained. When damage occurs, a structure would suffer a decrease in stiffness and as a consequence there is a decrease in the natural frequencies. For a beam structure, a loss in stiffness would imply an increase in the mode shape displacement. On the 1st and the 3rd mode shapes, the location of crack is in the anti-node of the mode shape, thus the natural frequency of the 1st and the 3rd mode shapes drops considerably due to the increase of the crack length. On the contrary, the crack is located on the node of the 2nd mode shape; hence the natural frequency does not decrease significantly.
To pinpoint the location of the crack, the proposed method is applied to calculate the S.Sd.D.Ms values of the mode shape of the cracked beams. Figure 4 shows the comparison between the first and the third mode shapes of intact and center cracked beams
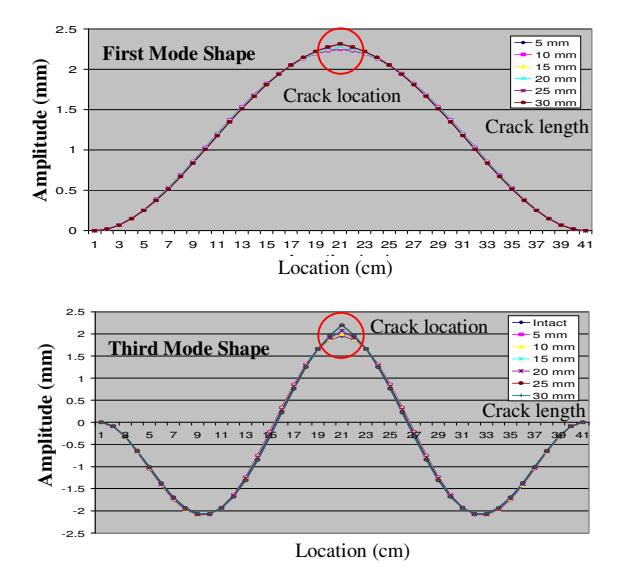
Figure 4. Mode shape comparison of center cracked beams
The results of S.Sd.D.Ms calculation is shown in Figure 5. Based on this result, it is clearly seen that there are significant values of the S.Sd.D.Ms. at the location of crack and the value of S.Sd.D.Ms increases due to the crack length. Therefore the extension of crack can be detected by the increasing value of S.Sd.D.Ms which means that damage of the beam is worse. This study is very useful to monitor the increase of the crack length in the structure during operation. It can be used for maintenance consideration whether it is necessary to repair or change the structure. Similar results are found for edge cracks with various lengths.
The S.Sd.D.Ms method is also successful in detecting multiple center cracks at different locations. The result is shown on Figure 6. In this case, two cracks of 20mm
length are located at Fixed + 120 and Fixed + 360 (using left fixed end as the survey marker). Based on these results, the locations of crack are found, they are presented by the picks on the graph. In the first mode, the picks of S.Sd.D.Ms values appear since both cracks are located at the places which have high curvature. In the third mode shape, however, the S.Sd.D.Ms pick at Fixed +360 is quite low since the crack is located near inflection point of the mode shape. Hence, it can be concluded that the proposed method can detect and pinpoint the position of more than one crack on the same beam.
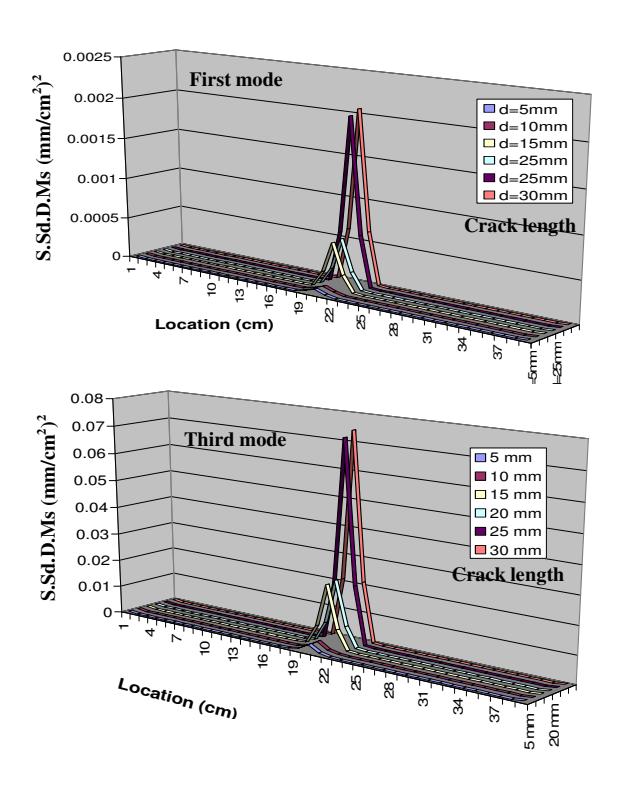
Figure 5. S.Sd.D.Ms diagram for center cracked beams
Similar results are also found for center and edge cracks at different locations. As explained, if the crack is located at the places which have high curvature then it gives a large effect to the mode shape of the beam. This phenomenon can be seen in Figure 7 in which a center crack is simulated at different locations. If a crack location is at a high curvature place then the S.Sd.D.Ms pick is quite high, but if the crack is near the point of inflection then it will give a low S.Sd.D.Ms pick on the diagram. In addition, it can be observed if the crack is located in the node point (see the crack at fixed +150 in the third mode) then the S.Sd.D.Ms. value is also low. Therefore, it can be concluded that the proposed method can be used to detect the locations of the cracks on the beam, but it should be done carefully by considering different mode shapes.
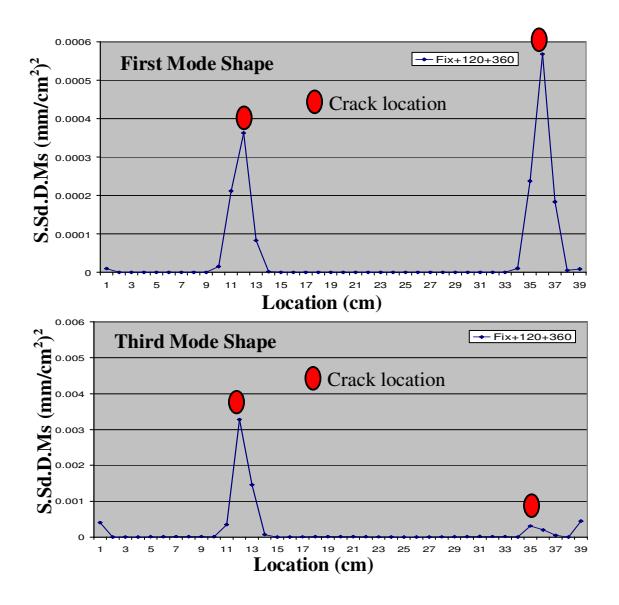
Figure 6. S.Sd.D.Ms diagram for multiple cracks
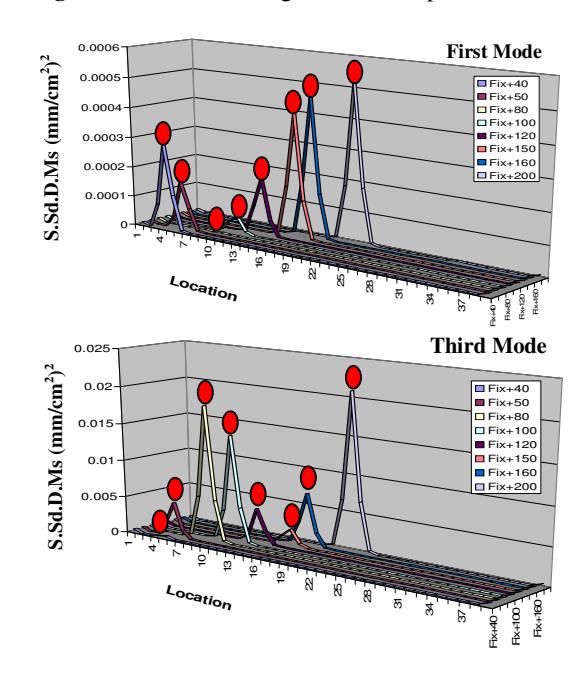
Figure 7. S.Sd.D.Ms. diagram for center crack at different locations.
3.2. Three-Dimensional Model
This model is a fixed end plate (FEP) with dimensions \(510 \times 150 \times 2\) mm. Three types of crack are studied, namely a horizontal crack at the center of the plate (x-direction), a vertical crack at the center (y-direction) and multiple cracks at different locations. The crack dimensions are \(40 \times 0.2\) mm and the FEM model of this plate is shown in Figure 8. Since the mode shape is in 3-dimensional figure, the proposed method is applied by scanning each discrete curve in either x or y-direction to find its S.Sd.D.Ms values.
Figure 8. FEM model of FEP with horizontal crack at the center.
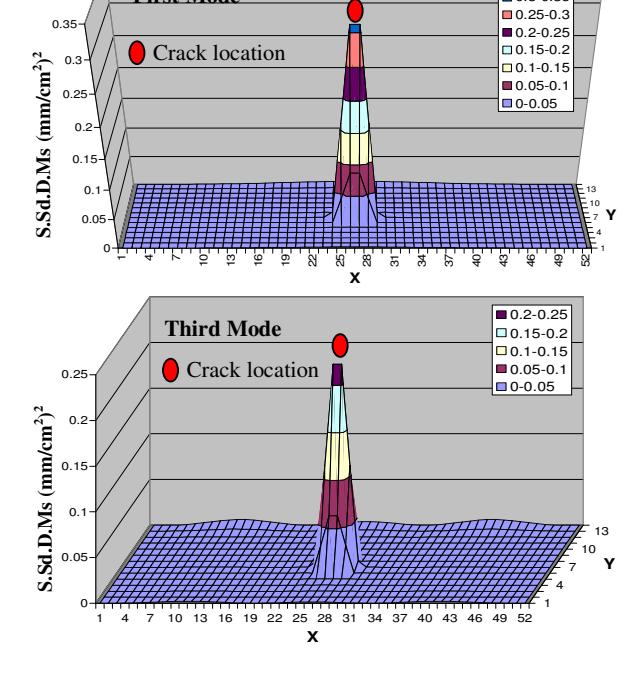
The first and the third modes of plate specimen containing horizontal crack are shown in Figure 9. S.Sd.D.Ms of horizontal crack at the center and multiple cracks at different locations are shown in Figure 10 and 11. Those figures show clearly the locations of the crack and the foot length of the picks shows the direction of the crack and its length as well.
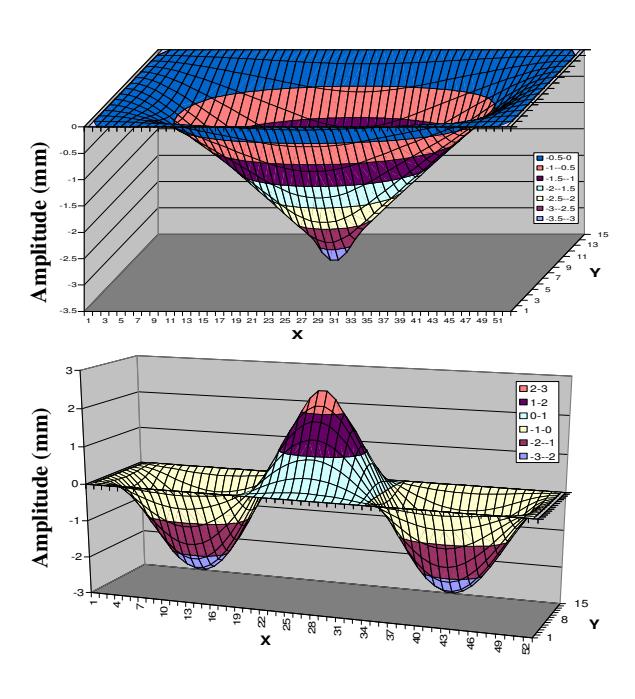
Figure 9. Mode shape of FEP
4. EXPERIMENTAL VERIFICATION
In this study, three crack beam specimens are considered, namely center cracked beam, multiplecenter cracked beam and multiple-edge cracked beam. The dimensions of beam are 500 x 40 x 2.7 mm. An exciter is used to excite the specimens using burst sine force. The exciter is located at point Fixed +230, and measured by a load cell. A Laser Doppler Vibrometer
0.3-0.35
First Mode
Figure 10. S.Sd.D.Ms. of FEP with horizontal crack at the center
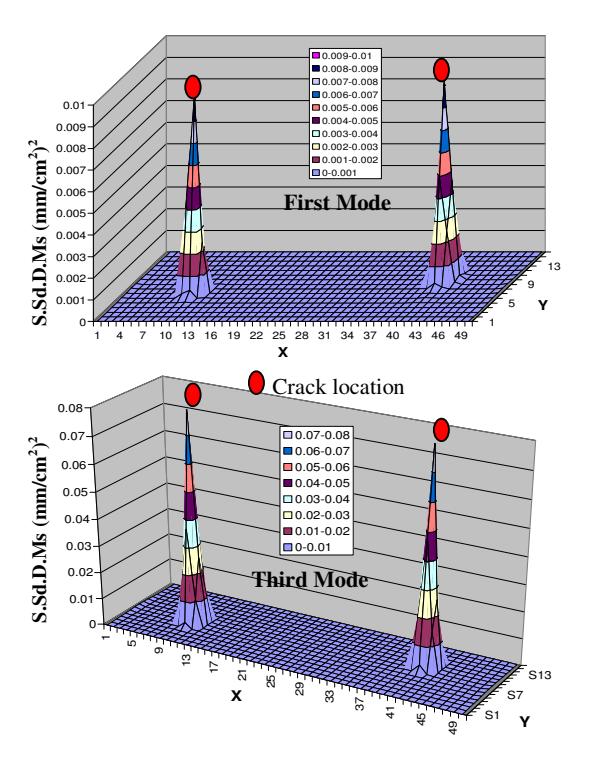
Figure 11. S.Sd.D.Ms. diagram of FEP with multiple
(LDV) is used to measure the vibration response at 50 points of measurement. The result is FRF ODS in velocity/force unit (mm/s/kgf). Figure 12 shows the third mode shape and the S.Sd.D.Ms value of the center
cracked beam specimen. The crack location can be detected successfully but there is a small pick which does not represent the crack. The small pick is the outcome of measuring the vibration of the location near the node where the vibration is very small. Moreover the sensitivity of LDV is not strong enough to detect these small vibrations accurately, thus the LDV gave untrue data.
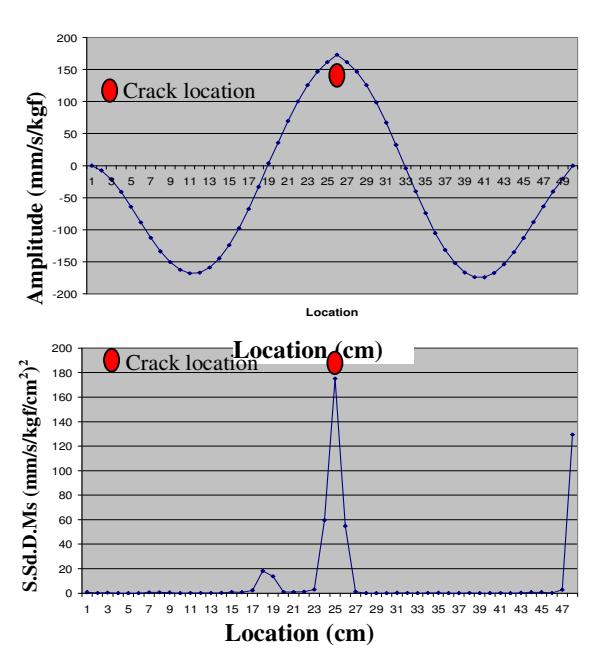
Figure 12. Third mode shape and S.Sd.D.Ms of beam with center crack
Another specimen investigated in this study is the multiple-edge cracked beam. The third mode shape and the S.Sd.D.Ms diagram to detect the crack location are shown in Figure 13. Two picks in this figure represent the existence and location of the cracks, but one of the picks has a high value and the other one has a smaller value while they should have almost the same value because they are located at the places near the anti-node of the mode shape. This phenomenon can be explained by considering the location of the measurement point. If the measurement point is near the crack then it could detect significantly the change of the mode shape. The first crack measurement point has a distance of 1mm from crack #9 (crack location is Fixed +90) while the second crack measurement point has a distance of 3mm from crack #28 (crack location is Fixed +277), so the first point has higher value than second one in the S.Sd.D.Ms diagram. Through this experiment, the new method is confirmed that it can be used to detect multiple cracks on the edge of the beam. From limited experimental verification, it can be concluded that S.Sd.D.Ms method gives promising result and worth to be investigated further. Due to experimental limitation only the third mode shape is able to be presented.
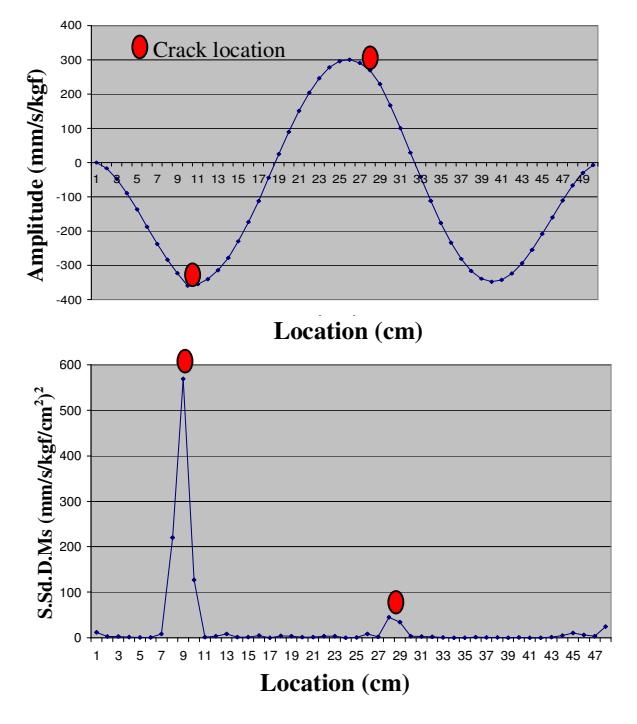
Figure 13. The third mode shape and S.Sd.D.Ms of multiple edge cracked beam.
5. CONCLUSION
The following conclusion can be drawn from this research:
- A crack has significant influence on the dynamic characteristics of a beam. A crack reduces the natural frequencies of the beam on modes which have high curvature at the location of the crack. A crack does not give a significant effect on a mode if it is located at the node or the inflection point of that mode shape.
- 2. The natural frequencies of beam decrease significantly at the mode shape, which is affected by the crack. Therefore, the natural frequency drops can be used to detect the existence of cracks. However, only the modes that have significant change on the natural frequency can be used to detect the location of crack. So it is important to select the mode shapes that give information of the location of the crack.
3. The location of a crack can be identified by using Square of the Second derivative of Deviation of Mode shape (S.Sd.D.Ms). Observing the pick value of the S.Sd.D.Ms will give information on the location, the extension of the crack and also the crack length (in 3-dimensional model) if the data is scanned for the whole area. Hence, the physical condition of the structure can be appraised.
6. REFERENCES
- 1. J. Kromulski, E. Hojan., An Aplication of Two Modal Analysis Methode for Determination of Operational Deflection Shape, Journal of Sound and Vibration 196(4), pp. 429-438,1996.
- M.S Kang., A.B Stanbridge., T.G Chang., and H.S Kim, Measuring Mode Shapes With A Continuously Scanning Laser Vibrometer-Hilbert Transform Approach, Mechanical System and Signal Processing 16(2-3), pp 201-210, 2002.
- Z. Hou., M. Noori., and St. Amand, R, A Wavelet-Based Approach for Structural Damage Detection, ASCE, Journal of Engineering Mechanics, Vol. 126, No.7, 2000.
- A. Hera and Z. Hou, Application of Wavelet Approach for ASCE Structural Health Monitoring Benchmark Studies, ASCE Journal of Engineering Mechanics, 2003.
- Z Hou., and A Hera, A System Identification Technique Using Pseudo-Wavelets, Journal of Intelligent Material Systems and Structures, Vol.12, No.10. 2001.
- W. Wirawan, Development of Vibration-Based Failure Detection Technique Using ODS Analysis, Master Thesis, Mechanical Engineering Dept., ITB 2000.
- L Meirovitch, Elements of Vibration Analysis, McGraw-Hill Book Company, New York, U.S.A., International Student Edition, McGraw-Hill Kogakusha, Ltd. 1986.
- P.F Pai and S Jin, Locating Structural Damage by Detecting Boundary Effects, Journal of Sound and Vibration, 231(4), pp 1079-1110, 2000.