

M E S I N
Jurnal Teknik Mesin Vol. 22, No. 2, Oktober 2007 ISSN 0852-6095
Diterbitkan oleh : Program Studi Teknik Mesin,
Fakultas Teknologi Industri - ITB
Surat ijin : STT No. 964/DIT-JEN/PPG/STT/1982.
DAFTAR ISI
| Thermodynamic property model of wide-fluid phase n-butane. Chan Sarin, I Made Astina, Prihadi Setyo Darmanto dan Haruki Sato | 44-54 |
|---|---|
| Sifat mampu nyala dan massa optimum refrigeran campuran R-290/R-22 Sebagai alternatif pengganti R-22 | |
| Ari Darmawan Pasek, Aryadi Suwono, Novianti Nugraha dan Usman Rosyadi | 55-61 |
| Optimisasi proses pemesinan EDM wire cut untuk modus gerak sirkular menggunakan algoritma genetik. | |
| Sigit Yoewono Martowibowo dan Adriansyah | 62-68 |
| Effects of hydrogen addition into intake air on hydrocarbon emission of gasoline engines at cold start condition. | |
| Arief Haryanto, Wiranto Arismunandar dan Gerard George Engel | 69-72 |
| Particle size distribution and rheological characteristic of trimethylolethane treated by cationic surfactant. | |
| Yuli Setyo Indartono, Hiromoto Usui, Hiroshi Suzuki, Satoshi Tanaka, Kousuke Nakayama, Yohiyuki Komada dan Tetsu Itotagawa. Mu | 73-80 |
| Pemanfaatan system CAD/CAM/CAE dalam reverse dan forward engineering untuk turbin Francis. | |
| Indra Djodikusumo, Lukman Santoso dan Rahmat Haris. Mu | 81-89 |
M E S I N
Jurnal Teknik Mesin
Vol. 22, No. 2, Oktober 2007 ISSN 0856-6095
Chan Sarin<sup>(1,2)</sup>, I Made Astina<sup>(2)</sup>, Prihadi Setyo Darmanto<sup>(2)</sup> and Haruki Sato<sup>(3)</sup> (1) Mechanical Engineering Department, Institute of Technology of Cambodia, Pochentong blvd., P.O. Box 86, Phnom Penh, CAMBODIA (2) Energy Conversion Research Division, Faculty of Industrial Technology, Institut Teknologi Bandung (3) Faculty of Science and Technology, Keio University, 3-14-1 Hiyoshi, Kohoku-ku, Yokohama, 223-8522 JAPAN
Ringkasan
Sifat termodinamika yang baru n-Butana dinyatakan dalam persamaan energi bebas Helmholtz. Formulasi ini terdiri dari delapan suku yang dikenal sebagai bagian gas ideal dan delapan belas suku pada bagian residu. Persamaan ini relatif pendek dibanding dengan persamaan yang telah ada dan digunakan secara luas, termasuk persamaan yang diperkenalkan pada tahun 2006. Dalam perkembangannya, ketersediaan data eksperimental yang akurat tentang sifat fluida dan pendekatan teoritik dari sudut pandang potensial antar molekul harus dipertimbangkan untuk meyakinkan keakurasian dan untuk meningkatkan keandalan dari persamaan tingkat keadaan pada rentang tekanan dan temperatur yang luas, khususnya pada temperatur rendah dimana sifat refrigeran ini sangat dibutuhkan. Dari cakupan data eksperimental yang digunakan untuk pengembangan model ini, rentang kevalidan adalah dari titik tripel (134,895 K) sampai dengan 589 K dan tekanan sampai 69 MPa. Ketidakpastian yang timbul untuk sifat yang lain diperkirakan sebesar 0,02% pada panas jenis isobaris gas ideal, 0,2% pada densitas, 1% pada kapasitas panas, 0,2% pada tekanan uap kecuali pada temperatur rendah, 0,05 % pada densitas cair jenuh, 0,02 dan 0,8% pada kecepatan suara di fase uap dan fase lain.
1. INTRODUCTION
Among other light hydrocarbons, n-butane has notable interest in industrial and scientific sectors. The fluid and its blends have also been found to be prospective substitutes for replacing some ozone depleting substances used as working fluid in thermal systems. It is considered as environmentally safe substance due to its zero ozone depletion potential (ODP) and very small global warming potential (GWP). Flammability of n-butane imposes limitation for the amount of the fluid used in most applications as it may result in high risk
operation and high maintenance cost. By mixing nbutane with other non flammable substances, the flammability may be reduced hence safer operation.
The thermophysical properties of fluid of interest are very important for any thermal system analysis. Accurate property data that give the best information on the real fluid state points, in complement with the appropriate evaluating method, will provide the accurate analysis result. With highly developed computer technology, the optimization of system performance to achieve energy
utilization is effectively done by modeling and computer simulation. It is the fact that complexity of accurate thermodynamic property models in both properties calculation procedure and the time required for calculation gives limitation to theirs applications. Therefore simpler formulations would be encouraged. Improving awareness on complex equation of state along with the incredibly fast moving computer technology will make the accurate property models more and more applicable.
From the fundamental equation of state for pure nbutane, thermodynamic property models for its blends could be formulated by combining the equation with the equation(s) of state from different composition(s) using ideal mixing rule. The so-called excess part developed by fitting to measurement data must be added to the combined equation in order to represent the real behavior of mixture.
The most recent equation of state for n-butane explicit in Helmholtz free energy function was published in 2006 by Bücker and Wagner [1]. The equation became available after this work was completed, thus the studies were conducted independently. The model for n-butane from the above authors was developed with considering the same sets of new available experimental data used this work. Another older thermodynamic property model which is currently used in a famous thermophysical properties database software, REFPROP version 7.0 [2] was developed by Miyamoto and Watanabe [3]. The model is also given in function of Helmholtz free energy and it was created based on measurement data mostly used in this study, except the sets newly available after its publication. Prior to the equation of Miyamoto and Watanabe, a modified Benedict-Webb-Rubin (MBWR) model was established by Younglove and Ely [4]. Even the model was developed based older experimental data and the temperature scale IPTS 68, until now it is still in used as it is provided in the previous version of REFPROP software, version 6.01 [5]. A summary of more existing equations of state for n-butane is discussed in the literature of Bücker and Wagner [1]. The new fundamental equation of state for n-butane was developed with the genetic optimization procedure and multi-property regression developed by Astina [6].
2. EXPERIMENTAL DATA
Experimental data are very important for thermodynamic modeling of the empirical equation of state. Reliable input data for the modeling process contribute on the accuracy or data reproducibility of the model. Assessments of experimental data were carefully performed through literature survey to find the reliable data set. All data were prepared in the same unit system and scale. Data with temperature standard older than ITS-90 were converted into ITS-90. The distributions of available experimental data for this study are illustrated in Figure 1.
Besides the data published after 2001, the available data used in this work are reported by Miyamoto and
Watanabe [3] and will not be repeated here. In 2004, Glos et al. [7] published 66 points of \(p\rho T\)-data and sets of data at saturation boundary including 22 points of vapour pressure, \(p_s\), 22 points of saturated-liquid density, \(\rho'\), and 9 points of saturated-vapour density, \(\rho''\). Kayukawa et al. [8] reported 117 points of \(p\rho T\)-data and 11 points of each \(p_s\) and \(\rho'\).
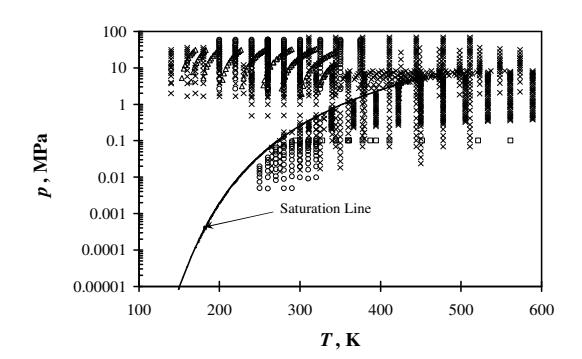
Figure 1. Distribution of available data for n-butane. (x) \(p\rho T\); (\(\Delta\)) \(c_v\); (\(\Box\)) \(c_p\); (\(\circ\)) w
Bücker and Wagner [1] compiled and summarized experimental data for n-butane including the new sets described above. There are few sets of unused data reported by Bücker and Wagner were not available in this work.
New experimental data and all data used to fit the model in the work of Miyamoto and Watanabe [3] are selected to be the input data for developing the new thermodynamic property model in this study.
3. PARAMETERS AND REFERENCE STATE
The equation of state is explicit in the two dimensionless independent parameters, reduced density, \(\delta = \rho/\rho_C\), and inverse reduced temperature, \(\tau = T_C/T\). The dimensionless parameters such as reduced pressure, \(p/p_C\), reduced density, \(\rho/\rho_C\), inverse reduced temperature, \(T_C/T\), and gas constant, \(R_m/M\), were used to avoid unit error in the development of the property model. The adopted main properties are molar mass, \(M = 58.1222 \text{ g} \cdot \text{mol}^{-1}\) [10], molar gas constant, \(R_m = 8.314472 \text{ J} \cdot \text{mol}^{-1} \cdot \text{K}^{-1}\) [9], and critical parameters determined by Haynes and Goodwin [33] cited critical pressure, \(p_C = 3.796\) MPa, critical density, \(\rho_C = 227.84\) kg·m<sup>-3</sup> and \(T_C = 425.125\) K. Triplepoint temperature \(T_t = 134.895\) K which is the lowest validity point of the equation of state was determined by Glos et al. [7]. The available data for the critical point of n-butane are summarized and reported by Bücker and Wagner [1].
Thermodynamic property model for n-butane has been developed with the reference values of specific enthalpy and specific entropy for the saturated liquid at 273.15 K. The values are 1.0 kJ·kg<sup>-1</sup>·K<sup>-1</sup> and 200 kJ·kg<sup>-1</sup> for specific entropy and specific enthalpy, respectively. This reference state has been chosen in accordance with a convention recommended by International Institute of Refrigeration.
4. ANCILLARY EQUATIONS
Three simple equations are formulated for three properties at saturation boundary \((p_s, \rho')\) and \(\rho''\)). The equations are temperature dependent and valid from triple-point temperature up to critical-point temperature. In development of the fundamental equation of state, ancillary equations are used to generate isothermal data of \(p_s\), \(\rho'\) and \(\rho''\) which are commonly available at different temperatures. The specified structural forms of each equation were fitted to the measurement data of each property. The structural forms of the equations are predefined so that the representation of the respective properties which are very difficult to measure at low temperatures and at the vicinity of the critical point can be improved.
\[\ln\left(\frac{p_s}{p_c}\right) = \sum_{i=1}^4 N_i \frac{T_c}{T} \left(1 - \frac{T}{T_c}\right)^{t_i} \tag{1}\]
\[\left(\frac{\rho'}{\rho_c} - 1\right) = \sum_{i=1}^4 N_i \left(1 - \frac{T}{T_c}\right)^{t_i} \tag{2}\]
\[\ln\left(\frac{\rho^*}{\rho_c}\right) = \sum_{i=1}^{5} N_i \left(1 - \frac{T}{T_c}\right)^{t_i} \tag{3}\]
Eqs. (1), (2) and (3) are vapour-pressure equation, saturated-liquid density equation and saturated-vapour density equation, respectively. The critical parameters used in the equations are given in Section 3. Numerical coefficients and the exponents of the equations are listed in Table 1.
Table 1. Parameters and Coefficients of Ancillary Equations
| i | \(t_i\) | \(N_{\rm i}\) | ||||
|---|---|---|---|---|---|---|
| Eq. (1) | ||||||
| 1 | 1 | -7.118750293 | ||||
| 2 | 1.5 | 2.233038424 | ||||
| 3 | 2 | -1.655008735 | ||||
| 4 | 4.2 | -2.780269129 | ||||
| Eq. (2) | ||||||
| 1 | 0.25 | 0.79146028 | ||||
| 2 | 0.5 | 1.63064845 | ||||
| 3 | 1.25 | 0.15501787 | ||||
| 4 | 3.5 | 0.24103363 | ||||
| Eq. (3) | ||||||
| 1 | 0.15 | 0.30308289 | ||||
| 2 | 0.35 | -3.11665534 | ||||
| 3 | 1.35 | -8.12557510 | ||||
| 4 | 4 | -28.74342901 | ||||
| 5 | 9.5 | -81.67581748 | ||||
5. NEW FUNDAMENTAL EQUATION OF STATE
As a Helmholtz equation of state, the thermodynamic property model for n-butane is given in a combination of two separated parts. The ideal-gas part, \(\alpha^0\), covers the ideal behavior of fluid and the so-called residual part,
\(\alpha'\), represents the residual behavior of real fluid. The ideal-gas isobaric specific heat equation was firstly established and then the ideal-gas part can be obtained by integrating the equation with respect to selected reference state as stated in Section 3. The ideal-gas part is given in Eq. (5) and its numerical coefficients are listed in Table 2.
\[\frac{c_p^0}{R} = 1 + N_3^0 + \sum_{i=4}^7 N_i^0 \tau^2 \eta_i^{0^2} \frac{\exp(-\eta_i^0 \tau)}{\{1 - \exp(-\eta_i^0 \tau)\}^2}\](4)
\[\alpha^{0}(\delta, \tau) = \ln \delta + N_{1}^{0} + N_{2}^{0}\tau + N_{3}^{0} \ln \tau + \sum_{i=1}^{7} N_{i}^{0} \ln \left\{ 1 - \exp(-\eta_{i}^{0}\tau) \right\}\] (5)
\[\alpha^{r}(\delta, \tau) = \sum_{i=1}^{7} N_{i} \delta^{d_{i}} \tau^{t_{i}} + \sum_{i=8}^{13} N_{i} \delta^{d_{i}} \tau^{t_{i}} \exp(-\delta) + \sum_{i=14}^{16} N_{i} \delta^{d_{i}} \tau^{t_{i}} \exp(-\delta^{2}) + \sum_{i=17}^{18} N_{i} \delta^{d_{i}} \tau^{t_{i}} \exp(-\delta^{3})\] (6)
The coefficients \(N_1^0\) and \(N_2^0\) are constants of integration. The ideal-gas isobaric specific heat, \(c_p^0\), equation can be written as in Eq. (4) and its numerical coefficients are also given in Table 2. Eq. (4) was fitted to the reanalysis data of Chen et al. [12] which is believed to be the most accurate source for \(c_p^0\) data.
The residual part of the fundamental equation of state developed with the genetic optimization and multiproperty regression is relatively short and can be written as in Eq. (6). Parameters and numerical coefficients of the equation are given in Table 3.
Table 2. Parameters and Coefficients of the Ideal-Gas Part
| ıı t | ||
|---|---|---|
| i | \(\boldsymbol{\eta}_{i}^{0}\) | \(N_i^0\) |
| 1 | - | -5.43318095 |
| 2 | - | 4.92293231 |
| 3 | - | 3.24801062 |
| 4 | 9.92293739 | 9.83879404 |
| 5 | 4.80578852 | 8.24084607 |
| 6 | 3.29974914 | 10.64647631 |
| 7 | 0.77501798 | 5.54502685 |
The independent parameters of the Eqs. (5) and (6) are the reduced density \(\delta = \rho/\rho_c\) and the inverse reduced temperature \(\tau = T_c/T\). The critical density and critical temperature are given in Section 3.
Table 3. Parameters and Coefficients of the Residual Part
| i | \(d_i\) | \(t_i\) | \(N_{i}\) |
|---|---|---|---|
| 1 | 1 | 0.25 | 7.558424814 ×10⁻¹ |
| 2 | 2 | 0.25 | \(2.874737492 \times 10^{-1}\) |
| 3 | 8 | 0.5 | -1.142684008 ×10⁻⁴ |
| 4 | 1 | 1.25 | \(-1.811241776 \times 10^{0}\) |
| 5 | 5 | 1.5 | \(1.149143018 \times 10^{-2}\) |
| 6 | 8 | 2.5 | \(-4.140496922 \times 10^{-6}\) |
| 7 | 2 | 3.5 | \(2.458991872 \times 10^{-3}\) |
| 8 | 7 | 0.25 | \(-5.092499231 \times 10^{-3}\) |
| 9 | 8 | 0.5 | \(1.042207957 \times 10^{-2}\) |
| 10 | 7 | 1 | \(-3.210318054 \times 10^{-2}\) |
| 11 | 3 | 1.5 | \(-3.055326240 \times 10^{0}\) |
| 12 | 3 | 1.75 | \(2.730293235 \times 10^{0}\) |
| 13 | 7 | 2 | -1.139148850 ×10⁻² |
| 14 | 5 | 2 | \(-4.337857953 \times 10^{-2}\) |
| 15 | 1 | 4 | -1.875707093 ×10⁻¹ |
| 16 | 7 | 5 | \(-6.890261888 \times 10^{-3}\) |
| 17 | 2 | 7 | \(-9.547267340 \times 10^{-3}\) |
| 18 | 3 | 18 | -1.219583966 ×10⁻² |
6. ASSESSMENT AND DISCUSSION
Accurate reproducibility for reliable and well measured data of the equation of state is the first criteria to reveal its quality. Data groups of different thermodynamic properties are compared to the values calculated from new fundamental equation of state at the same state points. The calculated values are served as base line in the comparisons to have better assessment of data from different sources. Percentage relative deviations of measured data from calculated data are mostly used as parameter for comparison.
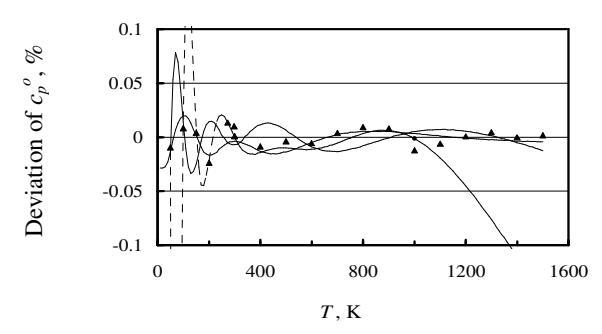
Figure 1. Deviations of ideal-gas isobaric specific heat from the new fundamental equation of state. (\(\blacktriangle\)) Chen et al. (1975); (-·-) Bücker and Wagner [1]; (—) Miyamoto and Watanabe [3]; (---) Jaeschke and Schley [13].
Assessment of reproduced ideal-gas isobaric specific heat \(c_p^o\) with the accurate reanalysis data of \(c_p^o\) is required for the assessment of ideal-gas properties. As shown in Figure 1, the reanalysis \(c_p^o\) data of Chen et al. [12] can be represented with maximum deviation of 0.024%. Deviations of others models including the models of Bücker and Wagner [1], Miyamoto and Watanabe [3] and also the equation of Jaeschke and Schley [13] from the new equation of state are also shown in the same figure for comparison. The equation of Jaeschke and Schley accurately reproduces the \(c_p^o\) data within its range of its claimed validity range (50 K to 1000 K) but for higher temperatures the accuracy systematically decreases.
The accuracy of new model for n-butane with experimental data is investigated in single phase and also at saturation. For super-critical region, the assessment was separately illustrated. Figure 2 shows the deviations of liquid-density measurements from the new thermodynamic property model. Deviations of liquid densities from different sources are mostly represented within \(\pm 0.25\%\). The data of Glos et al. [7] are accurately reproduced within ±0.06% except a single datum that has the deviation of 0.44%. It should be notified that the equation of state of Bücker and Wagner [1] can reproduce data of Glos et al. with very small error, less than 0.01%, as the authors strongly believe in the data that were published by their group. Deviations of the data of Kayukawa et al. [8] become larger with the increase of temperature and pressure and have the maximum point of 0.36%. The data of Olds et al. [14] reaches maximum deviation of 0.33%. The unused data from Kay [15] was also compared and shown in Figure 2 except several points which are off-scale from the figure.
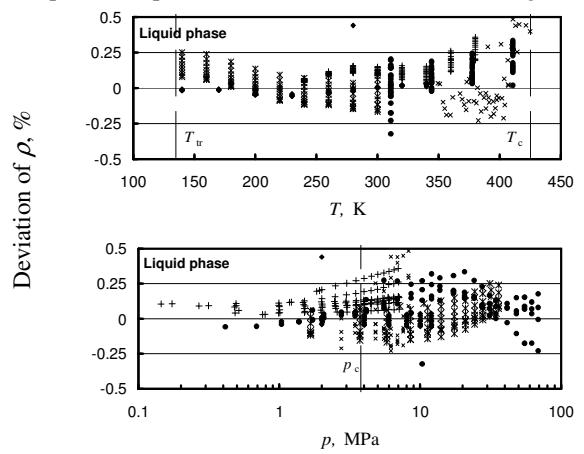
Figure 2. Deviation of liquid density from the new fundamental equation of state. (+) Kayukawa et al. [8]; (◆) Glos et al. [7]; (●) Olds et al. [14]; (*) Haynes [11]; (×) Kay [15].
In gaseous phase, deviations of experimental density data from new model are illustrated in Figure 3. The data of Gupta and Eubank [16] are in good agreement with new thermodynamic property model within \(\pm 0.17\%\). Without considering 3 points of data which seem to be unreliable, the data of Glos et al. [7] are well reproduced
within \(\pm 0.13\%\). Deviations of data from Olds et al. [14] over wider range of temperature have maximum value of 0.66%. Deviations of data that were not used as input data are also illustrated in Fig. 3 for comparing with new model. As shown in the figure, the data of Kay [15] and Beattie et al. [17] are mostly represented within \(\pm 0.7\%\).
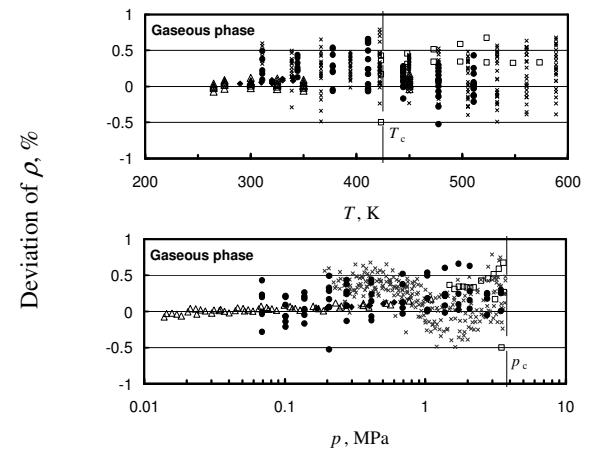
Figure 3. Deviation of gaseous density from the new fundamental equation of state. (\(\triangle\)) Gupta and Eubank [16]; (\(\bullet\)) Glos et al.[7]; (\(\bullet\)) Olds et al. [14]; (\(\times\)) Kay [15]; (\(\square\)) Beattie et al. [17].
Selected \(p\rho T\) data of Olds et al. [14] in super critical region can be reproduced by new model with uncertainties of 0.6% with respect to density. Deviations of \(p\rho T\) data in super-critical region of Olds et al. [14] and of the unused data of Kay [15] and Beattie et al. [17] are illustrated in Figure 4.
The deviations of all single-phase density data are illustrated in Figure 5. The figure shows the separated comparisons of the experimental single-phase density data with the new fundamental equation of state for n-butane. The illustration provides clearer view of data distribution with respect to data group in different temperature ranges.
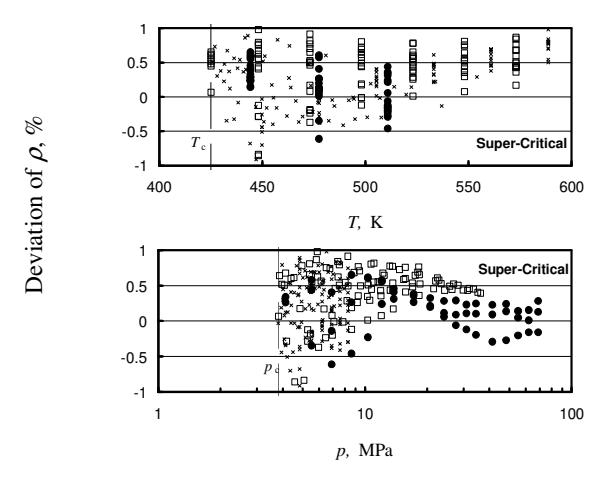
Figure 4. Deviation of density in super-critical region from the new fundamental equation of state. (\(\bullet\)) Olds et al. [14]; (\(\times\)) Kay [15]; (\(\square\)) Beattie et al. [17].
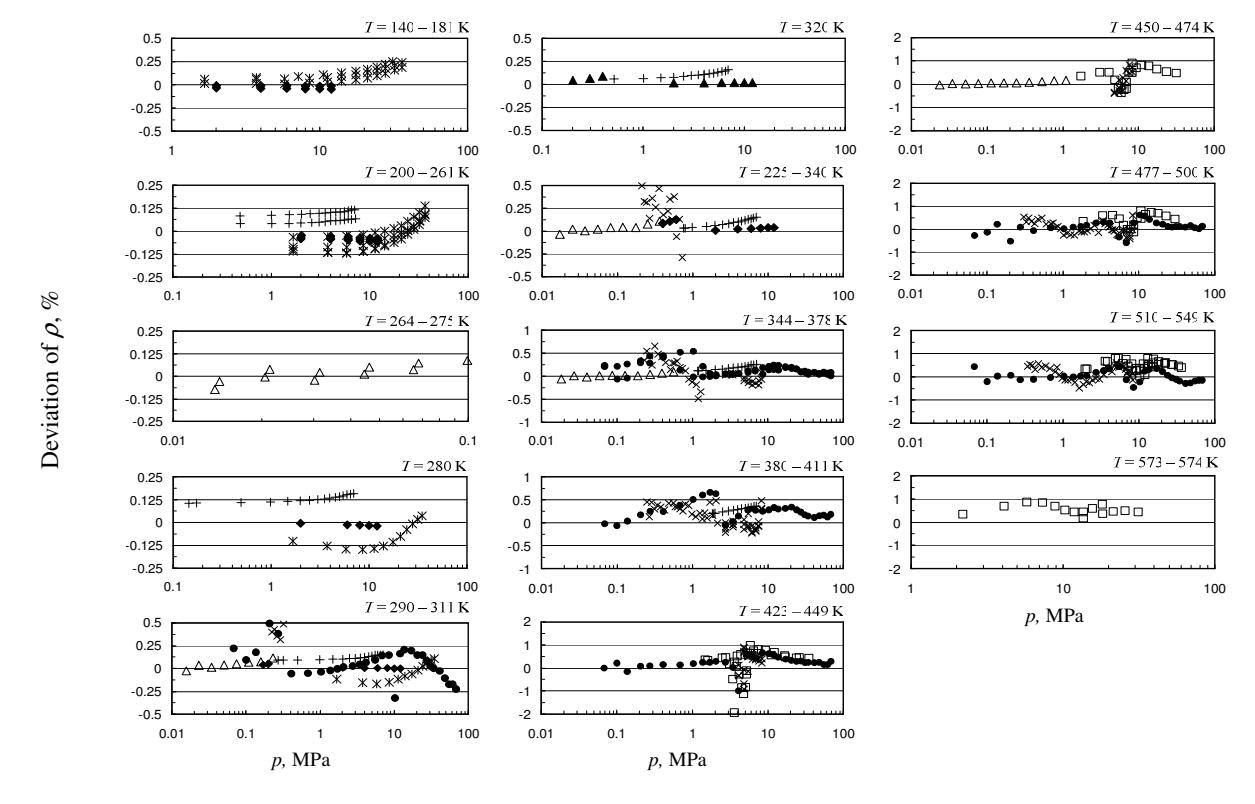
Figure 5. Deviation of single-phase density from the new fundamental equation of state. (+) Kayukawa et al. [8]; (\(\spadesuit\)) Glos et al. [7]; (\(\triangle\)) Gupta and Eubank [16]; (*) Haynes [11]; (\(\bullet\)) Olds et al. [14]; (\(\times\)) Kay [15]; (\(\square\)) Beattie et al. [17].
Pressure deviations of available experimental \(p\rho T\) property in gaseous phase from the present model are shown in Figure 6. \(p\rho T\) property measurements of Gupta and Eubank [16] are well reproduced within \(\pm 0.16\%\) in pressure. Data of Olds et al. [14] agree with new model within \(\pm 0.52\%\) while unused data of Kay [15] and Beattie et al. [17] are reproduced with largest deviation of -0.82%. Even the deviations are higher for data of Kay [15] and Beattie et al. [17], the average absolute deviation (AAD) with respect to each data set is less than 0.33%.
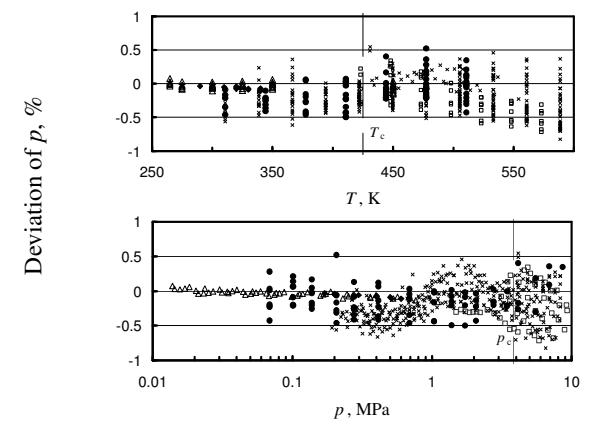
Figure 6. Deviation of pressure in the gaseous phase from the new fundamental equation of state. (\(\triangle\)) Gupta and Eubank [16]; (\(\spadesuit\)) Glos et al. [7]; (\(\bullet\)) Olds et al. [14]; (\(\times\)) Kay [15]; (\(\square\)) Beattie et al. [17].
The quality of new equation of state with respect to the available experimental caloric properties is revealed firstly by the comparison of speed of sound data with the calculated data from developed equation. As shown in Figure 7, the deviations of speed-of-sound data in gaseous phase of Ewing et al. [18] are systematically higher than the calculated values with maximum deviation of 0.08%. Bücker and Wagner [1] suggest a correction of the data to attain better consistency with their ideal-gas correlation and the corrected data are in very good agreement with their model. However, the reproduction of original data by Bücker and Wagner model is around 0.1% of maximum deviation. In liquid phase, larger deviations can be observed in Figure 8. The speed-of-sound data in liquid phase of Niepmann [19] are generally represented within ±1% except two data points that have slightly higher deviations. For this data group, the Bücker and Wagner model have better representation.
The isochoric specific heat \(c_v\) data in liquid phase of Magee and Lüddecke [20] are represented with the absolute average deviation, AAD of 0.45% while the saturated-liquid specific heat \(c_s\) data of these authors are reproduced within \(\pm 0.85\%\). The deviations of liquid isochoric specific heat and saturated-liquid specific heat are shown in Figure 9 and 10, respectively. The deviations of saturated-liquid specific heat derived from Bücker and Wagner [1] and Miyamoto and Watanabe [3]
models from the present model are also included in Figure 10.
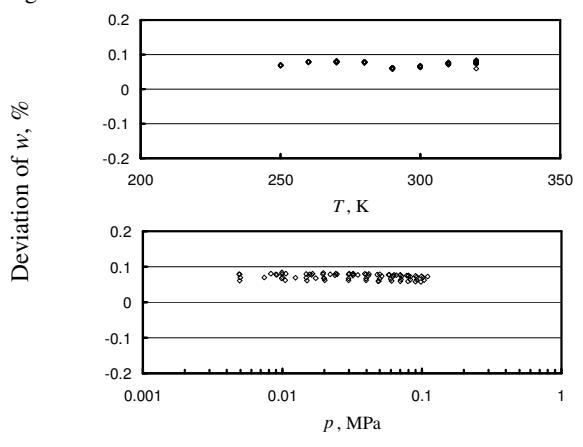
Figure 7. Deviation of speed-of-sound data in gaseous phase from the new fundamental equation of state. (⋄) Ewing et al.[18].
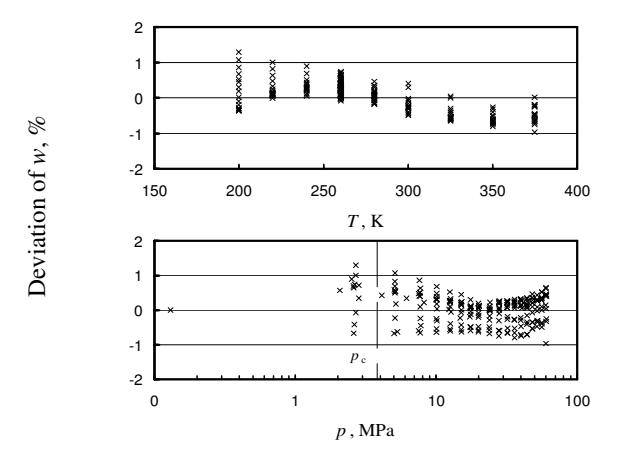
Figure 8. Deviation of speed-of-sound data in liquid phase from the new fundamental equation of state. \((\times)\) Niepmann [19].
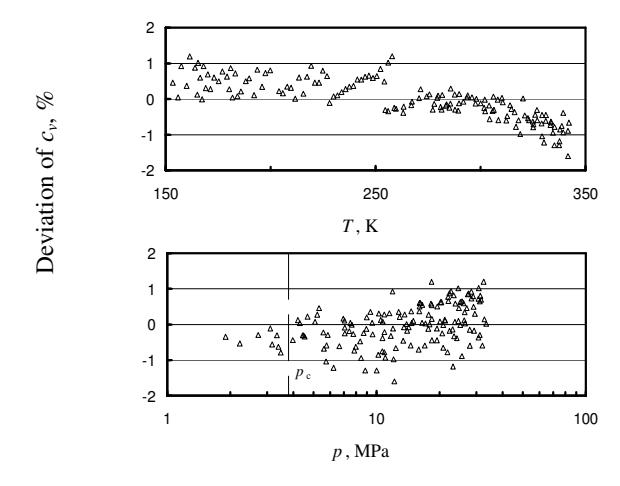
Figure 9. Deviation of isochoric specific heat in liquid phase from the new fundamental equation of state. (\(\triangle\)) Magee and Lüddecke [20].
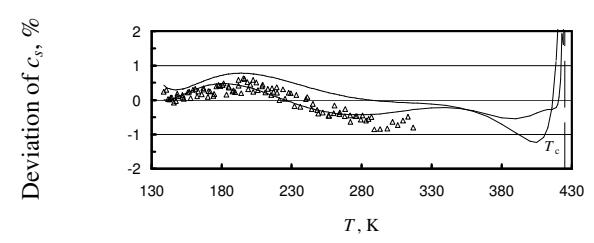
Figure 10. Deviation of saturated-liquid specific heat from the new fundamental equation of state. (\(\triangle\)) Magee and Lüddecke [20]; (——) Bücker and Wagner [1]; (——) Miyamoto and Watanabe [3].
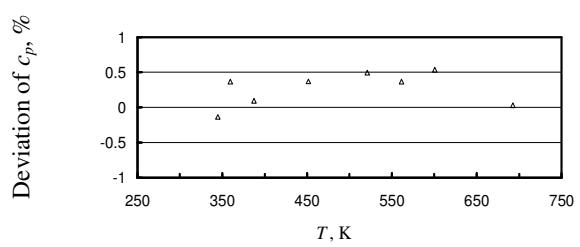
Figure 11. Deviation of isobaric specific heat from the new fundamental equation of state. (\(\triangle\)) Dailey and Felsing [21].
The assessment of caloric properties is closed with the comparison of isobaric specific heat data with the new equation of state as shown in Figure 11. Actually data were not used as input data in the model development as they are considered as unreliable. The isobaric specific heat data in gaseous phase of Dailey and Felsing [21], however, can be reproduced with deviations less \(\pm 0.6\%\). The data of Sage et al. [22] are not illustrated as the data have systematically large deviations up to \(\pm 9\%\).
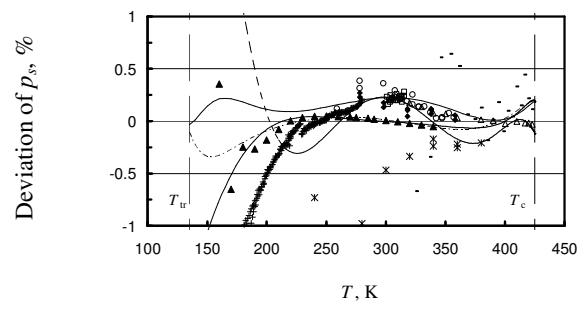
Figure 12. Deviation of vapor-pressure data from the new fundamental equation of state. (*) Kayukawa et al. [8]; (\(\blacktriangle\)) Glos et al. [7]; (\(\square\)) Sako et al. [28]; (+) Machin and Golding [29]; (\(\bigcirc\)) Holldorff and Knapp [26]; (\(\triangle\)) Kratzke et al. [23]; (\(\spadesuit\)) Flebbe et al. [27]; (-) Kay [15]; (-\(\square\)) Eq. (1); (—) Bücker and Wagner [1]; (--) Miyamoto and Watanabe [3]; (——) Younglove and Ely [4].
As the fundamental equation of state is also valid at saturation state, the assessment of \(p\rho T\) property at saturation is important to reveal its reliability. The assessment is carried out for vapor pressure, saturated-liquid and saturated-vapor densities. Figure 12 shows the deviations of vapor pressure measurements from the new
fundamental equation of state. The comparisons of present model with the ancillary equation for vapor pressure and with other thermodynamic models are also included in the figure. The new measurement data of Glos et al. [7] are well represented with deviation less than \(\pm 0.06\%\) for the range of 220 K to 340 K. Although larger deviations are shown for lower temperatures, the absolute deviations are reasonably small (< 3.6 Pa). This causes by very small vapor pressures at low temperatures especially near the triple point. At higher temperatures, the data of Kratzke et al. [23] are well represented by present model with \(\pm 0.06\%\) of deviation except two data points near critical point.
For the saturated-liquid density, deviations of measurement data from the present model for n-butane are illustrated in Figure 13. As shown in the figure, all the saturated-liquid densities data of Glos et al. [7] can be represented within \(\pm 0.04\%\). The data of Sliwinski [24] in higher temperatures are also reproduced within \(\pm 0.1\%\). The deviations of other data sets including calculated data from other considered thermodynamic property models for n-butane are also shown in Figure 13
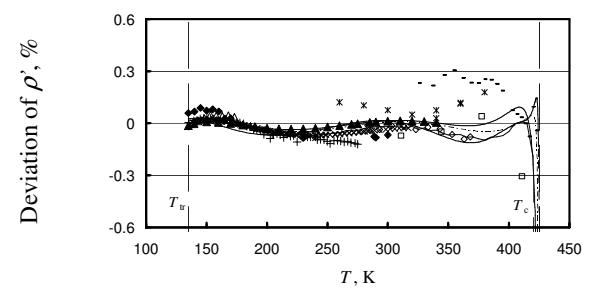
Figure 13. Deviation of saturated-liquid density data from the new fundamental equation of state. (★) Kayukawa et al. [8]; (▲) Glos et al. [7]; (\(\times\)) Magee and Lüddecke [20]; (+) Orrit and Laupretre [30]; (\(\bullet\)) Haynes and Hiza [32]; (\(\triangle\)) McClune [31]; (\(\diamond\)) Sliwinski [24]; (\(\square\)) Olds et al. [14]; (-) Kay [15]; (\(\square\) —) Eq. (2); (\(\square\)) Bücker and Wagner [1]; (\(\square\)) Miyamoto and Watanabe [3]; (\(\square\)) Younglove and Ely [4].
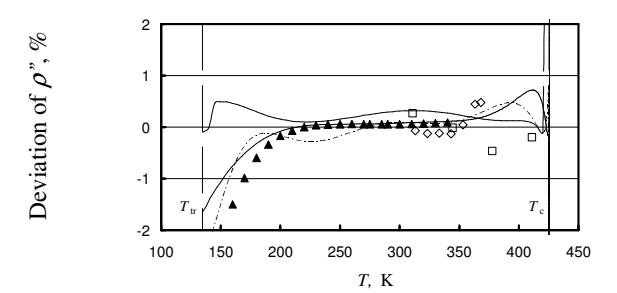
Figure 14. Deviation of saturated-vapor density data from the new fundamental equation of state. (\(\blacktriangle\)) Glos et al. [7]; (\(\Box\)) Olds et al. [14]; (\(\diamondsuit\)) Sliwinski [24]; (-) Eq. (2); (—) Bücker and Wagner [1]; (---) Miyamoto and Watanabe [3]; (——) Younglove and Ely [4].
Saturated-vapor density data for n-butane are scarce and no accurate measurements of the property are available at low temperatures. Therefore, the calculated data of Glos et al. [7] from virial equation of state were included in assessment of the property. Experimental data of Glos et al. which exist over the range of 270 K up to 340 K are in good agreement and deviation is less than 0.1%. The derived data at lower temperatures have larger deviations but the absolute deviations are small. For other data sets, data of Sliwinski [24] and of Olds et al. [14] can be represented within \(\pm 0.48\%\). Comparisons with other models for n-butane are also illustrated in Figure 14.
The consistency of the thermodynamic property model for n-butane with the intermolecular potential theory is investigated from the behaviors of the second and third virial coefficients derived from the model. Reasonable behavior of second virial coefficient derived from the current equation is shown in Figure 15. As seen in the figure, all considered equations of state show good agreement with respect to the property. Although, some literature data reported by Bücker and Wagner [1] were not used in the model development in this study, the comparisons reveal good agreement of present model with the data.
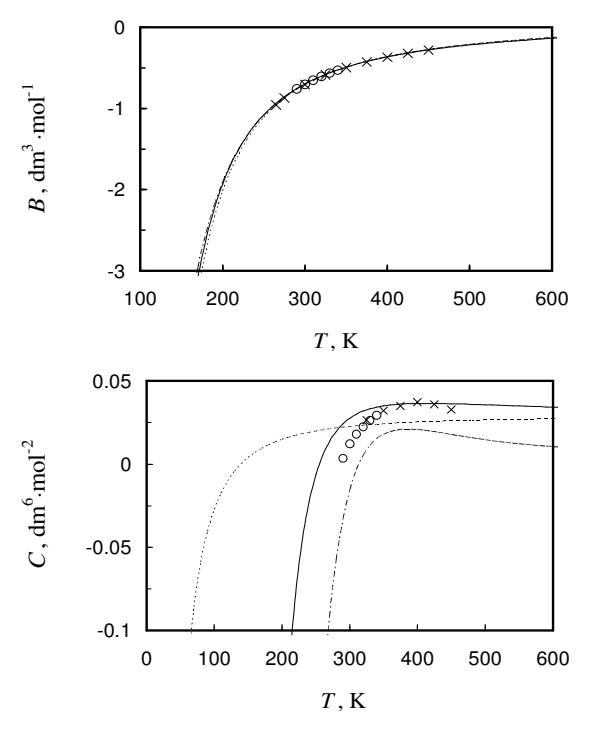
Figure 15. Behaviors of second and third virial coefficients derived from the present equation of state for n-butane and from other considered models. (\(\bigcirc\)) Glos et al. [7]; (\(\times\)) Gupta and Eubank [16]; (——) This work; (—'—) Bücker and Wagner [1]; (---) Miyamoto and Watanabe [3].
Unlike second virial coefficients, the third virial coefficients calculated from different considered models
show significant disagreement. As shown in the second diagram of Figure 15, the data of Glos et al. [7] are slightly lower than the calculated values of current equation of state for n-butane while the data of Gupta and Eubank [16] are reasonably reproduced by the equation. In accordance with the literature data, the new model for n-butane shows best behavior of the property.
7. EXTRAPOLATION BEHAVIOR
Since Helmholtz fundamental equation of state is empirically derived, its behaviors in critical region and in region where no experimental data are available should be carefully checked. Reliable extrapolation behavior of fundamental equation of state for n-butane can be revealed from smooth thermodynamic surfaces including isobaric lines of caloric properties and isothermal lines of \(p\rho T\) property. The extrapolation results are illustrated in Figure 16.
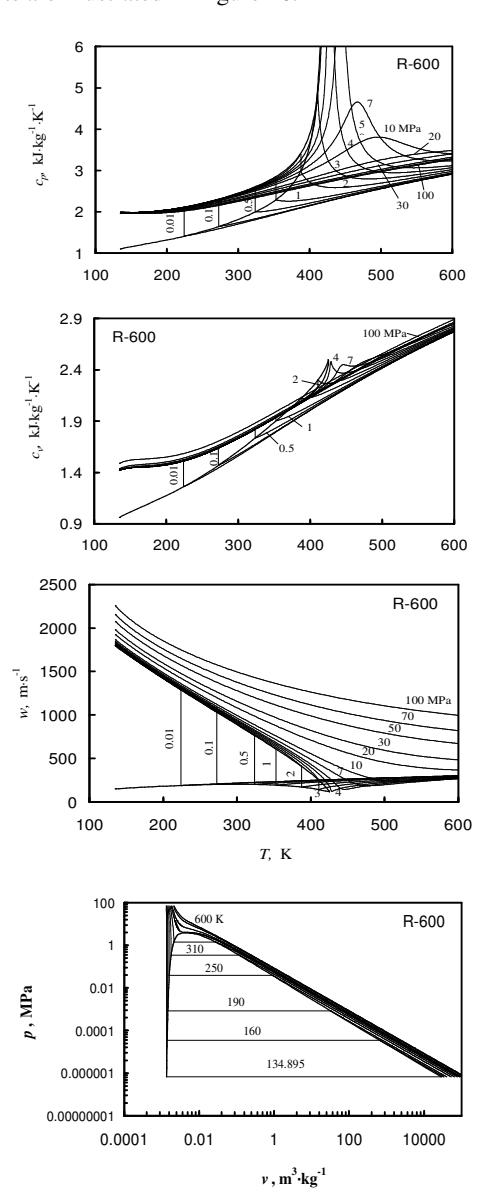
Figure 16. Caloric and PVT surfaces from the new fundamental equation of state for n-butane.
Another criterion for assessing the extrapolation behavior of the equation of state is the reasonable sharps of the so-called ideal curves derived from the equation itself.
From Figure 17, ideal curves generated from the present equation of state for n-butane behaves reasonably. The ideal curves derived from model of Bücker and Wagner [1] in comparison with those derived from Miyamoto and Watanabe [3] model can be found in literature of Bücker and Wagner model. Similar result found in this work, it is reported that the equations of state for nbutane from Miyamoto and Watanabe and from Younglove and Ely [4] can only provide three reasonable ideal curves. The two models faultily derive the Joule Inversion curve.
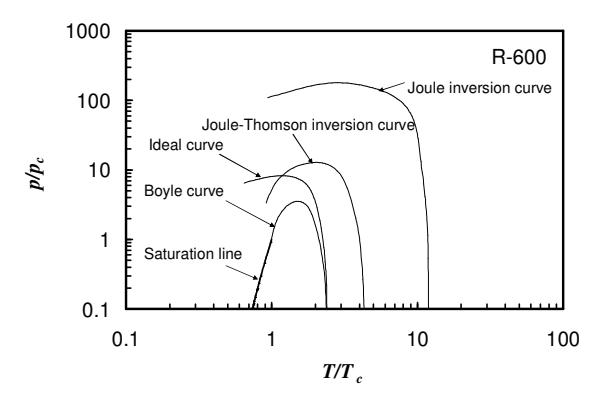
Figure 17. Ideal curves derived from the new fundamental equation of state for n-butane.
8. CONCLUSION
The new fundamental equation of state given in function of the dimensionless Helmholtz free energy was developed for light hydrocarbon, n-butane. The equation is relatively short compared to the existing equations of state for the fluid. As the model is rational to the theoretical background of the intermolecular potential, it can provide reliable thermodynamic properties over wide range even at low temperature and near saturation in the gaseous phase. The estimated uncertainties are 0.02% in ideal-gas isobaric specific heat, 0.2% in density, 0.15% in pressure for the gaseous phase, 1% in heat capacities, 0.05% in saturated-liquid density and 0.02% and 0.8% in speed of sound in the gaseous phase and liquid phase, respectively. The effective validity range of the equation of state is from triple point to 589 K and up to 69 MPa.
ACKNOWLEDGEMENT
The authors would like to thank to Osaka Gas Foundation of International Cultural Exchange and AUN/SEED-net program (ASEAN University Network/ Southeast Asia Engineering Education Development Network) for financial support on the research.
APPENDIX
Pressure-Enthalpy diagram generated from the present equation of state for n-butane is given in Figure A.
NOMENCLATURE
- B second virial coefficient
- c specific heat
- C third virial coefficient
- M molar mass
- p pressure
- R gas constant
- T temperature
- w speed of sound
- reduced Helmholtz free energy
- reduced density (/c)
- density
- inverse reduced temperature (Tc /T)
Subscripts
- c critical parameter
- p process at constant pressure
- s saturation
- t triple point
- v process at constant volume
Superscripts
"
- o ideal-gas part
- r residual part
- ' saturated-liquid state
- saturated-vapor state