

INTRODUCTION
Aerodynamics has been used in automotive industry as one way to reduce a car's drag so that fuel consumption could be reduced too. Two other ways are enhancing engine performance and reducing car's weight. But, in this study, we concentrate on aerodynamics way.
In this study, existing CFD software was used to evaluate a well-established hatchback car model called "Ahmed Body" shown in Figures 1 and 2. A hatchback car has a unique phenomenon called "drag crisis" which is illustrated in Figure 3. It could be seen in the Figure 3 that "drag crisis" phenomena is a unique changes of drag coefficient to the changes of rear window angle, \(\alpha\).
These results could be used in automotive design, especially in designing a hatchback car as follows: Rear
Window's angle of near 30° should be avoided in designing a hatchback car. An example of a hatchback car is shown in Figure 4.
In this undergraduate student level of research, some computational simulations were carried out to get the "drag crisis" phenomena as described above by using computational facility that we have at our laboratory. An effort to reduce drag at the critical angle was also effectively done by installation of spoilers and vortex generator at the rear window of "Ahmed Body". Some results including vortex structure near the rear window are also presented in this paper.
Figure 1 "Ahmed Body": A Well-established Model of a Hatchback Car (1)
Figure 2 Side View of "Ahmed Body" (1); α is rear window angle.
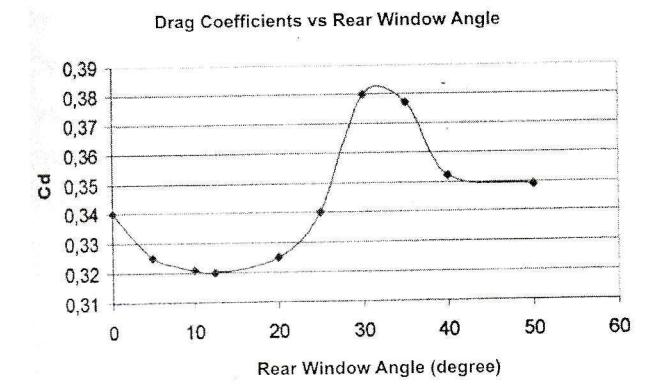
Figure 3 "Drag Crisis" Phenomena (2)
Figure 4 An example of Hatchback Car (3)
2 THEORY AND METHOD
In this study, flow is assumed as incompressible flow with equations as follow:
\[\frac{\partial u}{\partial t} + div(u\overline{u}) = -\frac{1}{\rho} \frac{\partial p}{\partial x} + v divgrad(u)\] \[\frac{\partial v}{\partial t} + div(v\overline{u}) = -\frac{1}{\rho} \frac{\partial p}{\partial y} + v divgrad(v)\] \[\frac{\partial w}{\partial t} + div(w\overline{u}) = -\frac{1}{\rho} \frac{\partial p}{\partial z} + v divgrad(w)\]
Method that was used in this work is applied CFD. Equation (1) is made in discrete form for CFD purposes by using Finite Volume scheme embedded in existing software. Existing software was used to do geometry drawing (AutoCAD or Gambit) and to conduct computational simulations (Gambit and Fluent). RANS (Reynold Average Navier Stokes) method was used by employing mostly K-E turbulence model and, for a little part of study, Spalart Almaras turbulence model. The amount of grid (meshing) is limited to 300.000, since we used Personal Computer to do the simulations. We used Reynolds number of 4.3 x 10⁶ with velocity inlet of 60 m/s. Air density is 1.225 kg/m<sup>3</sup>, viscosity is 1.7894 x 10<sup>-5</sup>, and pressure is 101325 Pa. Figure 5 shows three view drawing of "Ahmed Body" that was used in this research and it meets international standard. A standard procedure in doing computational simulations by using CFD were carried out including meshing, computation, and post processing.
Some terms from topology of separated flow is also used in this work to understand flow detail at near of the rear window of "Ahmed Body". Figure 6 to 9 shows illustrations of topology terms of three dimensional separations. More complete explanation about topology could be seen in reference [4].
Although we didn't conduct experimental investigation, a comparison with experimental investigation result was done and will be presented in section 3.
Figure 5 Three-View Drawing of internationaland addized of "Ahmed Body" measured in cm (2)
Figure 6 Some Topology Terms of Three Dimensional Separations (4)
Figure 7 Nodal Points: A Topology Term of Three Dimensional Separations (4)
Figure 8 Saddle Points: A Topology Term of Three Dimensional Separations (4)
Figure 9 Spiral Foci/Focus: A Topology Term of Three Dimensional Separation (4)
3 RESULTS AND ANALYSES
3.1 Grid Generation
Figure 10 shows a half of "Ahmed Body" after grid generation by using Gambit. By applying "symmetry boundary condition" to symmetry plane of "Ahmed Body", computation to the half body could represent full body with increasing efficiency of grid generation and computational effort. It could be seen in the Figure that many grid cells are concentrated near to rear window of the body because detailed investigation about vortex structure will be carried out to the flow that near to rear window.
3.2 Preliminary Investigation
Preliminary investigation was carried out to check whether computational simulation by using personal computer could capture "drag crisis" phenomena. Also, it is useful to choose which turbulence model will be employed in detailed investigation. Figure 11 and Figure 12 give results of the preliminary investigation.
Figure 10 A Half of "Ahmed Body" and Its Grid Cells
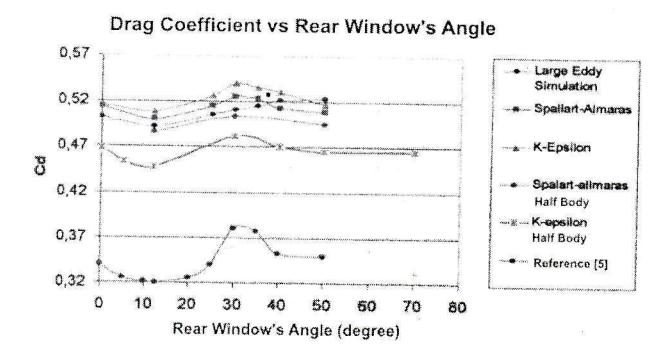
Figure 11 Results of Preliminary Examination of Some Computational Options
From Figure 11, it could be concluded that the plot of "K-epsilon Half Body" gives the best result compared to result from [5]. The trend of "drag crisis" is well-captured. Values of drag coefficients could not as good as from [5] since we did computational simulation by using personal computer which has limitation of the amount of grids used.
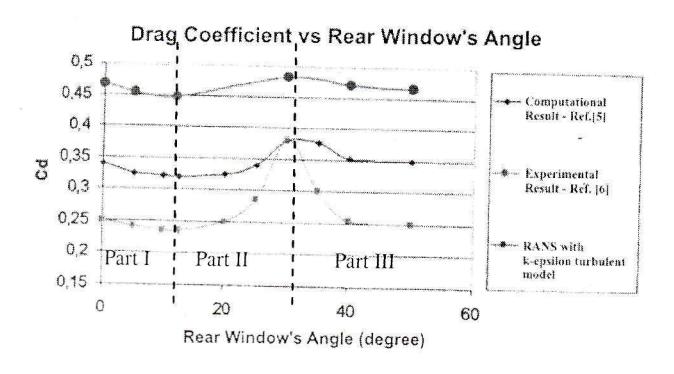
Figure 12 Further Comparison of Preliminary examination Results with Experimental Results
Further comparison with experimental result is shown in Figure 12. It could be seen that "drag crisis" phenomena from experimental result has little difference with computational result from 5 and from computational simulation by using "K-epsilon" turbulence model. The peak of curve of experimental result is higher than computational ones. However, all of the three curves have part I, part II, and part III in it. Trend shape of "drag crisis" could be well-captured.
From the results shown in figure 11 and figure 12, it is concluded that a further and detailed investigation could be carried out by using "K-epsilon" turbulence model and using half of Ahmed body as shown in figure 10.
3.3 Detail Investigation
Detailed investigation focused in examination of detailed flow structure at critical rear window's angle of 30 degree. It will be shown that the highest drag coefficient at the critical angle could be reduced by installing spoilers and a vortex generator.
In this detailed investigation, only rear part of "Ahmed Body" will be evaluated. The reason is there is no significant differences of detailed flow around front part of "Ahmed Body" as stated in [7].
Analysis of Flow at Rear Window Angle of 30° (The Critical Angle)
In this study, we want to know the reason of why drag coefficient at the critical angle becomes the largest in "drag crisis" phenomena. The value of drag coefficient for the critical angle is 0.48 as could be seen in figure 11 and 12.
Let's start by evaluating figure 13a which shows velocity vectors for the angle of 30°. There are two big vortices could be seen on the back of vertical wall of rear part. From figure 13a, we can get a preliminary understanding of why drag coefficient at the critical angle becomes the largest. The contributors are separation at rear window and two big vortices on the back of vertical wall of rear part of the body.
Figure 13b shows 2-D streamline for the critical angle. From this figure, additional information about "separation bulb", "saddle point", and "nodal point" appeared. This information gives a good contribution for our preliminary understanding from Figure 13a as mentioned before. See figure 6 to 9 for topology terms.
Figure 14a and 14b give more clear illustration about "saddle point". It is happened in this critical angle of 30°. The "saddle point" was also remarked in Figure 13b.
Figure 14a and 14b give three dimensional views of "separation bulb" as two-dimensionally shown in Figure 13a and 13b. Figure 14b gives more clear view about "saddle point" since output from Fluent was added by manual sketch to show "saddle point" three-dimensionally.
Figure 15a shows the "nodal point" as in Figure 13b, but in the form of three-dimensional. Basically, Figure 15a is a plot of wall streamline of rear part of "Ahmed Body". However, from the pattern of the wall streamline, as shown in Figure 15a, we can see a "nodal point", three dimensionally.
Figure 15b is a final confirmation that there is a separation bulb near the rear window (see blue part of pressure contour) and two vortices on the back of vertical wall of rear part of the body (see two separated blue parts of pressure contours). This "separation bulb" which make drag coefficient at the critical angle of 30° become the biggest in "drag crisis" phenomena. In the next chapter, we will see how to reduce this highest drag coefficient.
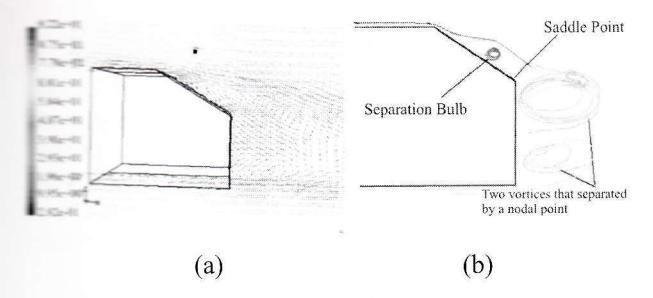
Figure 13 (a). Velocity vectors colored by Velocity Magnitudes (in m/s); (b). 2-D Streamline around Rear Window of "Ahmed Body"; (Rear Window Angle = 30°)
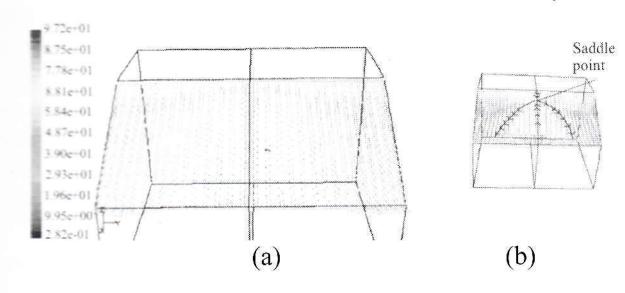
Figure 14 Velocity vectors colored by Velocity Magnitudes (in m/s);
(b) Sketch of Saddle Point at Rear Window Surface (Rear Window Angle = 30°)
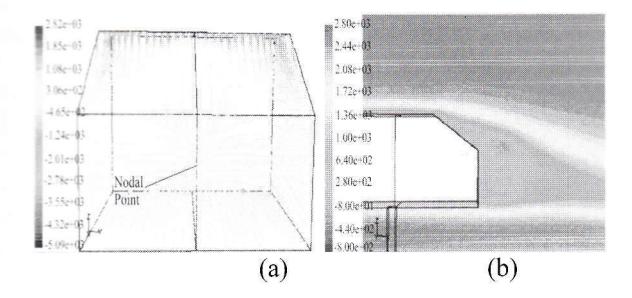
Figure 15 (a). Wall Streamline colored by Static Pressure in Pa
(b) Total Pressure Contour in Pa (at plane X-Z); (Rear Window Angle = 30°)
Reducing Drag Coefficient at the Critical Angle by Installing Spoilers
From discussion in the preceding chapter, it could be concluded that the most important thing in reducing drag coefficient of the critical angle of 30° is diminishing or reducing the "separation bulb" (as shown in figure 13 and 14). The appearance of "separation bulb" makes the flow has three-dimensional separated flow. This kind of flow contributes large to drag coefficient.
The basic idea in reducing the "separation bulb" is to push the flow to attach to rear window. We can do that by adding kinetic energy to the flow near the rear window. In order to add kinetic energy, we install spoilers and vortex generator at the rear window of the body (see figure 16). By pushing flow to enter spoiler's
hole, the flow will be accelerated so that kinetic energy is increased. Vortex generator as shown in figure 16 has an ellipse shape. This vortex generator also has a function to increase kinetic energy of the flow. With both devices, it is hope that the "separation bulb" will be reduced.
Figure 16 Spoiler and Vortex Generator are installed to Rear Window with Critical Angle of 30°
Boundary condition of CFD that was applied to spoilers and vortex generator is "wall". It means that there is no flow crossing them. And the result is: Drag coefficient calculated for the body using the two devices is reduced from 0.48(without it) to 0.45. It is a significant reduction for a drag coefficient.
Velocity contour of rear part of "Ahmad Body" with rear window angle of 30° and using spoiler and vortex generator could be seen in Figure 17. There is still a kind of separation happened at the rear window. However, the pattern is different from the same configuration without spoilers and vortex generators.
To know further about the pattern of separation at the rear window with spoilers and vortex generator, we compared the two configurations: 1. With spoilers and vortex generator; 2. without them. This wall-streamline-pattern comparison is shown in figure 18a and 18b. It could be seen that wall streamline for "Ahmed Body" with spoilers and vortex generator figure 18a is relatively two-dimensional. It is marked by pattern of wall streamline at rear window that nearly parallel with x-axis. If we look back to pattern of wall streamline for "Ahmed Body" without spoilers and vortex generator (redrawn as figure 18b), it is clear that at rear window there is a 3-D "separation bulb".
So, the effort to reduce drag coefficient of "Ahmed Body" at the critical angle of rear window by using spoilers and vortex generation was successful.
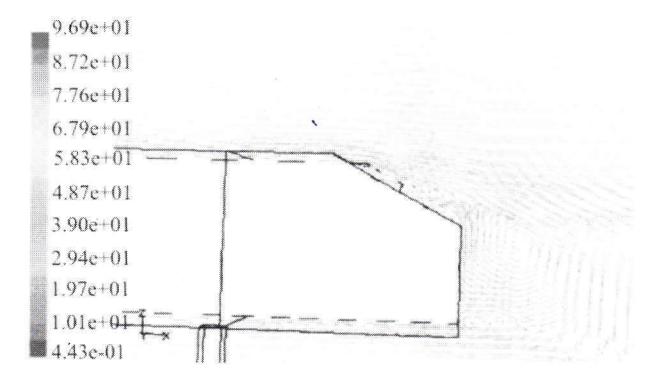
Figure 17 Velocity vectors colored by Velocity Magnitudes
(in m/s); (Rear Window Angle = 30°; with spoiler and vortex generators installed)
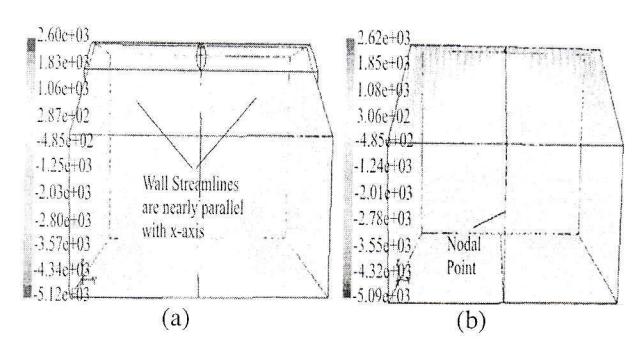
Figure 18 Wall Streamline with Spoilers and Vortex Generator; (b) Wall Streamline without them. (Both with Rear Window Angle = 30° (the critical angle))
4 CONCLUDING REMARKS
In this study, computational simulation of an international-standard hatchback car model called "Ahmed Body" was successfully done. By using Personal Computer, the calculation to capture "drag crisis" phenomena was able to get the trend of it. Drag coefficient values is different from frequently-cited of Reference (5) due to limitation of grid cells amount possible in this study. Detailed investigation of flow pattern gives a result that the appearance of 3-D "separation bulb" is a reason of why drag coefficient of the critical angle becomes the largest in "drag crisis" phenomena. An effort to reduce drag coefficient of the critical angle was succeed by installing spoilers and vortex generators at the rear window of the body.
5 SUGGESTION FOR FURTHER STUDY
More quantitative way to analyze vortices structure in the flow around "Ahmed Body" is highly suggested.
ACKNOWLEDGEMENT
The authors would like to appreciate Dr. Agus Wismakumara of Politeknik Bandung for permission of using license of GAMBIT and FLUENT that used in this research. Also, the authors would like to say thank you for Prof. Shinnosuke Obi of Keio University for facilitating to get some references about topology of 3-D flow while a short visit to his Laboratory