

I G.K. Adhi Yuliartha, Firman Hartono dan Djoko Sardjadi
Aeronautic and Astronautic Program Faculty of Mechanical and Aerospace Engineering Institut Teknologi Bandung
Ringkasan
Makalah ini menjelaskan tentang pembuatan sistem pengujian dan pengujian small turbojet engine "Olympus" produksi AMT Netherland. Variabel – variabel yang diukur dalam pengujian ini adalah temperatur gas keluar turbin, laju aliran bahan bakar dan udara, kecepatan putar kompresor, dan gaya dorong yang dihasilkan. Dalam pengujian ini, gaya dorong mesin diukur menggunakan load cell tipe bending beam yang telah dilengkapi empat buah strain gauge (dua buah strain gauge untuk masing - masing load cell) produksi Measurement Group, Inc dengan gauge factor 2,095 ± 0,5%. Laju aliran udara diukur menggunakan tabung pitot yang terpasang pada pipa masukan udara dengan panjang 400 mm dan diameter 107 mm. Sensor pengukuran gaya dorong dan kecepatan udara masuk kompresor ini dihubungkan dengan alat akuisisi data yang langsung terhubung dengan personal computer. Temperatur gas keluar turbin diukur menggunakan thermocouple dan putaran kompresor diukur dengan tachometer yang keduanya dihubungkan dengan alat akuisisi data dan dengan display digital (engine data terminal). Debit bahan bakar diukur menggunakan timbangan digital dengan resolusi 1 gram dan sebuah pengukur waktu. Pengurangan massa bahan bakar dalam satu selang waktu dicatat secara manual untuk mendapatkan debit bahan bakar mesin. Pengukuran dilakukan pada rentang putaran 37000 RPM sampai dengan 105500 RPM dengan kenaikan interval setiap 10000 RPM. Hasil pengukuran kemudian dikoreksi untuk mendapatkan hasil pada kondisi standar. Kesesuaian hasil yang didapatkan dengan data literatur menunjukkan bahwa sistem pengujian yang dibuat bekerja dengan baik.
Keyword: small turbojet, gas turbine, "Olympus".
1 INTRODUCTION
Gas turbine engine firstly patent by John Barber in 1871 [1], however the technology at that time is not enough yet to produce propulsion system based on gas turbine. After a long and complicated research, Sir Frank Whittle from England succeed to develop an aircraft propulsion system based on gas turbine and patent his engine in 1930 [1]. In the same time, Hans von Ohain from Germany also develops turbojet engine propulsion system. His engine was installed on HE-178 aircraft [1] that was the first turbojet engine aircraft in the world.
In the first process a turbojet engine cycle, a large amount of atmospheric air is continuously brought into the engine diffuser or intake. After the diffuser, the air passes through the compressor and the combustion chamber. The hot exhaust gases leaving the combustion chamber pass through the turbine. Turbine work is used to operate the compressor through a linking shaft and accessories. The gases leaving the turbine expanded through the nozzle hence accelerated the air velocity. The exhaust velocity is much greater than the free stream velocity, hence a thrust force is created. For turbojet propulsion engines that produce high power, the power to weight ratio (or thrust to weight ratio) is higher than piston engine. For this purpose, the large modern aircraft and high speed aircraft using the propulsion system based on gas turbine.
In 1980, aero-modeling hobbies start to try developing the small scale of the turbojet engine [2]. The component of this small turbojet engine was similar with large turbojet engine. Finally in 1996, Kurt Schreckling patented his small turbojet engine design with 110 mm diameter [3]. This success in development and production of small turbojet engine is followed by the arising of the small turbojet engine manufacture industry for high speed aero-modeling aircraft and unmanned aerial vehicle (UAV). One of this manufacturer is AMT Jet Netherland that designs and manufactures small turbojet engine "Olympus HP" with 230 N maximum thrust.
The Olympus engine has been constructed from a single radial compressor, an axial turbine, and an annular type combustion chamber, which is provided with a low pressure fuel system. From this same fuel system both hybrid bearings are also lubricated. A separate oil supply for lubrication is therefore no longer necessary. "Olympus" turbojet engine has already completed with electric motor starter to start the engine. Specification of the "Olympus" turbojet engine is shown in Table 1 [4]. The schematic drawing of "Olympus" turbojet engine is shown in figure 1.
The purpose of this project is to design and develop air mass flow and thrust measurement system, also to measure the parameters that are used to determine the performance of "Olympus" turbojet. The variables
measured and the measurement devices in this experiment are:
- 1. Thrust, measured using load cell;
- 2. Air mass flow, measured using Pitot tube installed on air inlet flow pipe;
- 3. Fuel flow, measured using digital weight and stopwatch;
- 4. Engine RPM and exit gas temperature, measured using tachometer and thermocouple and connected to electronic control unit (ECU).
Figure 1 Turbojet engine "Olympus" scheme
Table 1 Turbojet engine "Olympus" specification
| Parameter | Value | Unit |
|---|---|---|
| Maximum diameter | 131 | mm |
| Length | 384 | mm |
| Turbine Weight | 2850 | g |
| System weight (Engine, ECU, pump, battery, thermo sensor, mounting straps) | 3795 | g |
| Thrust (at maximum RPM) | 230 | N |
| Thrust (at minimum RPM) | 13 | N |
| Maximum RPM | 108500 | - |
| Idle RPM | 36000 | - |
| Compressor pressure ratio (at maximum RPM) | 3,8 : 1 | - |
| Air mass flow ( at maximum RPM) | 450 | g/s |
| Exhaust Gas Normal Temperature | 700 | °C |
| Exhaust Gas maximum Temperature | 750 | °C |
| Fuel consumption (at maximum RPM) | 640 | g/min |
The similar experiment also conducted by John Ebaid from Cranfield University [8], but using the early version of Olympus that produce 182.6 N thrust. The other small turbojet engine experiment, such as turbojet MW-52, is provided in reference [9].
2 INSTRUMENTATION AND TESTING
2.1 Experiment Instrumentation
2.1.1 Load Cell
Load cell is used to measure turbojet engine's thrust. Load cell is a measurement system that arranged from load fixture element and strain gauge [7]. Load fixture element accepts the thrust from the turbojet and this thrust is sensed by the strain gauge in voltage change. Load cells convert the load acting on them into electrical signals. The gauges themselves are bonded onto a beam or structural member that deforms when thrust is applied. The beam deformation will cause the change in strain gauge electrical resistance, this changes are sensed by signal conditioner in the form of electrical voltage changes in strain gauge.
Load fixture element in this experiment was made of aluminum Al 2024 - T3. This type of aluminum has elastic limit of tension and compression \(\sigma_v = 275.6\)MPa, maximum limit of tension and compression \(\sigma_u\)= 310.05 MPa and the elasticity modulus E = 70 GPa. The dimension of the load fixture element is determined so that the maximum stress occurred in the location where the strain gauge mounted is high enough (in the range of strain gauge sensitivity) but still under maximum load that could be applied to the material. To estimate the maximum load and location of the maximum stress occurred on the load fixture element, computer numerical simulation was done using Msc Nastran 4.5 software. On the simulation, the load cell was modeled by 2 load fixture elements (similar to the real load cell condition). These two load fixture elements are connected each other with 2.85 kg weight aluminum plate (appropriate with engine weight). Thrust was modeled by 230 N axial force acting on the middle of the plate (the system's symmetric axis). From the results of the simulation, the maximum stress occurred is 17.44 MPa on the flange end. This stress is far under the material maximum stress and material elastic limit. Hence, the strain gauges mounted on the load fixture element flange end where the stress is maximum. Figure 2a and 2b shows the load fixture element design and the stress distribution simulation result
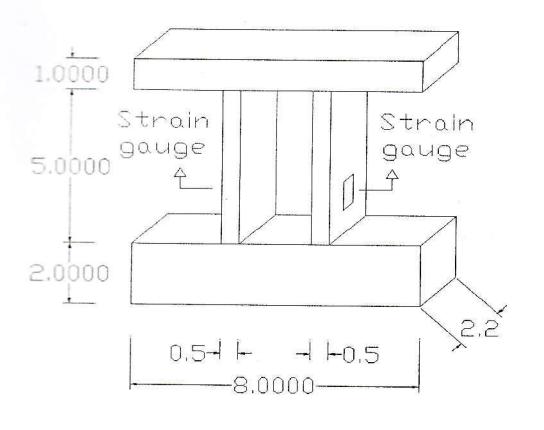
Figure 2a. Load cell (in mm unit)
Figure 2b Stress distribution simulation result
To find out the load cell's response characteristic to input force, calibration process was done. In the calibration, a known value and direction of input force was applied to the load fixture element (the force direction appropriate with the engine thrust direction) and the load cell's output voltage was recorded. The calibration simulates the load fixture element response due to the engine thrust. The interval step of the applied force is 49 N (5 Kg) with maximum force 245 N (25 Kg). Figure 3 shows load cell calibration result.
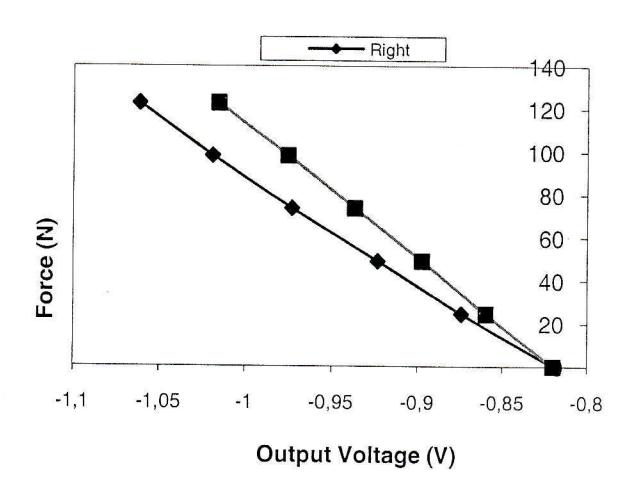
Figure 3 Load cell calibration curve
During calibration process and measurement, load cell output voltage was sensed by signal conditioner and then displayed digitally. The signal conditioner used in the calibration and experiment is Kyowa CDV-700 A completed with wheatstone bridge box, filter and DC amplifier with 10000 times amplifying gain (0.001 volt resolution).
2.12 Inlet pipe
The inlet pipe was installed in front of the engine inlet in order to measure air mass flow rate entering the compressor. This pipe was completed with Pitot tube that is used to measure the flow dynamic pressure.
Bernoulli equation [5] was applied to calculate the relation between the flow dynamic pressure and air flow velocity. Computer simulation was used to find out the relation between air flow velocities and air mass flow rate.
The simulation was done by using the Ansys ICEM and Ansys CFX software. The purpose of this simulation is to determine the relation between the flow velocity on the Pitot tube location and the air mass flow rate compressor inlet. The Pitot tube location was defined, so that the existence of the Pitot tube does not disturb the flow field uniformity. From the simulation, the curve that shows the relation between the flow velocity on the Pitot tube location and the air mass flow rate at compressor inlet was created. Hence, the air flow measurement can be done on one location only to get the total air mass flow rate. The relation between the flow velocity on the Pitot tube location and the air mass flow rate at compressor inlet is shown in Figure 4. In the data analysis process, this curve was corrected to atmospheric air pressure, temperature, and humidity during the experiment and then normalized to the standard condition.
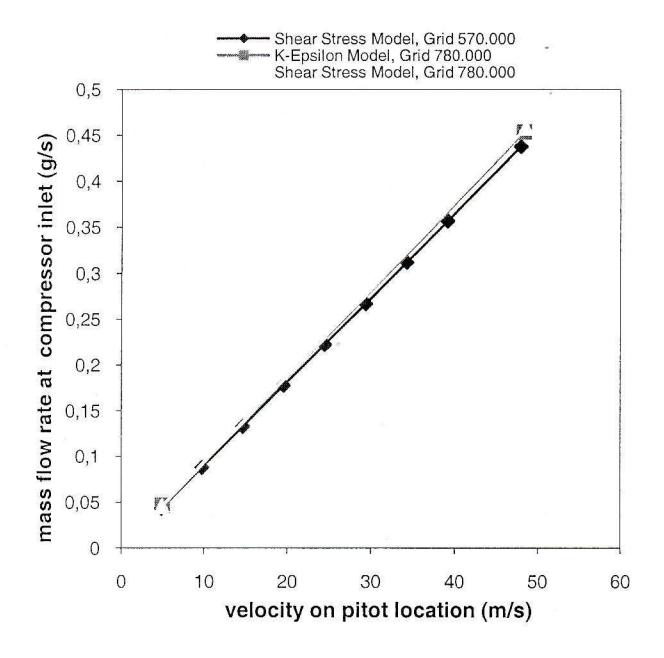
Figure 4 Velocity in pitot tube location versus inlet compressor air mass flow (numerical result)
A 107 mm PVC pipe was installed at the compressor inlet. The pipe was carefully mounted so that its axis is parallel with the engine axis. Figure 5 shows the testing system scheme.
Figure 5 Experiment scheme
2.1.3 Digital weight, tachometer and thermocouple
The other instruments used, beside load cell to measure the engine thrust and inlet pipe to measure air mass flow, are digital weight and stopwatch to measure fuel flow, tachometer to measure the engine revolution, and thermocouple to measure turbine exit temperature. The resolution of the digital weight and the tachometer are 1 g and 1 RPM respectively. To measure the turbine exit gas temperature, 1 Kelvin resolution thermocouple was used. Engine revolution measurement instrument (tachometer) and turbine exit temperature measurement instrument (thermocouple) are integrated in engine electric control system. Engine revolution and turbine exit temperature was displayed digitally on engine data terminal display.
2.2 Testing
Testing was divided into two steps:
1. Pre-testing
On this step, sensor and measurement system was installed. The experiment location was cleaned from small debris that could suck in to the engine. The engine facing the compressor inlet pipe and engine exhaust faced to the exit room. To guarantee the level of safety, a fire extinguisher was prepared. Before the engine is started, all sensors and measurement systems are checked to make sure that all work properly. Figure 6 shows the engine that ready to test.
Figure 6 Complete testing system
2. Testing
before the testing. This record is important to standard condition. The pressure, temperature, and humidity were:
93826.95 Pa 299.15 K 299.15 K 73 % the experiment were taken from an up stroke stroke of the fuel throttle with ±10000 RPM The lowest RPM was about 37000, while RPM was about 105500. The engine was let every RPM step for about 15 seconds at every RPM step for about 15 seconds every the throttle levels during each such that the levels in the up stroke of one as the levels in the down stroke of the the same group, but practically it was do that because the difficulty to control the
3 RESULT AND ANALYSIS
pressure, temperature and humidity during hence the data should be normalize to temperature standard condition. Equation (1) – (4) used the experiment data [8]:
\[= \frac{m_a \cdot 101325 \cdot \sqrt{T_{amb}}}{P_{amb} \cdot \sqrt{288}}\]
(I)
\[T_{numerical} = \frac{T \cdot 101325}{P_{amb}}\]
(2)
\[RPM_{normalized} = \frac{rpm \cdot \sqrt{288}}{\sqrt{T_{amh}}}\]
3)
\[\mathbf{m}_{f} = \frac{m_{f} \cdot 101325 \cdot \sqrt{288}}{P_{amh} \cdot \sqrt{T_{amh}}}\]
(4)
There are \(ma_{norm}\) vs RPM, \(mf_{norm}\) vs RPM, \(T_{norm}\) vs RPM, and EGT vs RPM curves. Curve of figure 7 is completed with measurement result from reference [8]. The "Olympus" turbojet that was tested in reference [8] is the earlier version of "Olympus" with 190 N maximum thrust. Figure 8, 9, and 10 show experiment result curves compared to reference data [4].
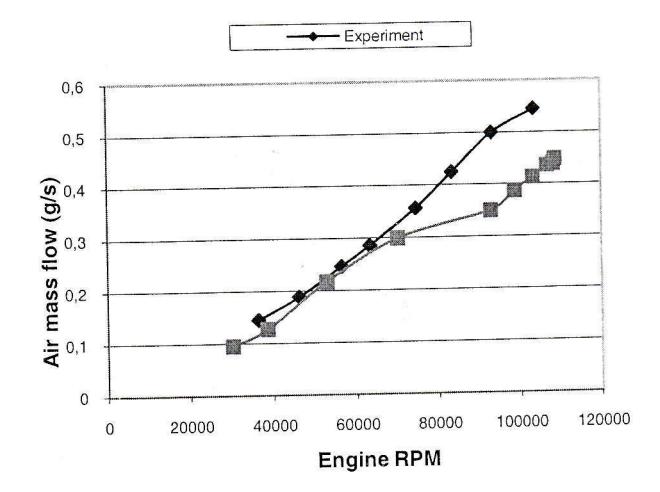
Figure 7 Air mass flow as a function of engine revolution
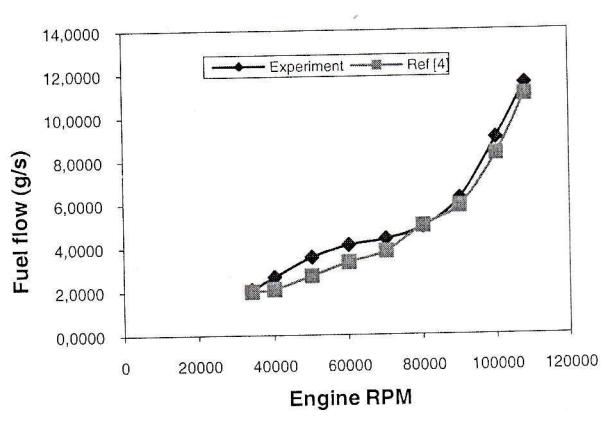
Figure 8 Fuel flow as a function of engine revolution
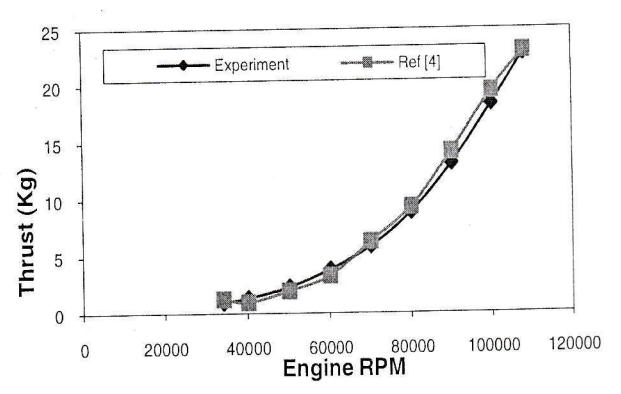
Figure 9 Thrust as a function of engine revolution
EGT vs Engine RPM
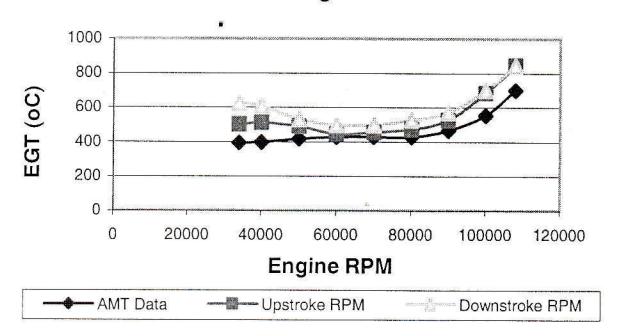
Figure 10 Exhaust gas temperature as a function of engine revolution
From figures above, several conclusions can be taken:
- 1. From the air mass flow vs engine RPM (figure 7), the inlet compressor air flow has the similar trend with reference [8], however as the engine RPM increasing, the difference between experiments result and the reference data becoming larger. This difference exists because of the engine type used in reference [8] is the early version of "Olympus" turbojet engine with lower thrust produce.
- 2. From fuel flow vs engine RPM curve (figure 8), the highest difference between the current experimental data and reference [4], about 0.85 g/s, is appear on 50000 engine RPM. This difference probably due to the incomplete combustion in combustion chamber when the engine runs at low revolution. It causes the flame lengthen through the turbine wheel and nozzle that reduce the fuel energy conversion efficiency. Hence, more fuel were needed for the same engine revolution.
- 3. Thrust vs engine RPM curve (Figure 9) shows similar experiment result with data of reference [4]. This result means the measurement system and the measurement process in this experiment was valid.
- 4. From EGT vs engine RPM curve (figure 10), it is seen that the highest difference appear when the corrected engine revolution is about 34000 RPM or in the idle condition. As mentioned above, on low engine revolution, the incomplete combustion causes high EGT. This caused a difference EGT result of the engine at up stroke and down stroke as figure 10 shows. The EGT data when the engine RPM run up stroke is lower than that when the engine RPM run down stroke.
4 CONCLUSION
The engine management systems has been designed and constructed to be robust so that the consistency of every
engine run is kept at the top, producing highly efficient engine runs. Load cell and inlet compressor pipe were functioned. Good agreement between the experiment result and data from reference [4] and [8] shows that the testing system works as expected. The air mass flow difference between experiments result and the reference on low engine revolution appear because of the engine type used in reference [8] is the early version of "Olympus" turbojet engine with lower thrust produced. EGT vs engine RPM shows that there was a hysteresis problem during experiment, which is seems to be caused by poor air - fuel mixing and incomplete combustion during combustion process when the engine runs at low revolution. However, the system developed has runs and functioned well to measure the engine performance during the static test. To further increase the measurement accuracy and engine performance installation, more efficient devices are needed. Obtaining high accuracy sensors such as pressure transducers and load cell will provide better data for analysis. The real flight condition testing system should be developed to find out the engine performance during real flight condition.