

1 Introduction
This Ducted fan designed with configuration of coaxial rotor, in order to minimize the effect of contra moment of rotating propeller. This configuration needed to attach each rotor on vertical axis with some variable position. Fortunately, we have computational Fluid Dynamics Methods, with the results could predict the performance at each position.
Figure 1 3D design coaxial ducted fan with 2 independence control surface
Figure 2 Coaxial ducted fan model on testing and measurement with test bed load cell
2 CFD Analysis
Recently, computational fluid dynamics methods had been popular as the most Fluid analysis problem solver. At this analysis we used one of popular commercial CFD software that's Fluent and Gambit. Every CFD software have minimum 2 basic capability: Mesher and Solver[10] . To visualized this process we have described below (Figure 3):
Figure 3 CFD Analysis flow chart visualization[10]
With this CFD analysis, we could predict some flow characteristics on this Ducted fan model (Figure 4, Figure 5, and Figure 6).
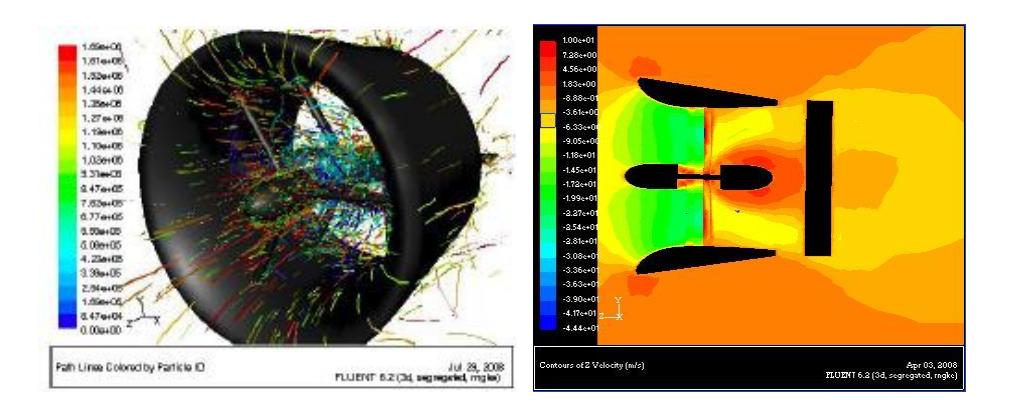
Figure 4 Path line fluid around coaxial ducted fan
Figure 5 Velocity contour around coaxial ducted fan
The main goal of this analysis is to find force and moment that's induced by the configurations of each speed rotor, distance between rotor and angle of attack all control surface fin.
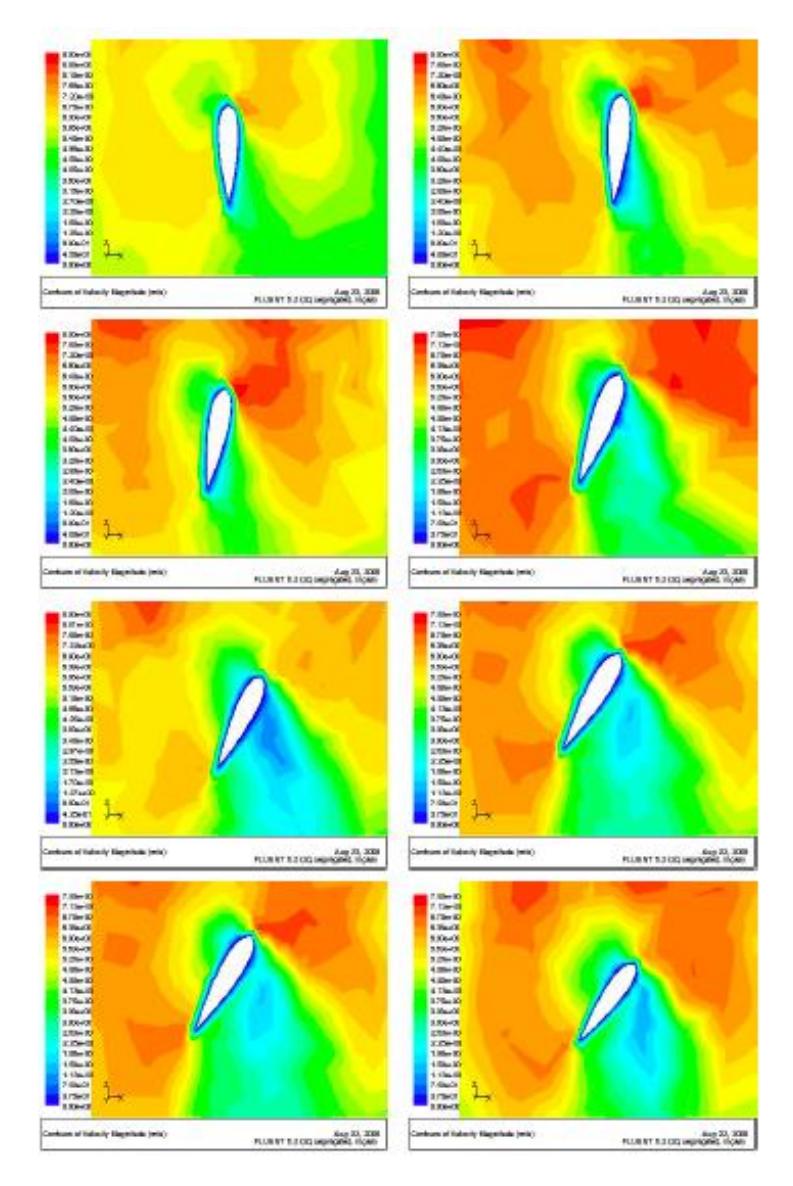
Figure 6 Velocity contour around control surface
3 Setup and Testing
This testing setup had designed dedicated for miniature VTOL UAV (Figure 7 and Figure 8). With this construction, we could measure almost 6 degrees of freedom forces and moment.
Figure 7 Testing procedures schematic
Figure 8 Coordinate system, forces, moment and control surface angle
All measurement results have compared with data from simulation at the same condition. The distance between rotor and yaw moment is the most priority of this observation. Almost user that's used coaxial concepts rotor does not have more attention about distance between rotor[3]. Besides that, with some position of control surface that had controlled with microcontroller, we've could detect roll and pitch moment on ducted fan body. This testing equipment had built by 8 load cell module with configuration like this (Figure 9). Each load cell module devices, had arranged with full bridges configuration (Figure 10).
Figure 9 Load cell modules configuration
Figure 10 Load cell module
This paper just focused on Thrust and Yaw characteristics with variable on distance between rotors. With intensive simulation and testing, we've got several data by Table 1 and Figure 11.
| Table 1 Thrust at variable throttle and Distance between propeller |
|---|
| No. | Propeller Position | Fin Angle | % Throttle | % Throttle | Thrust (Newton) | |
|---|---|---|---|---|---|---|
| (mm) | (derajat) | Top Rotor | Bottom Rotor | simulation | Testing | |
| 1 | 10 | 0 | 25 | 25 | 5.7201942 | 4.203036767 |
| 50 | 50 | 11.409878 | 8.404380704 | |||
| 75 | 75 | 17.081886 | 12.08425003 | |||
| 100 | 100 | 21.374309 | 14.91610196 | |||
| 2 | 20 | 0 | 25 | 25 | 5.6791814 | 4.228621704 |
| 50 | 50 | 11.418209 | 8.429691744 | |||
| 75 | 75 | 17.02447 | 12.23923041 | |||
| 100 | 100 | 21.389192 | 14.94543315 | |||
| 3 | 30 | 0 | 25 | 25 | 5.7415302 | 4.307335063 |
| 50 | 50 | 11.532345 | 8.609757212 | |||
| 75 | 75 | 17.196911 | 12.41383041 | |||
| 100 | 100 | 21.598318 | 15.29141437 | |||
| - 4 | 40 | 0 | 25 | 25 | 5.7502145 | 4.518860294 |
| 50 | 50 | 11.562501 | 8.84677665 | |||
| 75 | 75 | 17.242125 | 12.56156739 | |||
| 100 | 100 | 21.655431 | 15.6722097 | |||
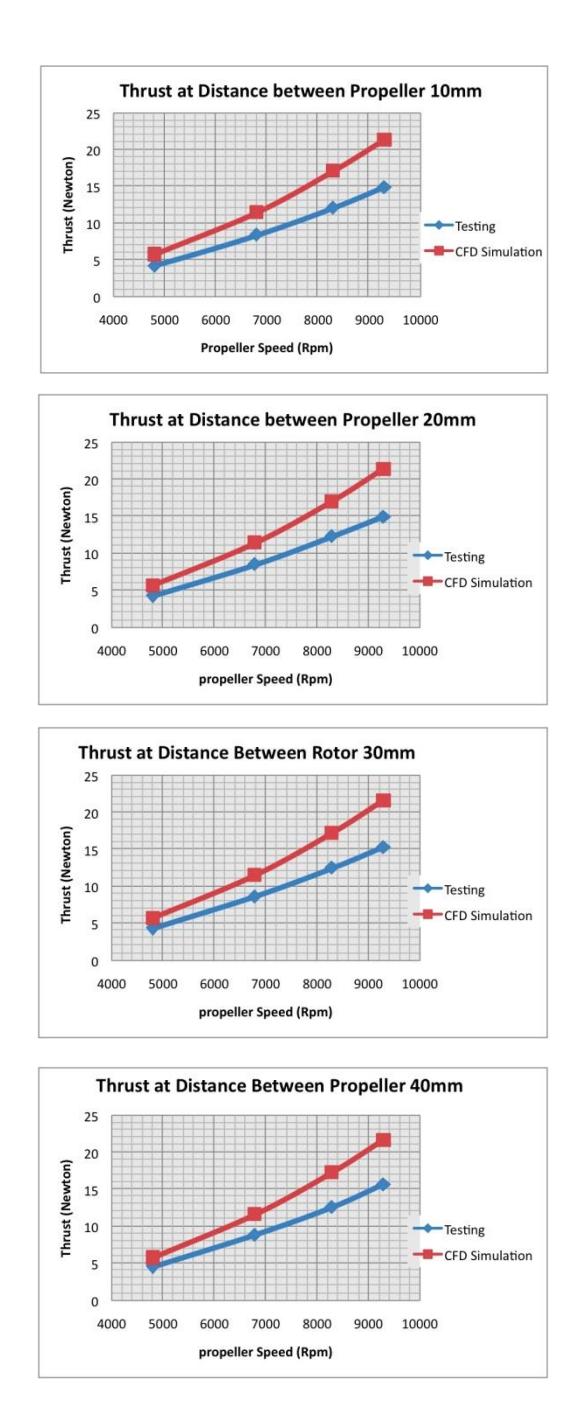
Figure 11 Graphical results characteristics at each distance between propeller rotor's
With information from table and graphics, the biggest thrust results at distance 40 mm at almost full range of variable throttle. The results from testing and CFD simulation show similar trend.
On Yaw moment simulation and testings below, with constraint just one rotor with variable on speed and another one just fixed at maximum throttle (Table 2 and Figure 12).
| П | prop | ||||||
|---|---|---|---|---|---|---|---|
| No. | dist. | angle | % throttle | % throttle | Yaw (N.m) | ||
| ı | (mm) | (derajat) | Тор | Bottom | simulation | Testing | |
| 1 | 10 | 0 | 100 | 25 | -0.113898 | -0.07486 | |
| T | 100 | 50 | -0.040256 | -0.001098 | |||
| T | 100 | 75 | 0.031909 | 0.0863166 | |||
| T | 100 | 100 | 0.088366 | 0.1685103 | |||
| 2 | 20 | 0 | 100 | 25 | -0.112585 | -0.073756 | |
| T | 100 | 50 | -0.038906 | -0.015654 | |||
| T | 100 | 75 | 0.033155 | 0.0673336 | |||
| T | 100 | 100 | 0.089447 | 0.1328235 | |||
| 3 | 30 | 0 | 100 | 25 | -0.11571 | -0.065168 | |
| T | 100 | 50 | -0.042531 | -0.011863 | |||
| T | 100 | 75 | 0.029737 | 0.0549812 | |||
| T | 100 | 100 | 0.086045 | 0.1093661 | |||
| 4 | 40 | 0 | 100 | 25 | -0.116595 | -0.061393 | |
| T | 100 | 50 | -0.043395 | -0.014703 | |||
| T | 100 | 75 | 0.028991 | 0.0508299 | |||
| T | 100 | 100 | 0.085411 | 0.0971808 | |||
Table 2 Yaw moment at variable throttle and Distance between propeller
With information from table and graphics, the lowest yaw moment results was at distance 40 mm at almost full range of bottom rotor throttle. The results from testing and CFD simulation show similar trend.
4 Ducted Fan Concepts
From some experience and track records, ducted fan was very suitable for system that's needs a bigger thrust at low speed[8] . If compared with open propeller with the same power propulsion and diameter propeller, ducted fan system donate more thrust. Another advantages of this ducted fan system is the higher safety, especially if operated at high rpm propeller speed. That why at recently year, this system have applied on many Small Scale Unmanned Aerial Vehicle[1],[2],[4] .
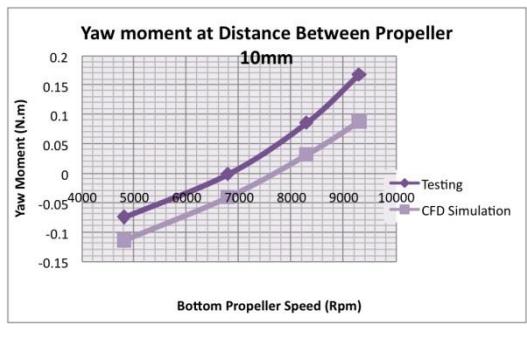
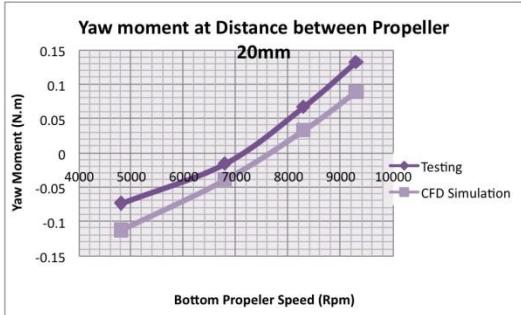
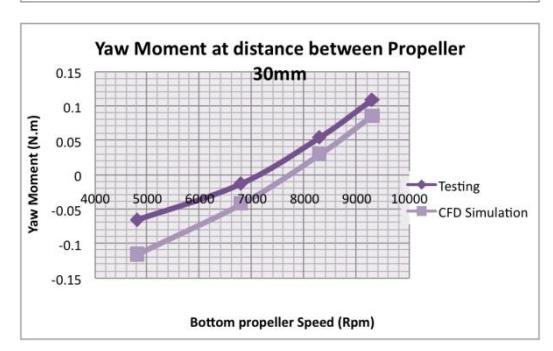
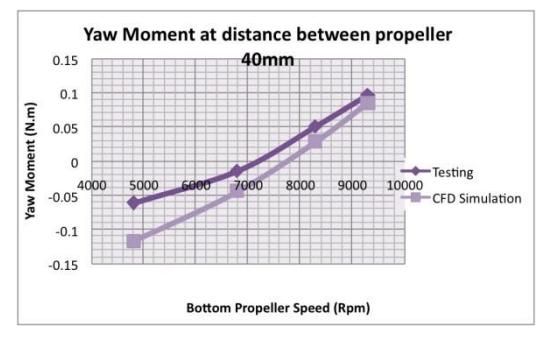
Figure 12 Graphical results characteristics on yaw moment at each distance between propeller
On moving condition (Cruising flight), we can devide flow through the open propeller into 3 main region (Figure 13): (1) The Inflow into the Propeller, (2) The Slip Stream behind it and (3) The Free Stream which doesn't go to the propeller. But before a plane can cruise it has to take off, and its take off performance depends on the performance of the propeller at low speed and at rest[7] .
Figure 13 Diagram of open propeller on static and cruising condition[7]
With the propeller immersed in a static air mass, the picture we saw earlier changes radically (Figure 13). Now there are two regions. The propeller is familiar, but there is no free stream anymore; everything that isn't slipstream is in the inflow region. This means that the propeller is aspirating air from behind it as well as from in front. Consider now the flight of an intrepid air particle starting just outside the slipstream, behind the propeller. It has to go forward to the propeller disk, make a 180-degree turn, accelerate instantly and enter the slipstream. As real air particles have mass and therefore inertia, and as open propellers have to be lightly loaded at the tips, the result is that a region of reversed flow exists near the propeller tip. This diminishes the effective disk area of the propeller and restricts the amount of air able to flow through it, just when the highest mass flow is needed. Now take the same propeller and surround it with a close-fitting shroud having a nicely rounded leading edge, and see how the picture changes (Figure 14).
We still have only two flow regions, but now there is a solid boundary between them in the neighborhood of the propeller: the shroud or duct and our air particle has a much easier time doing what is expected of it, because it need only flow around a duct lip or leading edge of finite radius. We can even provide the duct lip with a slot to help keep flow attached.
Figure 14 Diagram of ducted propeller on static and Cruising condition[7]
The duct also shields the propeller from the harsh realities of the outside world, and the propeller "sees" air flowing in only one direction: front to rear. In fact, from the propeller's point of view it is not at rest at all, merely cruising at some fraction of its maximum speed. What is more, the endplate effect of the duct wall allows the propeller to carry a non-zero load right out to the tip. The effects of all of this are that:
- Fewer design compromises are required; the ducted propeller operates nearer its ideal operating point throughout the aircraft's speed range.
- The effective diameter of the ducted propeller is larger than its physical diameter. To understand why, look at the diagram of the open propeller at cruise and note that the slipstream contracts behind the propeller. Now look at the ducted propeller and note that the slipstream diameter is that of the duct exit. That larger diameter represents a smaller Diameter vans and a larger mass flow and by now we know that means higher thrust/
horsepower.
While the propeller develops about the same thrust as before, there is now a second force acting on the duct. If the duct is shaped correctly, this force is additional thrust.
At cruise, the advantages are less pronounced and limitations more obvious, but we can still note that the effective area of the propulsor is approximately that of the duct inlet, which may be considerably larger than the swept area of the propeller itself. We can note here a subsidiary advantage of the ducted propulsor, namely that it offers the possibility of thrust vectoring and even thrust reversal[7] .
5 Conclusion
Base on this experiment data, we can make some conclusion about correlation distance between rotor and yaw moment on coaxial rotor ducted fan design. Increasing on distance between rotors, it will increase overall thrust, but decreasing on yaw moment.
Computational Fluid Dynamics methods that's we've used had proved good results, with similar trends and Maximum error between simulation and testing just around 30 %. This error was most favorable for preliminary CFD Analysis[10] .
For the next analysis, we will try with another duct standard contour, and increased with resolution of computation modeling on CFD Software.
6 References
- [1] Muljowidodo and Budiyono, A., Design and Development of Micro Aerial Vehicle at ITB, International Conference on Technology Fusion, Seoul, Korea, 17-19 May 2006
- [2] Muljowidodo K, Development of VTOL-UAV", AUN/SEED-Net 7th . FieldWise Seminar on Manufacturing & Material Processing Technology, Kualalumpur, Malaysia, March, 2006
- [3] Swinson, J. et. al., Horizontal and vertical take-off and landing unmanned aerial vehicle, United States Patent No. 5890441
- [4] Budiyono, A. et. al., C.ontroller Design of a VTOL Aircraft: A Case Study of Coefficient Diagram Method Application to a Time-varying System, Regional Conference on Aeronautical Science, Technology and Industry, Bandung, Indonesia, 18-19 May 2004
- [5] Olfati-Saber, R., Global Configuration Stabilization for the VTOL Aircraft with Strong Input Coupling, Proc. of the 39th Conf. on Decision and Control, Sydney, Australia, Dec. 2000
- [6] Altug, E. et al., Control of Quadrotor Helicopter Using Visual Feedback, ICRA, Taipei, September 2003
- [7] F. Marc de Piolenc dan George E. Wright, Jr. , Ducted Fan Design Volume 1, City of Industry, California, USA, 2002
- [8] A.I. Abrego dan R.W. Bulaga, Performance Study of a Ducted Fan System, NASA Ames Research Center Moffett Field, presented on The American Helicopter Society Aerodynamics, Acoustics, and Test and EvaluationTechnical Specialists Meeting, San Francisco, CA, 23-25 Januari 2002
- [9] Kuiper, J., The Wageningen Propeller Series, MARIN Publication 92-001, 1992
- [10] Fluent Incorporated, Fluent 5 and Gambit User Guide, Lebanon, 1998
Paper Status
This paper was presented on "International Seminar on Intelligent Unmanned Systems 2008 (ISIUS 2008)", Nanjing, People Republic of China, and has been reviewed to fulfill the standard of Jurnal Teknik Mesin.