

1 Introduction
Turning processes are widely use in the industries to produce cylindrical shape parts by using a single point cutting tool. Based on life cycle assessment from CECIMO Self-regulatory Initiative 2009 [1] using milling and turning machines as the representative, it shows that the utilization phase of the machine is the dominating influence for all environmental impacts. The end of life and machine production phases only contribute about 10% of all environmental impacts. Meanwhile, during the utilization phase, the electrical energy
consumption is the dominating influence (about 99%) for all environmental impacts. In this case, assessing the energy performance of turning machine becomes an important issue that is related to the environmental impacts. A methodology for assessing energy performance of turning processes had been developed on the prior research [2]. The experimental verification is needed to be conducted to make sure the validity of methodology. This paper presents an experimental verification of a methodology for assessing the energy performance on turning process. Initially, a metering strategy must be determined for all the cutting processes based on literature reviews. The data of energy consumption from several manual lathe machines has been collected through several experiments to construct the reference values. The key of the methodology is comparing the reference values to the specific energy consumption from the assessed process [2].
2 Literature Review
Specific energy consumption (SEC) is a ratio between the total energy consumption and a certain physical indicator (mass or volume). For turning processes, specific energy consumption is calculated by dividing the total energy consumption by material removal rate to determine the total energy required to cut 1 mm3 of material. Kara and Li [3] proposed an empirical specific energy consumption model for calculating energy consumption under various cutting conditions. Energy consumption data were collected through experiment to build the model. An initial curve estimation indicated that an inverse model provides the best fitness about the relationship between specific energy consumption and material removal rate, as shown in Eq.1 [3].
\[SEC = C_0 + \frac{C_1}{MRR} \tag{1}\]
SEC is the specific energy consumption in J/mm3 , C0 and C1 are machine tool specific coefficients. The coefficient C1 is not equal to the fixed power (P0) as the fixed power depends on the process condition. The SEC reflects the total energy consumption of a unit process [3].
The literature review of specific energy consumption models showed that the energy demand of machining processes depended on the cutting parameters and the characteristics of the machine (idle power). Increasing the material removal rate will be significantly reducing the SEC.
3 Experimental Verification
The experimental verification for turning process was conducted according to the assessment methodology. The experimental verification consisted of several steps, such as determination of metering strategy, power measurement, data analysis, and the process assessment. The workflow of the experimental verification is shown in Fig.1
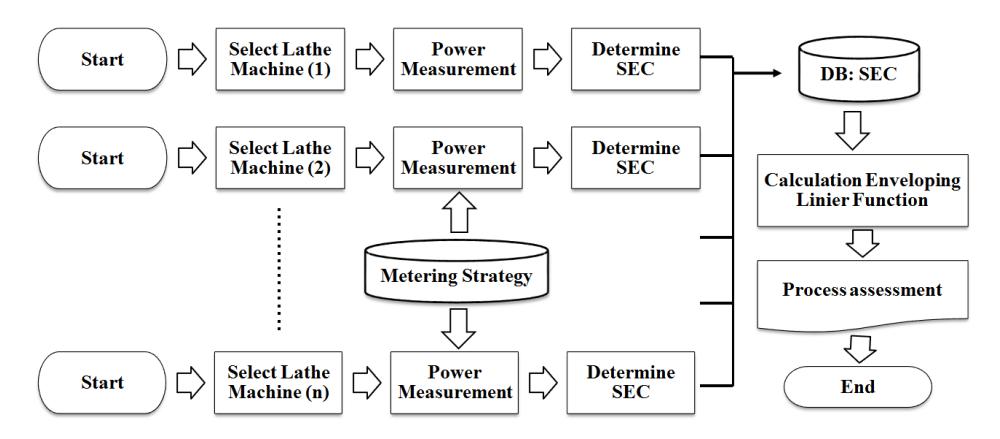
Figure 1 The Workflow of Experimental Verification
4 Determination of Metering Strategy
The metering strategy needs to be determined based on the literature review and the recommendation from tool supplier. The metering strategy is including the determination of the type of materials, type and geometry of cutting tool, cutting speeds and cutting condition. For the machine capacity, several medium duty lathe machines were chosen for the process assessment since they were commonly used by many industries in Indonesia. Several medium duty lathe machines were used for the experiment, such as Gallic 16 N, Axelson, Weiler 500 R, Harrison M300 Grazioli Fortuna 150, Schaublin 150, Axelson, and Grazioli Dania 245. The steel JIS S45C cylindrical bars were used as the work piece materials with the diameter of 60 mm. The coated carbide insert were selected according to the recommendation from tool catalog.
The material removal rate (MRR) can be calculated according to the cutting speeds. The significant changes of specific energy consumption occur when the MRR is increasing from less than 1 cm3/s until more than 1 cm3/s [3]. This range can be used as the reference to determine the cutting speeds. The cutting speeds were chosen based on literature reviews [4,5] and need to be adjusted with the recommendation from the tool catalog. The depth of cut and feed rate were hold at a constant level to simplify the process assessment. The cutting speeds were varied according to the spindle speeds of the machine. Based on to the tool catalog, the feed red and depth of cut was set to 0,1 mm/rev and 2 mm respectively.
5 Experimental Setup for Turning Process
Several trials of cutting process were conducted previously to make sure the metering strategy was appropriate for the process assessment. The total power demand of machine tool was measured during the cutting process. The metering point should reflect the total energy demand of machine tool. In this case, machine tool with all inherent components is defined as a closed system. The total power consumption of the machine during cutting process was recorded using power measuring device three phase power analyzer Lutron DW-6093. It can record the data of true power, power factor, voltage and the current of each phase simultaneously into the SD card using data logger functions. Three phases by four wires measurements (3Φ4W) was used for this experiment. The experimental setup for Grazioli Dania 245 is shown in Figure 2.
Figure 2 Experimental Setup for Grazioli Dania 245
6 Data Analysis
The data from seven manual lathe machine were collected through experiments, and then converted into specific energy consumption according to the rate of material removal. The data of specific energy for each lathe machine were plotted at the same graph as shown at Fig 3. In the next step, the data set was analyzed using MaxDEA Basic 6.6 program to determine the reference values. Initially, the data should be prepared in MS Excel format and then imported to the MaxDEA program. Several parameters must be chosen according to the proposed methodology for running the envelopment model. The parameters that used for the analysis were radial measure of efficiency for the distance option, output-oriented for orientation option and variable return scale for the return to scale option. The efficiency scores were calculated by the program with the range between 0 and 1. The point that have the efficiency score equal to 1 is used to construct the reference value, as shown at Fig 3.
The reference values will be used in the process assessment. According to the distance of the actual specific energy consumption and the reference value, the energy reduction score can be calculated [2]. The score describes the amount of energy that needed to be reduce, in order to achieve the efficient condition. The nearer the distance of SEC to the reference values is the better the energy performance of the machine. Each of the machine that had been used for the experiment was assessed base on this methodology. The assessment for Gallic 16N machine was illustrated in the Fig.4.
Each data of SEC from the machine will be assessed to determine the energy reduction score. The average value of all the reduction scores from the machine represent the energy performance of the machine. The result of assessment for all the seven lathe machine is shown in the Table 1. The SEC limit can be calculated by take the average from all the average of reduction scores. If the machine have the average of reduction scores less then (or equal to) the SEC limit, it can be assumed that the machine has a good energy performance relatively.
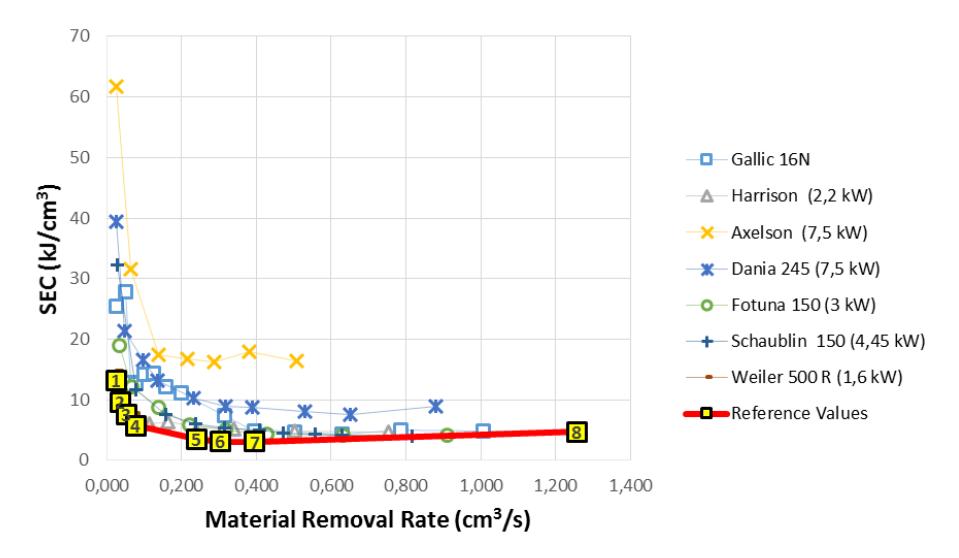
Figure 3 Reference Values for Medium Duty Lathe Machines (1,1-11 kW)
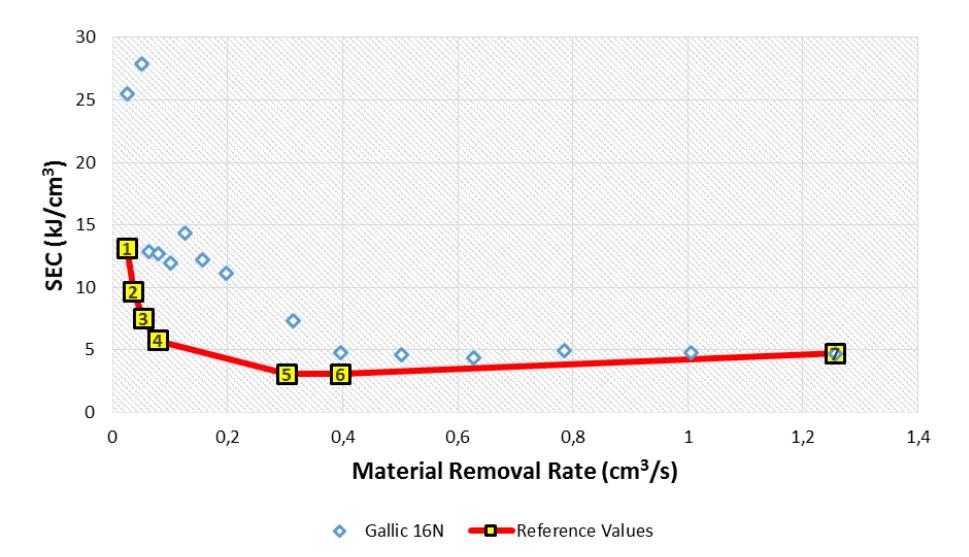
Figure 4 Assessment for Gallic 16N Machine
Table 1 Average of Reduction Score from Seven Lathe Machines
| No. | Machine (1,1-11 kW) | Average of Reduction score (%) |
|---|---|---|
| 1. | Gallic 16N (7,5 kW) | 42,10 |
| 2. | Harrison M300 (2,2 kW) | 16,16 |
| 3. | Axelson (7,5 kW) | 78,10 |
| 4. | Schaublin 150 (4,45 kW) | 33,59 |
| 5. | Grazioli Fortuna 150 (3 kW) | 31,16 |
| 6. | Weiler 500 R (1,6 kW) | 5,08 |
| 7. | Grazioli Dania 245 (7,5 kW) | 61,17 |
| SEC Limit | 38,19 | |
7 Discussion and Conclusion
The result of data analysis showed that the reference values was mostly constructed based on the data from the Weiler (1,6 kW) and Harrison (2,2 kW) machine. In general, the lower of the motor power of the machine and the lower of the idle power (air cutting power) is the lower of the curve of SEC for the machine. However, machine with low motor power would have the limited range of MRR (for the same cutting load) than the machine with the higher motor power. It can be concluded that the wide range of motor power for the medium duty lathe machine (1,1-11 kW) would reduce the quality of the process assessment. In order to maintain the quality of process assessment, it is suggested to construct the reference values using the data from the machines that have the same motor power.
More data of specific energy consumption is still needed to increase the validity of reference values. From the current reference values (1,1-11 kW), Axelson machine (7,5 kW) have the highest average of reduction score and the Weiler machine have the lowest average of reduction score. Five of the seven machines has the average reduction scores below the current SEC limit. The result of data analysis show that the methodology can be used to assess the energy performance of lathe machine, but the amount of the data is still limited and need to be improved.