

1 Introduction
Material improvement of wear resistance steel for ore mining has been carried out through various studies. Research related to material wear-resistant components for mining in general has been taken, including the use of wide range steel and cast iron [1-3].
Research on the mining material development of both mining component of steel and cast iron are still needed to be developed, mainly to ensure service operation by increasing the lifetime of exploitation component. Research are being developed to studying relation among mechanical properties, such as hardness and impact strength as well as the operating parameters encountering wear rate. Development of component materials carried out for specific implementation. Recently, material research has to consider the environment parameter to serve suitable property. Parameter related to mining component life time which promptly between impact and hardness should be collected in initial phase. Data collected describe the landsite profile and being some input data in material development. Developing wear measurement technique is an exertion providing data in initial phase.[4]
In previous study, observed worn mining component shows a uniform polishing wear track. Figure 1 indicates where mining component material removal is caused by action of repetitive compressive loading of hard material, such as rock or hard abrasives. The uniformity of volume loss is a delaminated process covering entire wear surface. This delamination process has small scar or narrow tip. Further elaboration to determine level uniformity volume loss with narrow tip scar in 3D scan imaging technology.
In metrology, precision refers to measurement dispersion. The measurement error (the mean) can be close to zero even if the system is not very precise (but it needs a good trueness). In other words, the less scattered the measurement data, the more precise the equipment. A formal definition of precision is: closeness of agreement between indications or measured quantity values obtained by replicate measurements on the same or similar objects under specified conditions. [6]
Figure 1 Worn surface: Scar and polishing wear[5]
The word trueness rather gives information on the difference between the mean of measurements and the real dimension regardless dispersion. In other words, the closest the mean of measurements is to the nominal value, the more trueness the equipment has. A formal definition of trueness is: closeness of agreement
between the average of an infinite number of replicate measured quantity values and reference quantity value. [7]
In the present study, meshing level was made considering to elaborate 3D model generation. Smooth meshing level were taken generally to provide accurate model. It should be elaborate in wear measurement application whether this particular factor.
Scar and wear track in mining component were captured in 3D scan imaging and analyzed its correlation percentage of its volume loss. The study would be as a reference to develop a device to measure volume loss due to wear base on 3D optical scan imaging. There is limited number of investigation and studies have been conducted in wear measurement using 3D scan imaging. This study is a preliminary study to seek correlation between meshing factor and actual volume.
Study in wear measurement recently shows between laboratory work and in situ measurement had obvious variance. Main handicap in laboratory work is limitation of its representation about real situation. In situ measurement should be carry out considering validity, uncomplicated and cost respectively. Implementing 3D scan technology in wear rate measurement would be spotless considering parameter correlation of wear test ASTM G105 (Figure 2). This study focusing on correlation worn object after several hour having wear test and its 3D scan model.
Study focusing a comparison of wear rate volume generated scanned data and wear rate volume regarding wear testing. Volume of scanned data taking into consideration alignment tools and merging tools in 3D CAD model work. The comparison will be based on the scanning and reconstruction of 7 specimens with variety of different percentage volume loss. The quality of the reconstructed 3D models is evaluated using Geomagic. Both of volumes related by statistical analysis.
Figure 2 Schematic diagram abrasion tester ASTM G105 [10]
1.1 Experimental Procedure
Specimen were prepared in various percentage of volume loss through wear test. Volume specimen were measured prior and after wear test over buoyancy test measurement. Specimen were scanned to provide surface file. Surface file was exported into two type STL files named normal meshing and smooth meshing. Both type STL file were converted to 3D CAD model to provide its volume. All three volume provided to examine difference between the mean of measurements and the real dimension regardless dispersion. The present study aims to associate the correlation between the volume of various worn mining component in scanning process and its actual weight after wear test. Response volume was employed throughout the experimental data to build connection between both volume measurement. The experiment was accomplished according to statistical analysis using variance analysis and box plot analysis. Statistical analysis evaluate in Minitab17.
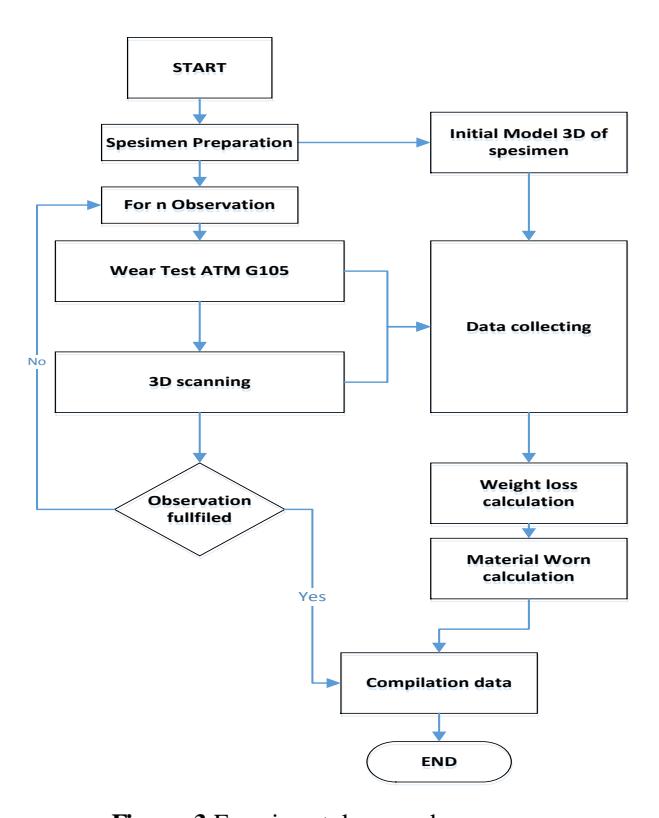
Figure 3 Experimental procedure
1.2 Specimen Preparation
Specimen were being prepared for abrasion wear test. Specimen coupons were prepared in 70×50×12 mm using wire cut machine to ensure the size uniformity. See Figure 4 Each coupon would be three replication for wear test and 3D scan modelling process respectively. Considering dimension error, specimen were cut into about 35×50×12 mm prior wear test and scanning. Coupon were abraded in ASTM G105 wear test machine up to 7 level different percentage volume of loss. Each sequence of test applied standard wear test procedure. Standard specimen preparation including cleaning, weighing before and after wear test. Volume before and after wear test were measured in buoyance volume measurement. Volume loss percentage which is studied were 0.2%, 0.4%, 1.3%, 1.6%, 3.8%, 5.4%, and 6.2%. Specimen were designated according to its volume loss percentage (T0.2, T0.4, and so on).
Figure 4 Specimen coupon as experimental object
2 Experimental Set Up
2.1 3D Scan Set Up
The scanning workflow starts with an object to scan and ends with a final surface model [8]. Scanning process consists of 4 main processes. First step in scanning is scanner calibration process. Calibration values such as focus, resolution and accuracy set to default setting. Specimen were prepared for scanning by taking a grid label point and sprayed with white powder. Acquisition were acted to get point clouds. Point cloud exported into 3D CAD model meshing. See Figure 5.

Figure 5 Representation of scanning workflow
Worn material after wear test being modelled using 3D scan GOM ATOS, see Figure 6. Experiment took scanning parameter as default refer to GOM ATOS user manual. Scanning set parameter were shutter time 12µs, area of work (distance) equal to height of specimen and accuracy 30 µm. 3D CAD model were analyze its mass property to provide 3D CAD volume, see Figure 7.
Figure 6 Experimental setup (left) 3D scan GOM ATOS (right) ASTM G65/ G105
Figure 7 Mass property analysis per Creo
2.2 Wear Test Apparatus Set Up
Wear test conducted using apparatus ASTM G65/G105. Wear test apparatus could undergo both ASTM standard G65/G105. Specimen prepared in coupon dimension 70×50×20 mm. Experiment apply a force of 222 N (50 lb.) between the test specimen positioned in the specimen holder and the wheel. The abrasive
slurry used in the test consist of a mixture of 0.940 kg of deionized water and 1.500 kg of a rounded grain quartz sand as typified by AFS 50/70 Test Sand (−50/ +70 mesh, or −230/ +270 µm). The wheel is driven by a 0.75-kw (1-hp) electric motor and gear box to ensure that full torque is delivered during the test. The rate of revolution producing (245 ± 5 rpm) constantly under load.
3 Result and Discussion
Figure 8 and Figure 9 shows 3D CAD model volume of worn specimen after scanned. Figure (a) to (g) refer to smallest to largest percent volume loss specimen examined. Since two types of mesh level applied, Figure 8 shows volume generated in normal mesh and Figure 9 volume in smooth mesh respectively.
Figure 8 Volume generated in Normal meshing
Figure 9 Volume generated in Smooth meshing
There are two main results regarding wear rate measurement comparing both technique which are center of mean value and dissimilarity. Center of mean were measured among three graph distribution. Precision and accuracy among volume measured determine by difference between the mean of measurements and the real dimension regardless dispersion. Volume provided were compared as shown in Figure 10. Expected result which is correlation measurement wear rate through CAD model work would be establish. Dissimilarity result ΔD1 and ΔD2 shows linearity volume normal mesh and smooth mesh related to volume buoyancy as actual volume declared. See Table 1.
Table 1 Experiment data
| Spec | % Wear loss | Vol bouy | 3D Scan Volume (mm^3) | ΔD1 Nmesh | ΔD2 Smesh | |
|---|---|---|---|---|---|---|
| imen | Vol. | N_mesh | S_mesh | (%) | (%) | |
| T0.2 | 0.2% | 15361.619 | 15283.793 | 15316.401 | -0.51% | -0.29% |
| T0.4 | 0.4% | 14447.781 | 14414.486 | 14397.463 | -0.23% | -0.35% |
| T1.3 | 1.3% | 14190.601 | 14131.106 | 14120.986 | -0.42% | -0.49% |
| T1.6 | 1.6% | 14317.232 | 14090.127 | 14049.841 | -1.59% | -1.87% |
| T3.8 | 3.8% | 14836.815 | 14296.436 | 14281.226 | -3.64% | -3.74% |
| T5.4 | 5.4% | 14171.018 | 14104.952 | 14360.139 | -0.47% | 1.33% |
| T6.2 | 6.2% | 14454.308 | 14379.124 | 12466.879 | -0.52% | -13.75% |
Figure 10 (left) shows volume comparison of volume Normal mesh generated (N_mesh) and Smooth mesh generated (S_mesh) to volume buoyance (Vol bouy) for different percentage volume loss. Linearity among volume captured and volume buoyancy shows for the specimen T0.2, T0.4, T1.3 and T6.2. It can be explained as volume captured similarity is related to form of wear track or worn surface. Specimen T0.2, T0.4, T1.3, and T6.2 in Figure 8 (a, b, c & g) and Figure 9 (a, b, c & g) has less precipitous compare to T3.8 and T5.4.
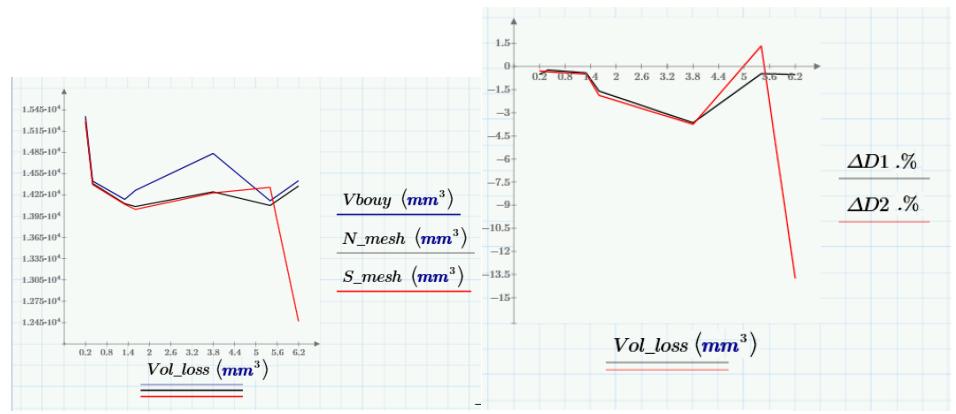
Figure 10 Volume comparison (left) Dissimilarity (right)
Statistical analysis was performed in order to determine the best meshing method to calculate worn surface volume. Distribution of data and Box plot of all volume examined are shown in graph Figure 11 and Figure 12. Refer to Vol bouy center graph of the N_mesh laid approx. 250 mm³ lower and S_mesh 500 mm³ respectively. Variability of N_mesh spanned in 1180 mm³ almost closed to 1190 mm³ Vol bouy variability while S_mesh spanned in 2850 mm³. This variability respect to dissimilarity between N_mesh and S_mesh export file. See
Figure 10 (right). S_mesh has large standard deviation compare to N_mesh, it means that the values in the data set are farther away from the mean, on average. Spreading value indicated that imaging object with S_mesh has other factor within capturing image should be considered.
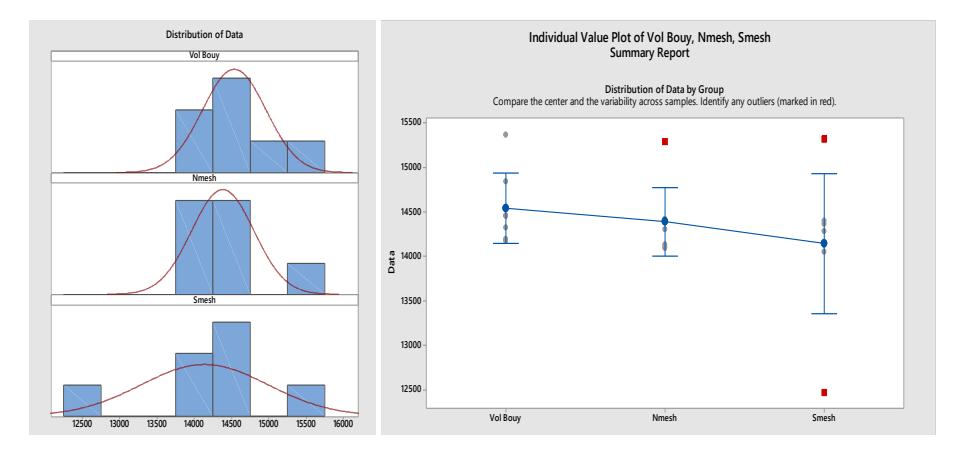
Figure 11 Distribution data and boxplot
| Statistics | Vol Bouy | Nmesh | Smesh |
|---|---|---|---|
| N | 7 | 7 | 7 |
| Mean | 14540 | 14386 | 14142 |
| StDev | 425.61 | 417.61 | 849.16 |
| Minimum | 14171 | 14090 | 12467 |
| Maximum | 15362 | 15284 | 15316 |
Figure 12 Statistic description
Potential factor to be investigated in near future should be minimizing occlusion in wear track. Occlusion can be appear regarding wide-depth scar ratio in wear track. For some wear failure wide-depth ratio perform as micro crater. This micro crater performed different mesh reconstruction in CAD model as well in measurement context.
Figure 13 Wear track as crater represent depth scar ratio
4 Conclusion
This study gives the following conclusions:
- 1. Linearity both volume captured and volume buoyancy showed conformity with the less different gap and depth scar ratio of worn track. However, level of meshing took further effect in dissimilarity. The lines extending from the box (whiskers) shows that higher mesh level tends volume measurement to diminish. Normal mesh method has better variability comparing smooth mesh method. Mesh method mentioned are suitable for capturing worn volume.
- 2. In this study, the negative dissimilarity is an evidence for smaller scan generated volume than real object. The paper reveals that normal meshing method provide better small dissimilarity level. Since the volume generate generally not relate to mesh level, further observation can be carried out to seek best fit scanning parameter and correlation volume scanned to variable form of scar or wear track.
- 3. Normal mesh differs at about 0.01% volume dissimilarity refer to volume buoyancy. Result could be a base to achieve better wear measurement technique. However in near future, the comprehend experiment regarding wear measurement using scan imaging should be conducted. Study hasn't yet to answer at which percentage of volume loss the 3D scan imaging could be captured.
5 Acknowledgment
Special thanks to P3MI ITB for supporting this study.
6 References
- [1] K.-H. Zum Gahr and G. T. Eldis, Abrasive Wear of White Cast Irons, Wear, vol. 64, pp. 175-194, 1980/10/01, 1980.
- [2] J. J. Coronado, A. Gómez, and A. Sinatora, Tempering Temperature Effects on Abrasive Wear of Mottled Cast Iron, Wear, vol. 267, pp. 2070- 2076, 2009.
- [3] K. M. Mashloosh and T. S. Eyre, Abrasive Wear and Its Application to Digger Teeth, Tribology International, vol. 18, pp. 259-266, 1985.
- [4] Penelitian Keausan Gigi BWD dan Upaya Modifikasi Untuk Meningkatkan Umur Efektifnya, ITB, Bandung, 2011.
- [5] LAPI-ITB, Laporan Harian Kapal Keruk Dan Kapal Isap Produksi KUNDUR, 2012 - 2013.
- [6] Shah, Anderson, Kim, Y.S, Joshi S, A Discourse on Geometric Feature Recognition From CAD Models, Journal of Computing and Information Science in Engineering, Vol. 1/51, March 2001.
- [7] Kyprianou, L., 1980, Shape Classification in Computer-Aided Design, Ph.D. Dissertation, University of Cambridge.
- [8] Lee, Kunwoo. Principles of CAD/CAM/CAE Systems I, Kunwoo Lee. p. em. Includes bibliographical references and index. ISBN 0-201-38036-6 1. CAD/CAM systems. 2. Computer-aided engineering. I. Title. TS155.6.lA45 1999 670'. 285-dc21.
- [9] Kurniawan, Kumpulan Catatan Penelitian Desertasi, 2013-2106
- [10] ASTM, Standard Test Method for Conducting Wet Sand/Rubber Wheel Abrasion Tests, ASTM G105-02, Vol 11.01, Annual Book of ASTM Standards.