
Abstrak
Penelitian ini adalah mengenai perilaku dari ikatan kohesif pada kontak antar butir tanah. Pengukuran langsung kohesi pada bidang geser kontak antara butir-butir tanah, belum pernah dilakukan. Suatu cara tidak langsung dipakai dalam studi ini, untuk memprakirakan kohesi kontak (pada bidang geser antara 2 butir) ratarata, dari pengukuran tegangan-tegangan total pada benda uji tanah.
Dua jenis material pasir diuji; yaitu pasir Ottawa dan crushed quatz (quartz tumbuk), dengan 2 nilai relative density yaitu 25% dan 75%; tiap material diuji dengan 4 kadar semen yang berbeda yaitu 0%, 2%, 4% dan 6% berat semen. Penambahan semen pada pasir tersebut, adalah untuk menciptakan kohesi yang dapat diatur, pada bidang kontak.
Hasil uji Consolidated Drained Tiaxial compression pada 118 benda uji pasir bersemen diatas, dianalisis, dan sebuah model dari Hardin (1985), dipakai untuk mengisolasi ikatan kohesi dan ikatan geser pada material kohesif. Model tersebut memperhatikan dua mekanisme dasar dari kekuatan tanah, dengan memperhatikan ikatan pada kontak antara butir dan kinematik dari pergerakan partikel dalam sebuah elemen dari tanah yang berdeformasi.
Hasilnya memperlihatkan bahwa kohesi kontak tak berdimensi berhubungan linier terhadap kadar semen, untuk pasir dengan relative density 25%, dan tidak linier untuk pasir dengan relative density 75%. Kohesi kontak tak berdimensi berkurang dengan bertambahnya relative density, untuk kadar semen 2 dan 4%, tetapi bertambah besar dengan naiknya relative density, untuk kadar semen 6%. Kontak kohesi tak berdimensi lebih besar pada pasir yang rounded dibanding dengan pada pasir yang angular.
Kata-kata kunci: ikatan kohesif, kontak antar butir-butir tanah, bidang geser kontak antar butir-butir tanah, kohesi kontak.
1) Staf Pengajar Departemen Teknik Sipil, Fakultas Teknik Sipil dan Perencanaan, Institut Teknologi Bandung.
Catatan : Usulan makalah dikirimkan pada 31 Oktober 2003 dan dinilai oleh peer reviewer pada tanggal 17 Nopember 2003 – 19 Januari 2004. Revisi penulisan dilakukan antara tanggal 20 Nopember 2003 hingga 28 Januari 2004.
1. Introduction
Cohesive bonding is said to exist at a contact between two soil particles when the contact has tensile strength, or when the contact can resist a shearing force in the absence of a normal contact force. Direct measurement of the cohesive strength at contacts in a soil sample has not been accomplished. Thus, indirect methods are used to estimate average contact cohesion from measurement of the total strength of soil specimens. This requires a model for soil strength that accounts for existing strength components (friction, cohesion, dilation, etc.). The model is used to isolate the cohesion component, and to compute the magnitude of average contact cohesion cµ, or some parameter related to c µ, from measured total strength.
This investigation deals with the behavior of cohesive bonding at particle contacts in soil. The results of 118 drained triaxial compression tests on sandcement specimens were analyzed, and the model by Hardin (1985) was used to isolate cohesive and frictional bonding in cohesive materials. This model considers the two basic mechanism of strength of soils, by considering bonding at particle contacts and the kinematics of particle movement within an element of deforming soil.
The study required many samples with varying amount of cohesion. The amounts of cohesive bonding in natural cohesive soil cannot be controlled. A convenient means of controlling cohesion is to test artificially cemented soils. The choice was made to test sand specimens with varying amounts of Portland cement. Sand is cohesion less material but cohesion is produced by the presence of cement in the sand.
Cohesion in sand-cement depends on the properties of sand particles and on the properties of the cement. Thus the cohesion of sand-cement specimens vary with particle mineralogy, grain size distribution, shape and hardness of particles, grain arrangements and density, cement content, curing time, etc. The results of this study indicate that the mineral friction angle φµ is about the same for cemented and uncemented sands.
Two types of materials were tested; Ottawa sand and crushed quartz, with two different relative densities, Dr = 25 and 75 percents; each material was tested with four different Portland cement contents, 0, 2, 4, and 6 percents of cement by weight. Consolidated Drained triaxial compression tests were carried out on the specimens in order to define the strength in terms of effective stress. Drained tests were also used in order to determine the volumetric strain behavior which is needed for application of Hardin's model.
The cohesion parameters of the Hardin and Schmertmann models have been compared. The magnitude of contact cohesion indicated by the two theories shows a high degree correlation.
2. Cohesion
2.1 Definition of true cohesion
The term cohesion as used in soil mechanics can be confusing. The cohesion that is measured by extending the Mohr-Coulomb failure envelope to normal stress σ'= 0, is not true cohesion because it includes the effects of dilation.
True cohesion is shear resistance which is mobilized between two adjacent particles which stick to each other without the existence of normal pressure; it is the force that arises within the particles themselves (Lambe, T. W. 1960). The existence of tensile or shear strength without the necessity of the existence of effective stress in the soil skeleton or on the failure plane can be taken as evidence of a true cohesion (Mitchell, J. K. 1976). It is the true cohesion that is the object of this study.
True cohesion is defined by considering the shear and normal forces, Ti and Ni, at a single sliding contact as shown in Figure 2.1.
The contact shearing resistance Ti will depend on the normal contact force Ni and the relationship may be expressed by the equation
\[T_i = C_{\mu i} + N_i \tan \phi_{\mu i} \tag{2.1}\]
Figure 2.1 The shear and normal forces, Ti and Ni at a single sliding contact where \(C_{\mu\,i}\) is the contact cohesion force and \(\phi_{\mu\,i}\) is the angle of mineral friction at contact i.
It should be noted that the relationship between \(T_i\) and \(N_i\) may be nonlinear in which case \(\varphi_{\mu\,i}\) is a function of \(N_i\)
The orientation of contact i is defined by the direction cosines \(l_i\), \(m_i\), and \(n_i\) between \(N_i\) and the directions of the major, intermediate, and minor principal stresses \(\sigma_{1}{}'\), \(\sigma_{2}{}'\) and \(\sigma_{3}{}'\) respectively, where \(\sigma_{1}{}'\), \(\sigma_{2}{}'\), and \(\sigma_{3}{}'\) are stresses in an element containing many particles. The stress \(\sigma'_{ni}\) in Figure 2.1 normal to the contact plane at contact i is given by
\[\sigma'_{ni} = \sigma'_1 l_i^2 + \sigma'_2 m_i^2 + \sigma'_3 n_i^2 \tag{2.2}\]
The normal contact force \(N_i\) is produced by the normal contact stress \(\sigma'_{ni}\) acting on an area \(A_i\) associated with sliding contact i where
\[A_{i} = \frac{N_{i}}{\sigma'_{...}} \tag{2.3}\]
The area \(A_i\) is also associated with the contact cohesion force \(C_{\mu i}\) such that the unit contacts cohesion \(c_{\mu i}\) is given by
\[c_{\mu i} = \frac{C_{\mu i}}{A_i} \tag{2.4}\] where \(c_{\mu i}\) is the true cohesion at sliding contact i. The average of all \(c_{\mu i}\) for all sliding contacts in an element of soil is the true cohesion \(c_{\mu}\) for the soil.
2.2 Definition of bonding obliquity angle
The bonding obliquity angle \(\phi_{0i}\) at sliding contact i in Figure 2.1 is defined by
\[\tan \phi_{0i} = \frac{T_i}{N_i} \tag{2.5}\]
Substituting Equation 2.1 for \(T_i\) in Equation 2.5 gives
\[\tan \phi_{0i} = \tan \phi_{\mu} + \frac{C_{\mu i}}{N} \tag{2.6}\]
Substituting Equation 2.3 into Equation 2.4 and dividing by \(\sigma'_{ni}\) gives \(c_{\mu a}/\sigma'_{ni} = C_{\mu a}/N_i\) which can be substituted into Equation 2.6 resulting in
\[\tan \phi_{0i} = \tan \phi_{\mu i} + \frac{c_{\mu i}}{\sigma} \tag{2.7}\]
Using average values of \(\sigma_{\mu}\), \(c_{\mu}\), and \(\sigma'_n\) for all sliding
contacts in an element of soil, it is assumed that
\[\tan \phi_0 = \tan \phi_\mu + \frac{c_\mu}{\sigma_\mu} \tag{2.8}\] where \(\phi_0\) is the bonding obliquity angle for an element of soil. [Note: using (average \(c_{\mu i}/\sigma'_{ni}\)) = (average \(c_{\mu i}/\sigma'_{ni}\)) average \(\sigma'_{ni}\)) is approximate but is the only practical way to proceed without assuming distributions for \(c_{\mu i}\) and orientations of sliding contacts].
Finally, multiplying numerator and denominator of \(\,c_\mu\,\) /\(\sigma'_n\) in Equation 2.8 by atmospheric pressure \(p_a\) and substituting
\[C_b = \frac{c_{\mu}}{p_a} \tag{2.9}\] where \(C_b\) = average dimensionless contact cohesion, gives
\[\tan \phi_{o} = \tan \phi_{\mu} + C_{b} \left\{ \frac{p_{a}}{\sigma_{n}^{'}} \right\}\] (2.10)
The stress \(\sigma'_n\) in Equations 2.8 and 2.10 is the mean value of \(\sigma'_{ni}\), i.e. the average effective stress normal to sliding contacts in an element of soil. Based on an analysis of the orientations of sliding contacts in an
\[\sigma_n = \frac{1}{2} \left[ (0.8 - 0.65 \sin \phi_o) \sigma_1 + (1.2 + 0.65 \sin \phi_o) \sigma_3 \right] (2.11)\]
element of soil, Hardin (1985) recommends using the following:
2.3 Schmertmann's cohesion parameter
In 1960, Schmertmann and Osterberg developed the IDS curvehopping technique to separate strength into two components; one component \(I_{\epsilon}\) that is independent of effective stress and the second component \(D_{\epsilon}\) that depends on effective stress.
\[\tau_{\varepsilon} = I_{\varepsilon} + D_{\varepsilon} \tag{2.12}\]
Furthermore, he isolated these components at various values of strain \(\epsilon\) (indicated by the subscript \(\epsilon\) on \(\tau\), I and D). By analysis of the \(I_\epsilon\) values, Schmertmann obtains a parameter \(I_b\) which analysis of Schmertmann's results shows that \(I_b\) is approximately equal to \(c_\mu \left( I_b \approx c_\mu \text{ for sand-cement with relative density } D_r = 25 \text{ percent, and } I_b = 0.75 c_\mu \text{ for sand-cement with } D_r = 75 \text{ percent)}.\)
3. Strength Model
The strength model by Hardin (1985) is formulated in terms of the bonding obliquity angle \(\phi_o\) and the maximum rate of dilation \(d_{max}\) (defined below). Using this model the bonding obliquity angle for a soil specimen can be determined from the results of a drained triaxial compression test with volume change measurements. Values of \(\phi_o\) determined in this way can be used with Equations 2.10 and 2.11 to find values of \(C_b = c_\mu / p_a\) and \(\phi_u\)
For triaxial compression, the strength model is given by:
\[R_{max} = K_{cv} + (2K_{min} - K_{cv})d_{max}\] (3.1)
where \(R_{max}\) is the maximum principal stress ratio at the peak = \((\sigma_1'/\sigma_3')_{max}\); \(K_{cv}\) is the critical state energy transmission ratio which is equal to the principal stress ratio at the critical state,
\(K_{cv} = R_{cv} = (\sigma_1' / \sigma_3')_{cv}\) and \(K_{min}\) is the minimum possible value of energy transmission ratio; and \(d_{max}\) is the maximum rate of dilation.
A plot of the theoretical relationships between \(R_{max}\) and \(D_{max}\) for various values of \(\phi_0\) is shown in Figure 3.1 Knowing values of \(R_{max}\) and \(R_{max}\), values of \(R_{max}\) and \(R_{max}\), values of \(R_{max}\) be determined graphically from Figure 3.1.
The critical state energy transmission ratio \(K_{cv}\) is related to the critical state angle of shearing resistance \(\phi_{cv}\) by the equation
\[K_{cv} = \frac{\left(1 + \sin\phi_{cv}\right)}{\left(1 - \sin\phi_{cv}\right)}\] (3.2)
and the critical state angle of shearing resistance \(\varphi_{cv}\) is related approximately to bonding obliquity angle \(\varphi_o\) as
\[\sin \phi_{cv} = \left(\frac{\pi}{2} - \phi_{o}\right) \tan \phi_{o} \tag{3.3}\]
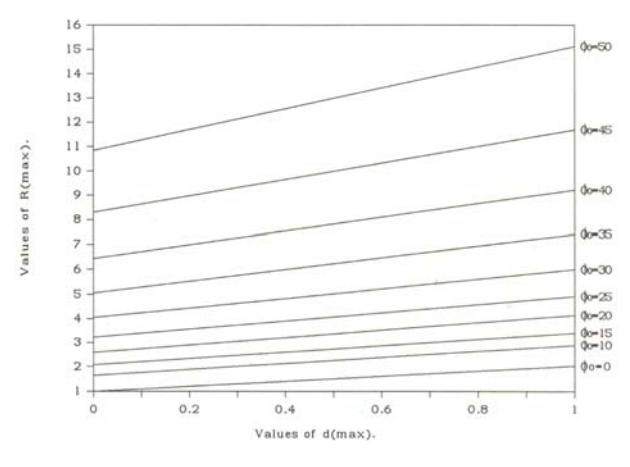
Figure 3.1 Chart for determining \(\phi_o\) from triaxial compression tests
obtained from the result of an analysis of distributions of orientations of sliding contacts.
The minimum value of energy transmission ratio \(K_{\text{min}}\) is related to the bonding obliquity angle as
\[K_{\min} = \frac{\left(1 + \sin \phi_{o}\right)}{\left(1 - \sin \phi_{o}\right)} \tag{3.4}\]
The maximum rate of dilation \(d_{max}\) is the maximum value of the rate of dilation \(-dv/d\epsilon_1\), where dv is the volumetric strain increment and \(d\epsilon_1\) is the strain increment in the direction of major principal stress \(\sigma_1\) '.Experiments show that \(R_{max}\) and \(D_{max}\) occur approximately simultaneously (see Figures. 3.2 and 3.3).
3. 1 To find \(\phi_o\) numerically from triaxial compression tests
Equation 3.1 can be used to find \(\phi_0\) from triaxial compression tests by the following algorithm that involves iteration:
- 1. Given: \(\sigma_1'\), \(\sigma_3'\) and \(d_{max}\) from a triaxial compression test.
- 2. Initialize \(\phi_0 = a\) value lower than the actual value.
3. \[\sin \phi_{\text{cvt}} = \left(\frac{\pi}{2} - \phi_{\text{o}}\right) \tan \phi_{\text{o}}\]
4. \[K_{\min} = (1 + \sin \phi_0) / (1 - \sin \phi_0)\]
5. \[K_{cvt} = (1 + \sin \phi_{cvt}) / (1 - \sin \phi_{cvt})\]
6. \[R_{max} = K_{cvt} + (2K_{min} - K_{cvt})d_{max}\]
7. Compare calculated \(R_{max}\) with measured \(R_{max} = (\sigma_1' / \sigma_3')_{max} = R_{max,m}\) the difference is
\[\Delta R_{max} = R_{max,m} - R_{max}\]
8. n = the number of times \(\Delta R\) changes signs, or 1, whichever is greater.
9. \[\phi_0 = \phi_0 - (-1)^n / 10^{n-2}\]
10. Return to step 3, until \(\Delta R \leq\) tolerance.
3.2 Determination of dimensionless contact cohesion \(C_b\)
For constant values of \(\varphi_{\mu}\) and \(C_b\), Equation 2.10 defines a linear relationship between tan \(\varphi_o\) and \(p_a/\sigma_n\) '. A series of triaxial compression tests may be conducted on a given material for a range of values of \(\sigma_3\)'.
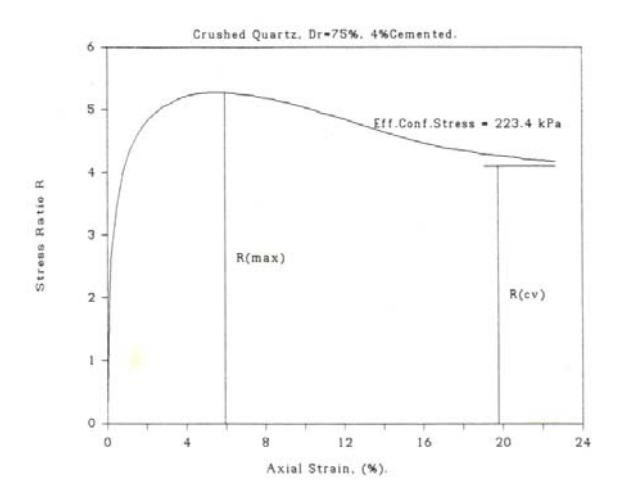
Figure 3.2 Typical stress-strain curve from a triaxial compression test
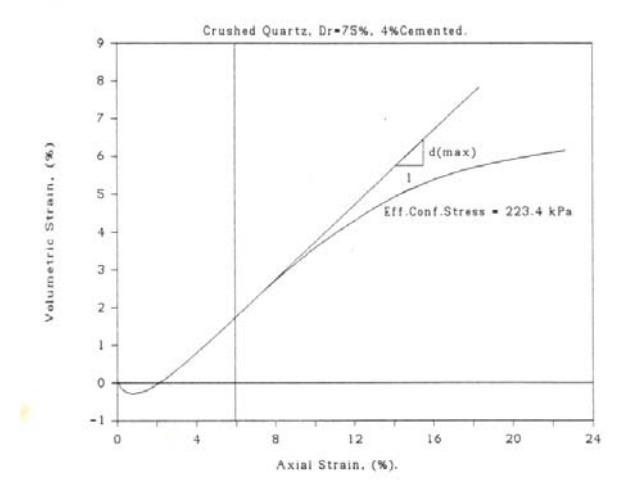
Figure 3.3 Typical volumetric strain vs. axial strain curve from a drained triaxial compression test
The measured values of Rmax and dmax can be used to determine corresponding values of φο, and thus tan φο, from the algorithm described in the previous section, and σn′ can be determined from Equation 2.11 using φ ο, σ3′ and σ1′ = Rmax σ3′. The values of tan φο can then be plotted versus pa / σn′ to determine tan φµ and Cb from the intercept and slope respectively of a straight line approximating the data.
4. Consolidated Drained Triaxial Compression Tests
Theory has been developed in chapter 3 to determine the bonding obliquity angle φο and dimensionless contact cohesion Cb from the results of triaxial compression tests with volume change measurement.
In order to study dimensionless true cohesion Cb = cµ / pa in granular materials, 118 consolidated drained triaxial compression tests on specimens of cemented and uncemented sands were conducted. This chapter describes materials used for these tests, test results, and analysis.
Many variables relating to cement treated soils were held constant for this testing program. Quality of cement, environment during hydration, age of mixture at time of testing (curing time), mixing and compacting method, and the triaxial sample preparation procedure were the same for all samples.
4.1 Materials and test results
Ottawa sand and crushed quartz are the two materials tested. They were chosen to measure the effects of particle shape while holding the mineral type (quartz) constant.
Ottawa sand particles are very rounded, while crushed quartz particles are angular. Grain size basic properties are shown in Table 4.1.
Samples with two different densities were tested corresponding to relative density Dr = 25 percent and 75 percent for each material.
Cement content has a large effect on the strength of cemented soil, and it is assumed to have a large effect on dimensionless contact cohesion Cb. Because of the importance of this effect, four different cement contents were applied to the samples, namely 0, 2, 4, and 6 percents by dry weight.
Results of all consolidated drained triaxial compression tests are presented in this section. The minor principal effective stress σ3′, maximum stress ratio Rmax = (σ1′ / σ3′)max, and maximum rate of dilation dmax are obtained from stress strain curves for each test. Some sample curves are presented in Figures 4.1 to 4.4 for Ottawa sand, and crushed quartz.
Table 4.1 Basic properties of ottawa sand and crushed quartz
| Soil properties and symbols | Ottawa sand | Crushed quartz |
|---|---|---|
| particle shape | Rounded | angular |
| mineralogy | Quartz | Quartz |
| plasticity | NP | NP |
| specific gravity, Gs | 2.67 | 2.64 |
| min. void ratio emin | 0.507 | 0.654 |
| max. void ratio emax | 0.713 | 0.986 |
| diameter D50 | 0.269 | 0.420 |
| coeff. of uniformity Cu | 3.086 | 1.840 |
| coeff. of gradation Cc | 0.974 | 0.947 |
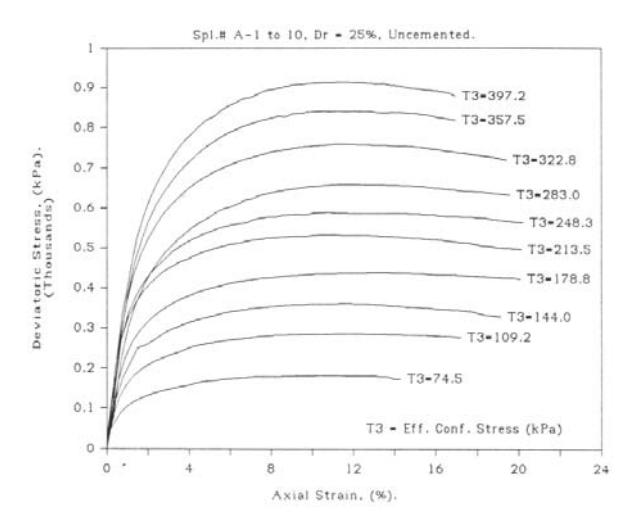
Figure 4.1 a. Deviatoric stress vs. axial strain; ottawa sand, dr = 25%, uncemented
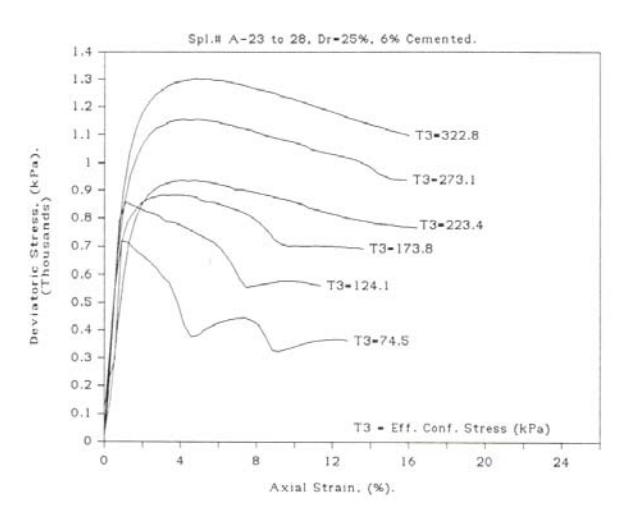
Figure 4.2 a. Deviatoric stress vs. axial strain; ottawa sand, dr = 25%, 6% cemented
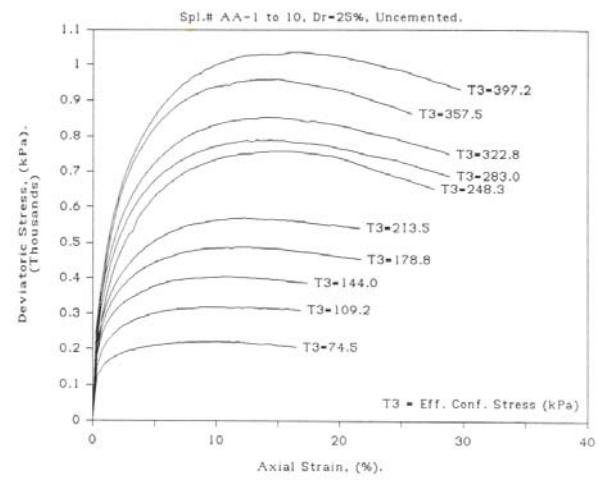
Figure 4.3 a. Deviatoric stress vs. axial strain; crushed quartz, dr = 25%, uncemented
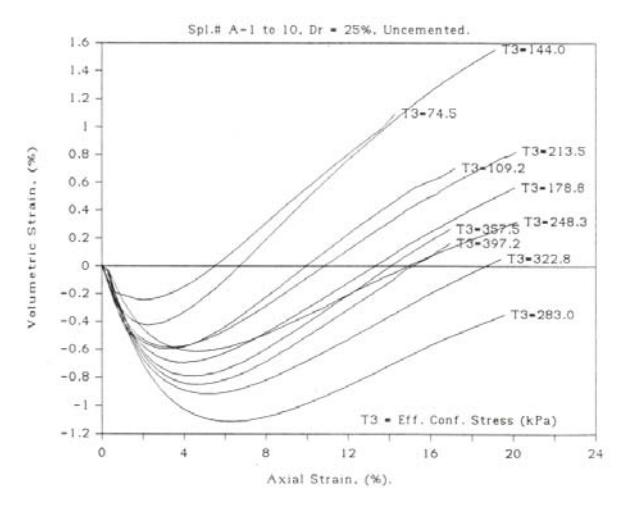
Figure 4.1 b. Volumetric strain vs. axial strain; ottawa sand, dr = 25%, uncemented
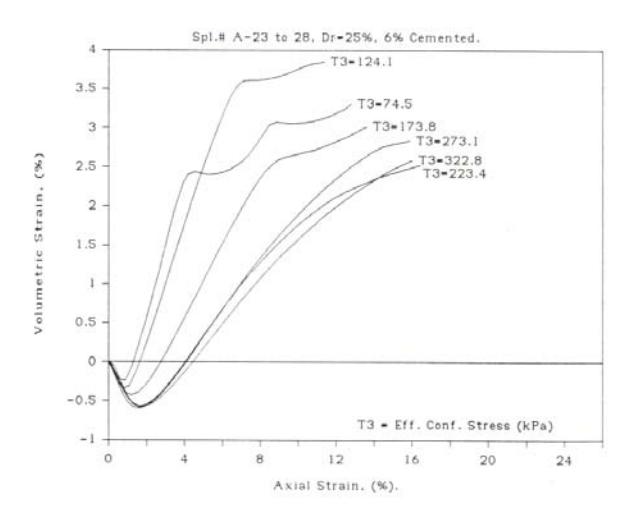
Figure 4.2 b. Volumetric strain vs. axial strain; ottawa sand, dr = 25%, 6% cemented
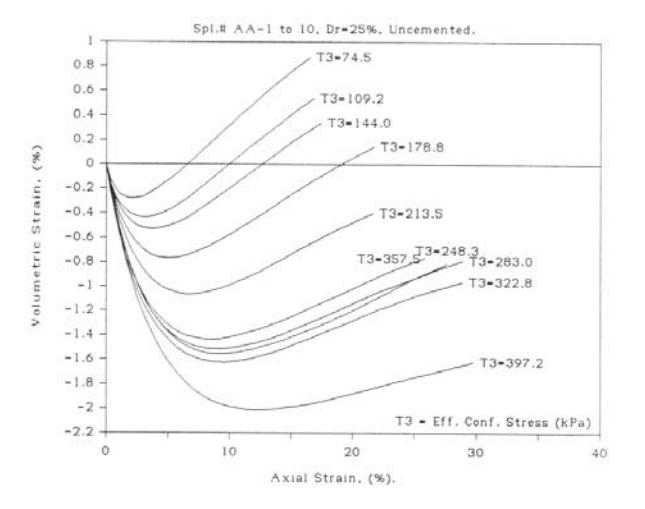
Figure 4.3 b. Volumetric strain vs. axial strain; crushed quartz, dr = 25%, uncemented
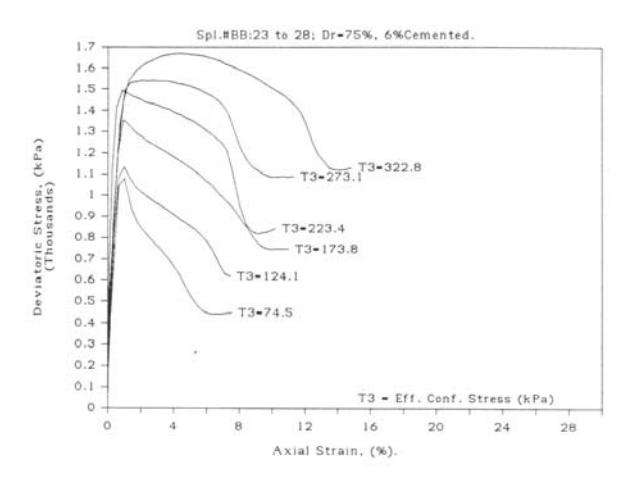
Figure 4.4 a. Deviatoric stress vs. axial strain; crushed quartz, dr = 75%, 6% cemented
The maximum deviatoric stress (σ1′ / σ3′)max, occurs approximately simultaneously with the maximum rate of dilation dmax on almost all samples (see chapter 3).
4.2 Dimensionless contact cohesion Cb
As stated in the last section of chapter 3, "Determination of Dimensionless Contact Cohesion," a linear relationship between the tan φο and pa / σn′ is assumed in order to define a constant value of dimensionless contact cohesion Cb. A line approximating each data set in Figures 4.5 to 4.8 is found by linear regression where the tan φο intercept is constrained to the value for uncemented sand. The value of tan φο for uncemented sand is equal to tan φµ.
According to Equation 2.9, the slope of the line is equal to the dimensionless contact cohesion Cb, and the intercept is tan φµ. The values of Cb and tan φµ are shown in Tables 4.2 along with the tan φο values defined by regression lines and the values of correlation coefficient R as a measure of how well a curve fits the data points. A curve fit with a value of correlation coefficient higher than 0.900 is a good fit, (Orvis, W. J.). A summary of Cb and tan φµ values is given in Table 4.3 along with the corresponding R.
The determination of Cb as described above is based on the assumption that tan φµ is independent of confinement over a large stress range and thus is also independent of σn′. All four sets of results for uncemented sands, Ottawa sand and crushed quartz at relative densities 25 and 75 percents indicate that tan φ µ is independent of σn′, i.e. tan φο vs. pa / σn′ is approximately a horizontal straight line for each case with correlation coefficients above 0.900. Each horizontal line is assumed to define the constants tan φµ.
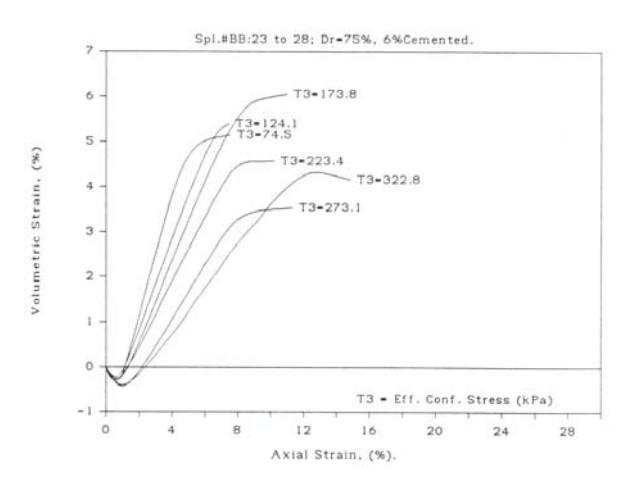
Figure 4.4 b. Volumetric strain vs. axial strain; crushed quartz, dr = 75%, 6% cemented
Other tables for the values of φο, sin φcvt, Kmin,, Kcvt, tan φο, pa / σn′, and results from regression tan φο, tan φ µ, and Cb, for Ottawa sand, Dr = 75%, and for crushed quartz are not shown here, but the plotted data are shown in the following tables.
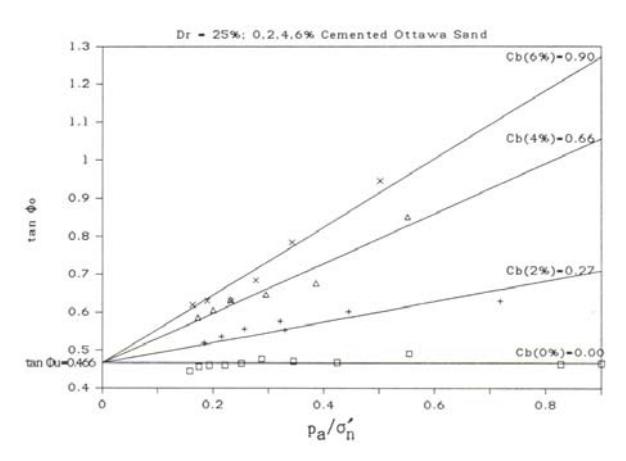
Figure 4.5 tan φο versus pa / σn′, Dr = 25%; 0,2,4,6% cemented Ottawa Sand
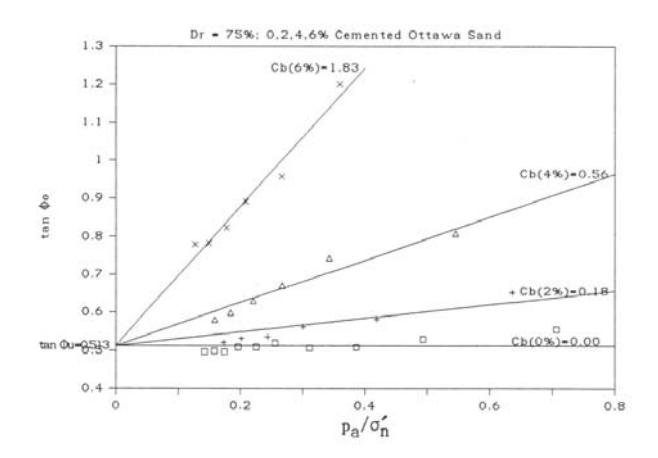
Figure 4.6 tan φο versus pa / σn′, Dr = 75%; 0,2,4,6% cemented Ottawa Sand
Table 4.2 \(\phi_{\rm o}\), \(\sin\phi_{\rm cvt}\), \(K_{\rm min}\), \(K_{\rm cvt}\), \(\tan\phi_{\rm o}\), \(p_{\rm a}\) / \(\sigma_{\rm n}\) and results from regression: \(\tan\phi_{\rm o}\), \(\tan\phi_{\rm u}\), and \(C_{\rm b}\), for Ottawa sand, \(D_{\rm r}=25\%\).
| Spl. | \(\sigma_{3}'\) | фо | \[Sin \ \phi_{\chi\varpi\tau}\] | \(\mathbf{K}_{\min}\) | \(\mathbf{K}_{\mathrm{cvt}}\) | tan \(\phi_o\) | \(P_a / \sigma_n'\) | tan φo |
|---|---|---|---|---|---|---|---|---|
| # | (kPa) | from regrs. | ||||||
| Cement of | content = | 0% | regrs. | |||||
| A 1 | 74.5 | 24.88 | 0.53 | 2.453 | 3.230 | 0.464 | 0.827 | 0.466 |
| A 2 | 109.2 | 26.14 | 0.55 | 2.575 | 3.415 | 0.491 | 0.555 | 0.466 |
| A 3 | 144.0 | 25.08 | 0.53 | 2.471 | 3.258 | 0.468 | 0.424 | 0.466 |
| A 4 | 178.8 | 25.22 | 0.53 | 2.484 | 3.277 | 0.471 | 0.346 | 0.466 |
| A 5 | 213.5 | 25.44 | 0.54 | 2.506 | 3.311 | 0.476 | 0.288 | 0.466 |
| A 6 | 248.3 | 24.95 | 0.53 | 2.459 | 3.239 | 0.465 | 0.251 | 0.466 |
| A 7 | 283.0 | 24.71 | 0.52 | 2.437 | 3.205 | 0.460 | 0.222 | 0.466 |
| A 8 | 322.8 | 24.68 | 0.52 | 2.434 | 3.201 | 0.460 | 0.194 | 0.466 |
| A 9 | 357.5 | 24.52 | 0.52 | 2.419 | 3.178 | 0.456 | 0.175 | 0.466 |
| A 10 | 397.2 | 23.98 | 0.51 | 2.369 | 3.103 | 0.445 | 0.158 | 0.466 |
| From reg | gression : | \[tan \; \varphi_{\mu} =\] | \(0.466, C_b = 0\) | Q, R = 0.998 | ||||
| Cement ( | content = | 2% | ||||||
| A 11 | 74.5 | 32.14 | 0.63 | 3.274 | 4.472 | 0.628 | 0.718 | 0.660 |
| A 12 | 124.1 | 31.04 | 0.62 | 3.129 | 4.254 | 0.602 | 0.445 | 0.586 |
| A 13 | 173.8 | 29.94 | 0.60 | 2.993 | 4.047 | 0.576 | 0.321 | 0.553 |
| A 13R | 173.8 | 28.95 | 0.59 | 2.876 | 3.871 | 0.553 | 0.330 | 0.555 |
| A 14 | 223.4 | 29.09 | 0.59 | 2.892 | 3.895 | 0.556 | 0.257 | 0.535 |
| A 15 | 273.1 | 28.20 | 0.58 | 2.791 | 3.743 | 0.536 | 0.215 | 0.524 |
| A 16 | 322.8 | 27.42 | 0.57 | 2.707 | 3.615 | 0.519 | 0.184 | 0.515 |
| \(0.466, C_b = 0\) | 0.27, R = 0.8 | 849 | ||||||
| content = | ||||||||
| A 17 | 74.5 | 40.42 | 0.74 | 4.687 | 6.603 | 0.852 | 0.552 | 0.827 |
| A 18 | 124.1 | 34.06 | 0.66 | 3.547 | 4.884 | 0.676 | 0.386 | 0.718 |
| A 19 | 173.8 | 32.88 | 0.64 | 3.375 | 4.625 | 0.646 | 0.296 | 0.659 |
| A 20 | 223.4 | 32.31 | 0.64 | 3.296 | 4.505 | 0.632 | 0.232 | 0.617 |
| A 21 | 273.1 | 31.22 | 0.62 | 3.152 | 4.287 | 0.606 | 0.200 | 0.597 |
| A 22 | 322.8 | 30.37 | 0.61 | 3.045 | 4.126 | 0.586 | 0.172 | 0.578 |
| - | \(0.466, C_b = 0\) | 0.66, R = 0.9 | 968 | |||||
| content = | ||||||||
| A 23 | 74.5 | 43.38 | 0.77 | 5.388 | 7.657 | 0.945 | 0.503 | 0.916 |
| A 24 | 124.1 | 38.10 | 0.71 | 4.223 | 5.904 | 0.784 | 0.343 | 0.773 |
| A 25 | 173.8 | 34.36 | 0.66 | 3.591 | 4.950 | 0.684 | 0.277 | 0.714 |
| A 26 | 223.4 | 32.15 | 0.63 | 3.275 | 4.473 | 0.628 | 0.232 | 0.674 |
| A 27 | 273.1 | 32.20 | 0.64 | 3.282 | 4.484 | 0.630 | 0.189 | 0.635 |
| A 28 | 322.8 | 31.72 | 0.63 | 3.218 | 4.387 | 0.618 | 0.163 | 0.612 |
| From regression: \(\tan \phi_{\mu} = 0.466\), \(C_b = 0.90\), \(R = 0.975\) | ||||||||
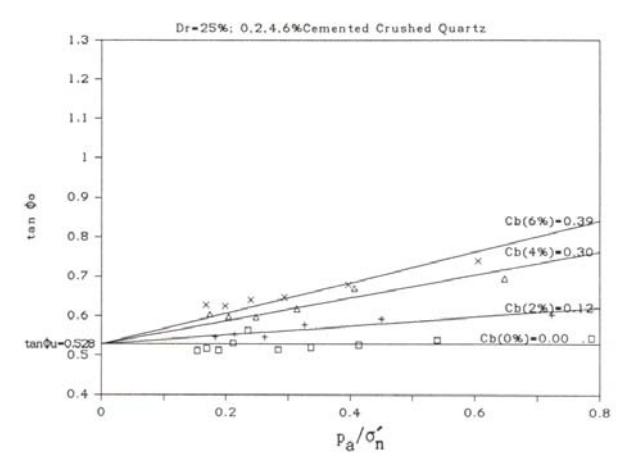
Figure 4.7 tan \(\phi_o\) versus \(p_a/\sigma_n{'},\) D<sub>r</sub> = 25%; 0,2,4,6% cemented Crushed Quartz
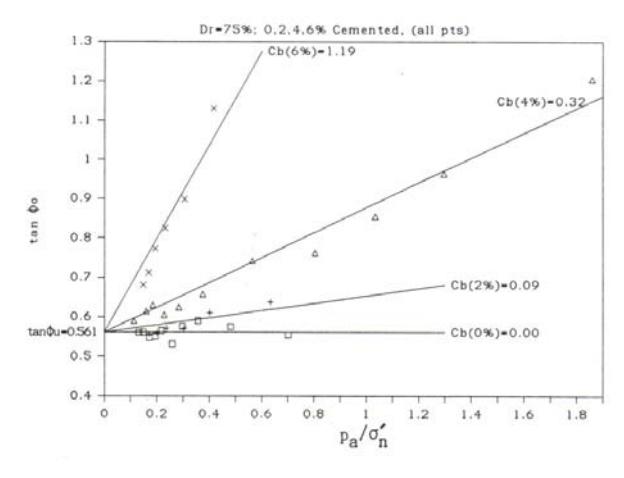
Figure 4.8 tan \(\phi_o\) versus \(p_a/\sigma_n{'}\), \(D_r\) = 75%; 0,2,4,6% cemented Crushed Quartz (all points)
Table 4.3. Dimensionless contact cohesion \(\textbf{C}_{\text{b}},\) tangent of contact friction angle tan \(\varphi_{\mu}\) and the corresponding correlation coefficient R
| Relative | Cement | Correlation | |||
|---|---|---|---|---|---|
| Material | density | content | \(C_{\mathbf{b}}\) | tan \(\phi_{\mu}\) | coefficient |
| Dr (%) | (%) | _ | ταπ ψμ | R | |
| Ottawa | 25 | 0 | 0.00 | 0.466 | 0.998 |
| sand | 2 | 0.27 | " | 0.849 | |
| 4 | 0.66 | " | 0.967 | ||
| 6 | 0.90 | 46 | 0.975 | ||
| 75 | 0 | 0.00 | 0.513 | 0.994 | |
| 2 4 | 0.18 | " | 0.913 | ||
| 0.56 | " | 0.967 | |||
| 6 | 1.83 | " | 0.983 | ||
| Crushed | 25 | 0 | 0.00 | 0.528 | 0.996 |
| quartz | 2 | 0.12 | " | 0.913 | |
| 4 | 0.30 | " | 0.895 | ||
| 6 | 0.39 | " | 0.864 | ||
| 75 | 0 | 0.00 | 0.561 | 0.995 | |
| (all | 2 | 0.09 | " | 0.814 | |
| points) | 4 | 0.32 | " | 0.988 | |
| 6 | 1.19 | " | 0.953 | ||
| 0.05 | 0.4. | ||||
| 75 | 0 | 0.00 | 0.561 | 0.995 | |
| (without | 2 | 0.09 | 0.814 | ||
| B-23 | 4 | 0.29 | " | 0.988 | |
| B-33) | 6 | 1.06 | " | 0.957 |
Data for Ottawa sand with relative density equal to 25 percent in Table 4.2 are plotted in Figure 4.5. Uncemented sand gives the value tan \(\varphi_\mu=0.466\) (\(\varphi_\mu=25^\circ\)) which is a reasonable value. Using tan \(\varphi_\mu=0.46\) 6, straight lines representing data points for 2, 4, and 6 percents cement, respectively, lead to values of \(C_b=0.27,\,0.66,\,\) and 0.90, with correlation coefficients \(R=0.849,\,0.967,\,\) and 0.975, (see Table 4.3). The value of \(C_b\) increases with increasing cement content.
Data for Ottawa sand with relative density equal to 75 percent are plotted in Figure 4.6. Uncemented sand gives tan \(\phi_{\mu} = 0.513\) (\(\phi_{\mu} = 272^{\circ}\)) which is reasonable for a higher density Ottawa sand, since \(\phi_{\mu}\) should increase with decreasing void ratio (Hardin 1985). Using tan \(\phi_{\mu} = 0.513\), straight lines representing data points for 2, 4, and 6 percents cement, respectively, lead to values of \(C_b = 0.18\), 0.56, and 1.83, with correlation coefficients R = 0.913, 0.967, and 0.983. The value of \(C_b\) increases with increasing cement content, and the increase is larger, compared with of \(C_b\) for relative density 25 percent.
Data for crushed quartz with relative density equal to 25 percent are plotted in Figure 4.7. Uncemented crushed quartz gives tan \(\phi_{\mu}\)= 0.528 (\(\phi_{\mu}\)= 27.8). Compared with Ottawa sand, crushed quartz particles are angular in shape, and the particle size is larger.
Using tan \(\phi_{\mu}\) = 0.528, straight lines representing data points for 2, 4, and 6 percents cement, respectively lead to values of \(C_b\) = 0.12, 0.30, and 0.39 with correlation coefficients R = 0.913, 0.895, and 0.864 respectively.
The \(\phi_{\mu}=\) for crushed quartz can be compared to the value for Ottawa sand by using Equation 4.5 (Hardin 1985). The Ottawa sand with \(D_r=25\) percent has initial void ratio \(e_i=0.661\); shape number \(n_s=15\) (rounded); \(D_{50}=0.269\) mm; and tan \(\phi=0.466\) at the effective confining pressure \(\sigma_3'=74.5\) kPa. Based on results for several sands \(r_{\sigma}=0.90\) is used for Ottawa sand and \(r_{\sigma}=0.75\) for crushed quartz.
Substituting into Equation 4.5 tan \(\phi_{\mu std}\) is found = 0.556 is found. Using this \(\phi_{\mu std}\) Equation 4.5 can now be used to estimate \(\phi_{\mu}\) for crushed quartz with relative density \(D_r = 25\) percent.
\[\tan \phi_{\mu} = \frac{7 \tan \phi_{\mu s t d}}{\left(1 + r_{\sigma}\right) \left(1 + e_{i}\right)} \left[\frac{n_{s}}{25}\right]\] \[\left[0.4 + \frac{0.6}{1 + 6\frac{D_{50}}{D_{ref}}}\right] \left[r_{\sigma} + \frac{\left(1 + r_{\sigma}\right)}{1 + \frac{\sigma_{3}}{10 p_{\sigma}}}\right]\] (4.5)
values are substituted, \(e_i = 0.903\); \(D_{50} = 0.42\) mm; \(n_s = 25\) (angular); \(\sigma_3{}' = 74.5\) kPa; and \(r_{\sigma} = 0.75\). The computed value of tan \(\phi_{\mu}\) is 0.659 (\(\phi_{\mu} = 33.4^{\circ}\)). This is considerably higher than indicated by the result in Figure 4.7. However, the effect of particle shape on values of \(\phi_{\mu}\) computed from Equation 4.5 is large and the value \(n_s = 20\) (sub-angular) gives = \(\phi_{\mu} = 27.8^{\circ}\) as indicated by Figure 4.7.
Data for crushed quartz with relative density equal to 75 percent are plotted in Figure 4.8. Uncemented sand gives the value tan \(\varphi_{\mu} = 0.651\) (\(\varphi_{\mu} = 29.3^{\circ}\)). This tan \(\varphi_{\mu}\) is larger than for crushed quartz with 25 percent relative density. Using the same procedure as crushed quartz with \(D_r=25\) percent in applying Equation 4.5 for crushed quartz with \(D_r=75\) percent (\(e_i=0.903\)), tan \(\varphi_{\mu}=0.722\) is found for \(n_s=25\) and tan \(\varphi_{\mu}=0.578\) for \(n_s=20\), which is very close to 0.561 found from regression in Figure 4.8.
Using tan \(\phi_{\mu}=0.561\), straight lines representing data points for 2, 4, and 6 percents cement, respectively, lead to values of \(C_b=0.09,\,0.29,\,\) and 1.06 with correlation coefficients \(R=0.814,\,0.988,\,\) and 0.957.
Using all available data (Figure 4.8), values of \(C_b\) are 0.09, 0.32, and 1.19 with correlation coefficients R = 0.814, 0.988, and 0.953 respectively.
The discarded data point, BB-33, is for tests with a very low effective confining pressure of 15 kPa. The increase of \(C_b\) with increasing cementation is larger than for crushed quartz with relative density equal to 25 percent.
5. Conclusions
Cohesive bonding at the sliding contacts in an element of soil has been studied using the model for soil strength proposed by Hardin (1985). That model contains two basic parameters, the bonding obliquity angle \(\phi_o\) that represents both frictional and cohesive bonding at sliding contacts and the maximum rate of dilation \(d_{max}\) that represents kinematics of particle movement within an element of deforming soil.
According to the model tan \(\phi_o\) is linearly related to the reciprocal of the effective stress normal to sliding contacts, \(\sigma_n'\). The data presented in Figure 4.5 indicate an approximately linear relationship. Furthermore, eleven tests over an extended stress range \(\sigma_3' = 15\) to 480 kPa (Figure 4.8, 4% cement) were conducted to prove more conclusively the linearity of the relationship.
Also according to the model the slope of the linear relationship between tan \(\phi_o\) and \(p_a/\sigma_n'\) defines the dimensionless contact cohesion \(C_b\).
For Ottawa sand and crushed quartz with relative density 25 percent, \(C_b\) increases approximately linearly with cement content with very high correlation coefficients (0.996 and 0.994 respectively). \(C_b = 0.152\) c for Ottawa sand with \(D_r = 25\%\), and \(C_b = 0.067\) c for crushed quartz with \(D_r = 25\%\), where c is cement content.
For Ottawa sand and crushed quartz with relative density 75 percent, the relationships between \(C_b\) and cement content are nonlinear and are approximated by the relationship \(C_b = \alpha c + \beta c^{\eta}\) where \(\alpha\), \(\beta\) and \(\eta\) are material constants. \(C_b = 0.07c + 0.001c^{4.05}\) for Ottawa sand with \(D_r = 75\%\) and \(C_b = 0.03c + 0.001c^{3.781}\) for crushed quartz with \(D_r = 75\%\).
The value of \(C_b\) decreases with increasing relative density for 2 and 4 percents cement for both Ottawa sand and crushed quartz, but it rapidly increases with increasing density for 6 percent cement. A hypothesis to explain this is as follows. Both number of contacts and amount of cement increase with increasing density. However, the reduction of \(C_b\) with increasing density indicates that the increase in cement is not sufficient to provide the same bonding at the increased number of contacts for 2 and 4 percents cement.
The value of C<sub>b</sub> for Ottawa sand (rounded material) is larger than that for crushed quartz (angular material) for all cement contents and for all relative densities.
The measured value of \(d_{max}\) which are plotted versus \(\sigma_3\)' for each cement content and for each material, are very close to the curves defined by Equation 4.7 with the coefficients listed in Table 4.5. Values of \(d_{max}\) are higher for higher cement content, for all densities and for both materials, which means that the maximum rate of dilation increases with increasing cement content or with increasing contact cohesion, since contact cohesion increases with increasing cement content. Cemented sands behave like uncemented sands with higher density (Hardin, 1988).