
Abstrak
Studi ini menyajikan hasil pengamatan jangka-panjang penurunan permukaan perkerasan akibat beban lalu lintas di ruas jalan akses ke Bandar Udara Saga, Jepang. Sebagai tambahan, karakteristik dasar deposit tersebut didiskusikan dalam kaitannya dengan tipikal perilakunya seperti; sensitivitas tinggi, kompressibilitas tinggi, dan daya dukung tanah rendah. Perilaku dasar deposit dicirikan endapan lunak dengan ketebalan 20-25 m dengan kadar air natural jauh lebih tinggi dibanding nilai batas cairnya. Nilai permeabilitas pada tataran lapisan lempung-kelanauan diaproksimasikan 3 – 5 kali nilai permeabilitas lempung Ariake pada umumnya. Profil penurunan sepanjang ruas jalan akses ke Bandar Udara Saga menvisualkan penurunan diferensial yang tidak seragam. Penurunan diferensial lebih besar terjadi diantara dua "box culvert" yang ditopang oleh tiang tipe perlawanan ujung. Impak dinamis dipandang sebagai salah satu faktor berpengaruh terhadap besarnya penurunan terjadi pada bagian tengah ruas jalan antar kedua bangunan "box culvert" tersebut. Pengamatan total penurunan diperkirakan 0.5 m setelah 3 tahun dibuka untuk lalu lintas; hal itu diakumulasikan terutama akibat penurunan konsolidasi badan jalan. Hal itu dapat dijustifikasikan bahwa penurunan yang ditimbulkan beban lalu lintas diaproksimasikan sekitar 20% dari total penurunan badan jalan.
Kata-kata Kunci: Pengamatan jangka-panjang, profil geologis, penurunan diferensial, beban lalu lintas.
1. Introduction
The foundation design problem of low embankment highways is the persistent repeated loading of the soft subground, which is subjected to compression over a long period of time. This type of highway is often constructed due to its stability and for economical reasons, and it is designed by conventional static calculation methods. When the subground of low embankment consists of soft cohesive soils (silty clay and clay), pavement has frequently suffered from unpredictably large settlement after opening to traffics. This aspect has received a great deal of attention in the past, especially in early research on soil dynamics [Seed et al., 1955; Yamanouchi et al., 1964]. Several cases in the Saga plain [Yamanouchi et al., 1975; Yasuhara et al., 1983; and Miura et al., 1995] noted that the settlement induced by traffic loading must be especially emphasized.
In Japan, low embankment highways constructed on soft deposit have therefore been prevalent throughout the country. Yasuhara et al. [1983] performed field measurements and laboratory tests on a low embankment
1. Dept of Civil Eng., Faculty of Engineering, Hasanuddin University, Indonesia.
2. Prof. Emeritus, Dept of Civil Eng., Faculty of Science & Eng., Saga University, Japan.
3. Associate Prof., Dept of Civil Eng., Faculty of Science & Eng., Saga University, Japan.
Catatan: Usulan makalah dikirimkan pada 16 Juni 2005 dan dinilai oleh peer reviewer pada tanggal 02 Agustus 2005 - 18 Agustus 2005. Revisi penulisan dilakukan antara tanggal 18 September 2005 hingga 03 Oktober 2005.
highway under vehicles moving, and insisted that the settlement should be attributed to the subground consolidation. Several highways around the Ariake plain have been reported to suffer from abnormal settlement after opening for traffics [Mori et al., 1994 and Fujiwara et al., 1989]. A case of the excessive differential settlement of a low embankment highway with lime improved-base materials was recently reported by Miura et al. [1993, 1995b]. The function of a polymer grid in base material [Miura et al., 1990a] has been proved effectively in suppressing a non-uniform settlement due to traffic loading.
In order to investigate the mechanism of this settlement phenomenon, sampling of the soft cohesive soils was done on the adjacent investigation site of Saga airport highway. Since traffic load induced settlement is a long-term phenomenon, this study observes the settlement phenomenon under partial situations. To model the test results, a series of undrained static triaxial tests was conducted under similar conditions of partially drained cyclic triaxial tests [Samang et al., 2000]. The long-term settlement measurements of Saga airport highway for 3 typical road sections are here mainly presented. In addition, the subground characteristics are also discussed in terms of geotechnical profiles and its basic properties.
2. Subground Characteristics
In many cases, lowland areas are commonly found around shore areas or estuarine areas which are mainly composed of alluvial marine soft cohesive soils on the top layer. A typical this example is the Saga plain
(lowland reclaimed from the Ariake Sea, (Figure 1) where the Saga airport and its access road were situated. This is a peculiar case in which an airport has been constructed on this type of reclaimed lowland in Japan.
To mitigate the problems that can arise from these difficult conditions, a lot of laboratory and field investigations have been done under static conditions [Yoshioka et al., 1994; Miura et al., 1993]. The following discussion presents the basic features of the subground in the investigation sites and compares them with the present test results. A map of the Saga plain, where the samplings and the field observations were made, is shown in Figure 2. Due to the fact that existing ground surface in this plain is almost lower than the mean sea level, a high concrete retaining wall was constructed in order to protect the site from daily tidal changes and storm wave action during the typhoon season.
2.1 Environmental and geological setting
Figure 3 shows the geotechnical and environmental profiles of the Saga plain. The structures founded in the coastal area of this plain are affected by 4 to 6 m daily tidal fluctuations of the Ariake Sea. Saga airport is located about 9 km south of the Saga City. The existing ground surface is +0.4 m, below the mean sea water level, and the highest water sea level can be as high as +5.0 m during the typhoon season (July-September). Saga Airport is one of an important infrastructure in this plain which has been completed since the fiscal year of 1999.
Figure 1. Map of Japan and location of Saga plain
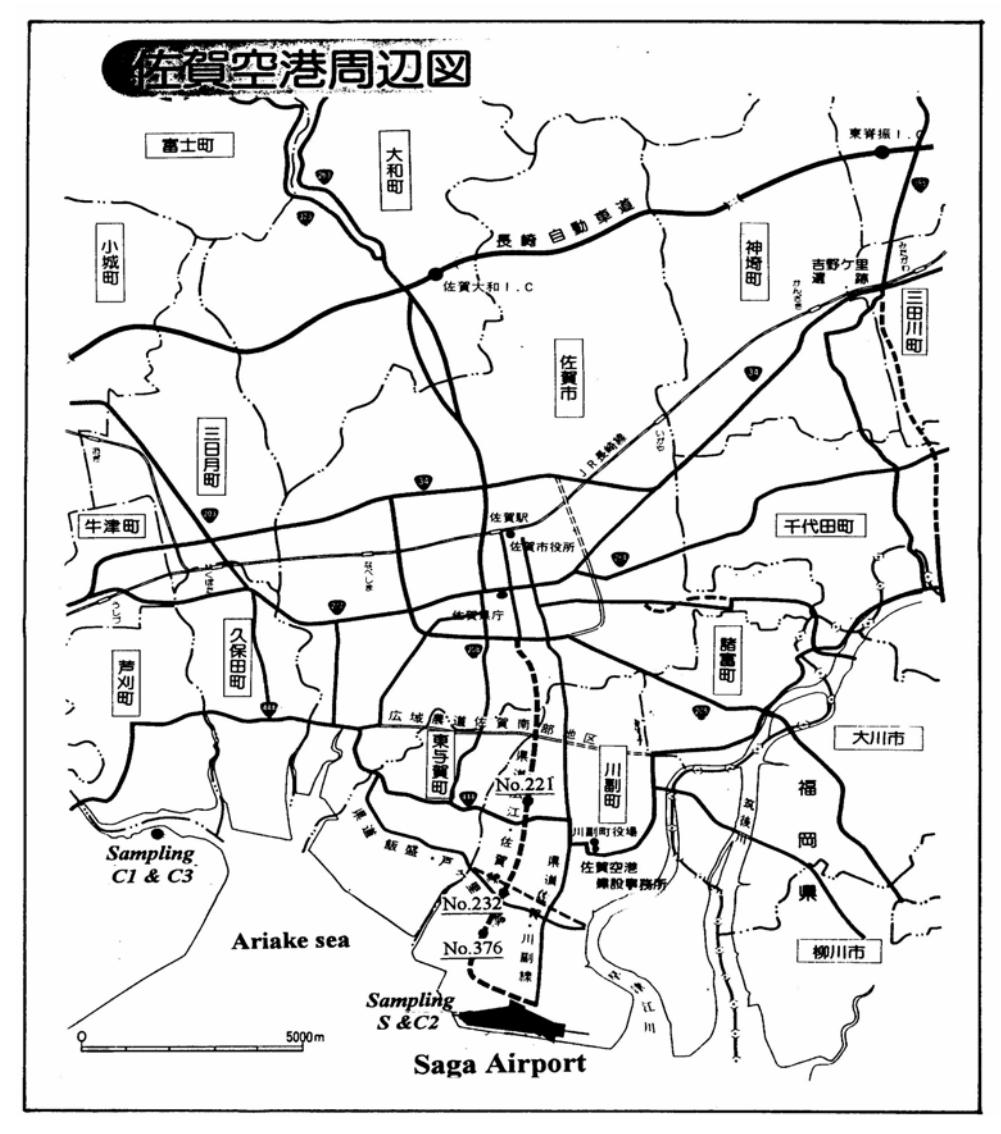
Figure 2. Map of Saga plain and site of investigation
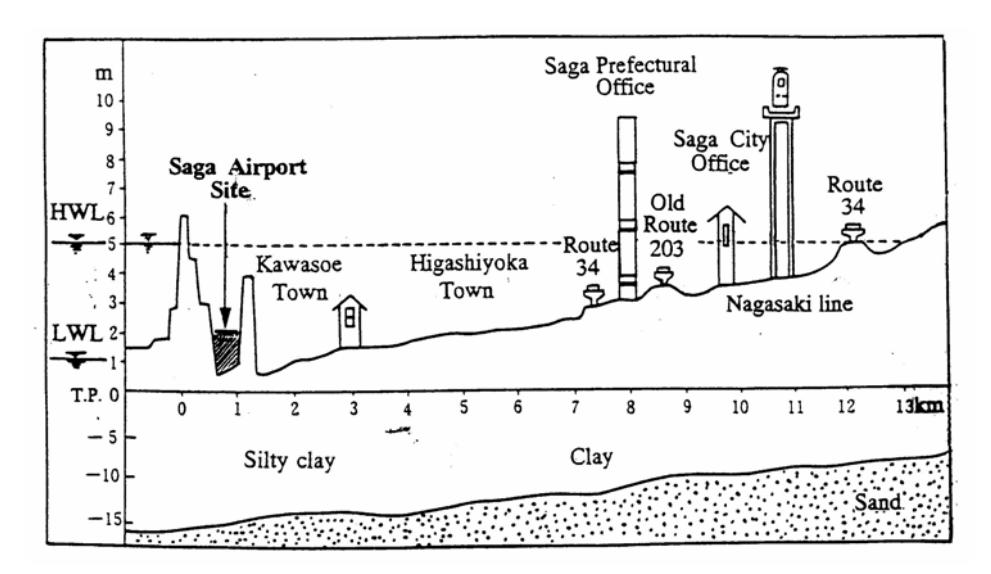
Figure 3. Geotechnical and environmental profile of Saga plain
To provide access to this site the Saga airport highway has been constructed and opened to traffic since 1992 as indicated by the dashed line (Figure 2). Due to nonuniform settlement, the maintenance of road has been regularly performed by reoverlaying the pavement surface. The subground characteristics along the road were intensively investigated and reported by the Saga Prefectural Office, Division of Civil Engineering. Additional testing was also conducted in the Saga University, laboratory of geotechnical engineering.
The geological profiles along the Saga airport highway are presented in Figure 4 and show a geological stratum to be similar to that of the Saga airport [Yoshioka et al., 1994]. Two or three alluvial sand layers intermediate the soft deposit. The alluvial deposit of three layers, Ac1, Ac2, and Ac3 had almost zero SPT (Standard Penetration Test)
values. Several layers of sand, As1 and As2, are randomly deposited, below which a medium to dense diluvial sand Ds stratum exists. All of these layers act as drainage layers. The soft deposit varies in thickness from 20-25 m.
2.2 Basic index and engineering properties
The basic properties of the soft cohesive soils deposited along the Saga airport highway (section A, B, and C) are summarised in Table 1. Here, the general values of physical and mechanical properties of Ariake clay are also listed for comparison.
In order to evaluate part of the settlement induced by traffic loading, the typical geotechnical profiles (physical and engineering properties) of section A, station No. 221, are described as follows.
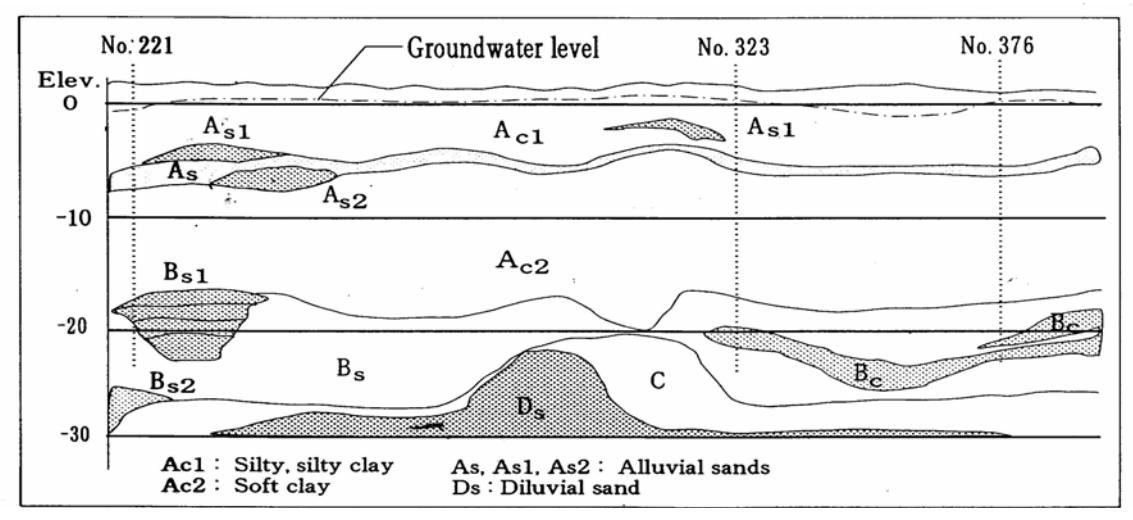
Figure 4. Geological profiles of Saga airport highway
Table 1. Geotechnical properties of soft cohesive deposit in the Saga airport highway
| Soil properties | Ariake clay | Saga airport highway | ||
|---|---|---|---|---|
| No.221 | No.323 | No.376 | ||
| ·(A) | (B) | (C) | ||
| Sampling depth, m | 2.5-12.8 | 3.5-11.8 | 2.0-10.8 | |
| Physical properties: | ||||
| Natural water content, ωn(%) | 50-200 | 83-99 | 93-110 | 76-101 |
| Density of soil particles, ρs(kN/m3) | 25.6-2.76 | 26.5-27.9 | 26.3-26.9 | 26.3-26.9 |
| Wet density, γt (kN/m3) | 14.1-1.59 | |||
| Initial void ratio, eo | 1.05-4.53 | 2.05-3.41 | 2.25-3.25 | 2.10-3.30 |
| Liquid limit, ωL(%) | 28-112 | 67-105 33-49 | 70-83 27-35 | 63-105 34-46 |
| Plastic limit, \(\omega_P(\%)\) | 24-59 | 33-49 | 40-57 | 18-59 |
| Plasticity index, Ip(%) Clay contents (d<5µm), (%) | 11-78 | 33-01 | -40-37 | 16-39 |
| Clay contents (d \Spair), (70) | 11.0 | |||
| Mechanical properties: | ||||
| Friction angle, \( \phi'(\text{deg.}) \) | - | - | 27-33 | 33-37 |
| Yield stress, σv'(kPa) | - | 45-90 | 65-95 | 40-85 |
| Compression index, Cc | 0.37-1.86 | 0.77-1.80 | 0.83-1.14 | 0.97-1.56 |
| Consolidation coefficient, cx(10-8m2/sec) | 40.5-172 | 8.1-92.6 | 11.6-80.9 | 8.1-104.1 |
| Soil compressibility, mv(10-3m2/kN) | - | 0.7-2.5 | 1.0-2.0 1.25-1.35 | 0.8-2.5 1.35-1.50 |
| Slope of Critical State Line, M Soil elasticity, E50(kPa) | 1 [ | 10-55 | 1.33-1.30 | |
| Bon clasticity, L50(Ki a) | 10-55 | 12-50 | ||
2.2.1 Physical properties
The physical properties of subground for various depths are shown in Figure 5. Grain size distribution reveals that the silt fraction is predominant instead of the clay fraction except at a depth of 7.5 to 8.5 m, where a thin sand layer exists. The plastic and liquid limits vary linearly with depth and their magnitudes decrease with depth. The natural water contents are much higher than their corresponding liquid limits and decrease with an increase in depth. This reflects one of the specific features of Ariake clay. The void ratio at yield stress decreases with depth and associated with changes in the natural water content of the deposit.
2.2.2 Mechanical properties
The variations in the mechanical properties of the subground with depth are shown in Figure 6. From consolidation test results that show variations of yield stress σy' and effective overburden stress σvo' with depth, the upper soft deposit was found to be a slightly over consolidated state with OCR (Over Consolidation Ratio) ranging from 1.5 to 2.5. A comparison of the test results observed before and after three years of the road was opened to traffics indicates that the OCR values increase depending on the depth of the deposit, i.e., they are higher at the adjacent view meter below the pavement. In this case, the effects of long-term traffic loading are considered to be attributed to the consolidation of the subground. This finding is similar to that reported by Fujikawa [1996]
Compression index Cc of the deposit was obtained in a range between 0.4 and 1.4 as shown Figure 6. Its characteristic is that a linear variation decreases with depth. A similar tendency was also observed for the characteristics of soil compressibility in a range of 2.5x10⁻⁴ to 2.5x0-3 m2 /kN. The values of soil permeability have an opposite tendency that they slightly increase with depth and vary in a range of 3.5x10⁻⁹ to 9.5x10⁻⁹ m/sec. A comparison between the present values of soil permeability (silty clay) and the general values of soil permeability for Ariake clay reveals that the soil permeability of the silty clay is 3 to 5 times higher than that of the clay. Unconfined compressive strength and the elasticity of the deposit show a similar tendency, they increase linearly with depth. Most of the samples attained maximum shearing resistance at about 3% to 7% of axial strain.
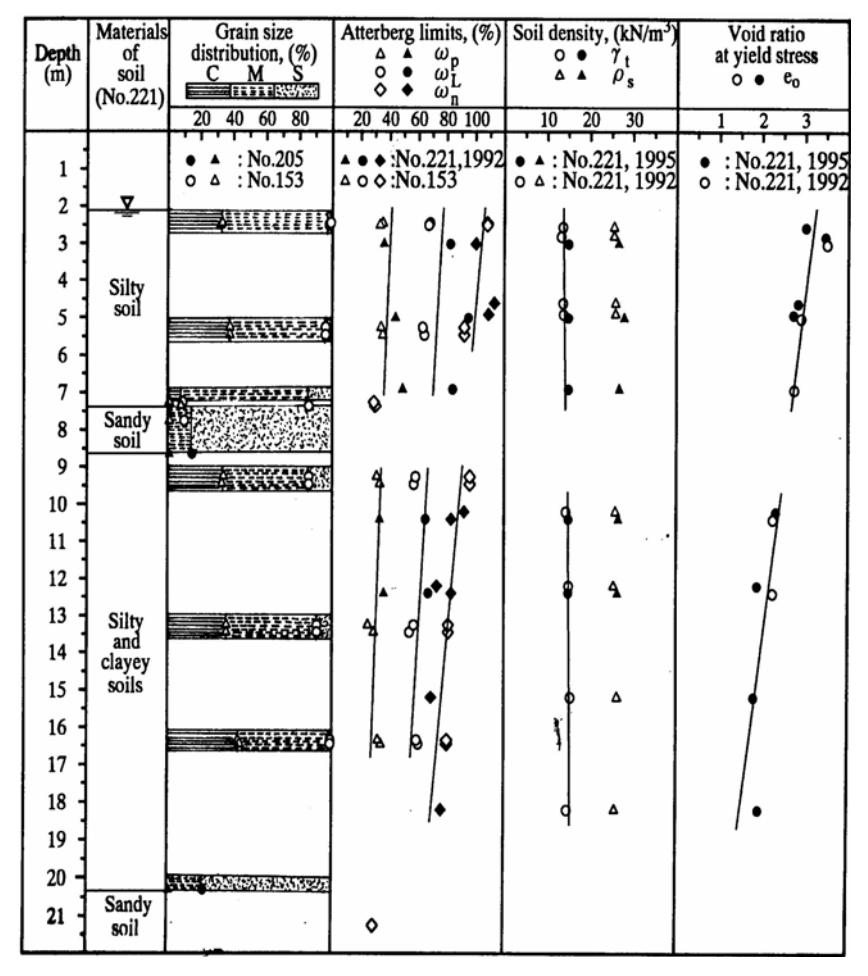
Figure 5. Physical properties of subground for various depths in section A, station No. 21
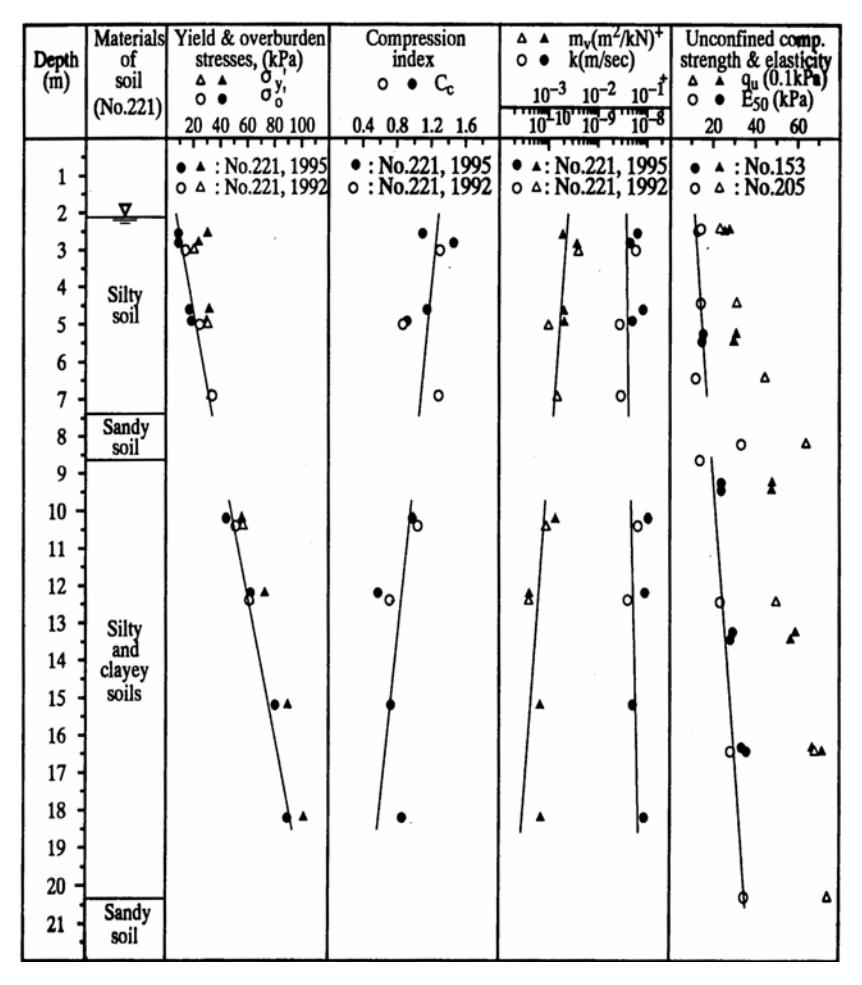
Figure 6. Engineering properties of subground for various depth in section A, station No. 221
2.3 Compressibility and undrained static characteristics
Typical responses of e-log(p') curves obtained from oedometer tests for various sampling depths are shown in Figure 12(a), where consolidation effective stress p' represents as p'=1/3*(σ1'+2σ3'). Specimens from a depth of 5 m show an e-log(p') curve that is shifting downward with an initial void ratio of around 2. This appears to be due to specimens are dominated by sand fraction. In general, the specimens sampled from upper layers with depths of less than 7 m show e-log(p') curves that are higher than those of the samples obtained from deeper layers. The characteristics of curves in e-log(p') relationship are almost parallel each other. The characteristics of soil compressibility mv versus p', in a logarithmic plot, as shown in Figure 7(b) reveal that the values of mv vary in a wider range when p'<100 kPa. Figure 7(c) shows the relationship between the coefficient of consolidation cv and consolidation effective stress p', indicating that the cv values obtained from lower deposit (7m depth or higher) are almost constant for any applied pressure p' levels. Specimens sampled from upper deposit show a higher cv values when applied pressure p' was less than 100 kPa.
As for the accuracy of consolidation settlement analysis due to the embankment weight by a modified cam clay model, the undrained static compression behaviour of the subground was also investigated. The test results are shown in Figure 13. The effective stress path is presented in Figure 8(a), showing that the undrained paths shifted to the left lead to a failure envelope with critical state parameter M=1.33. Figure 8(b) shows the stress strain relationships and the curves that characterize hardening behaviour. The positive excess pore pressures gradually increase toward the static failure mode and their magnitudes are higher as compared to the static deviator stress q(=σ1'-σ3')
3. Long – Term Measurements of Pavement Highway Settlement
Saga airport highway is a short highway with ±5 km long, and was constructed on soft Ariake deposit for accessing the Saga airport with several cities around the Saga plain. It is shown by a dashed line in Figure 2. To mitigate problems of large differential settlement occurred during and after construction, it has become a part of the project maintenance to monitor the settlement.
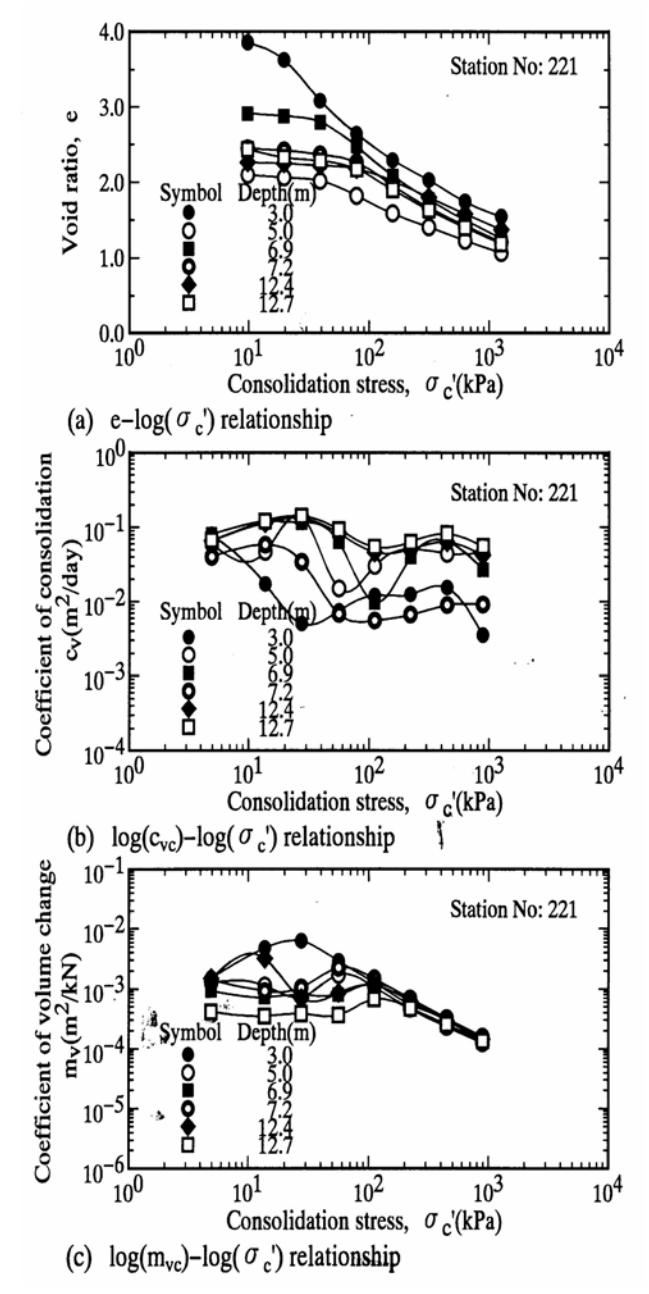
Figure 7. Typical responses of e-log(p), soil compressibility, and coefficient of consolidation in oedometer tests
Based on a road construction sequence of road constructions, the road is divided into three sections: A, B, and C. Settlement measurements were taken at these stations: No. 221 (section A), No. 323 (section B), and No. 376 (section C) as shown in Figure 2. The cross sectional profiles of settlement were observed in the pavement and both sides of the embankment for 50 m. The settlement profiles of the pavement surface along the road sections (A, B, and C) were also monitored.
The road settlement profiles measured at each station, at both cross sectional and longitudinal directions, show a similar deformation pattern. Therefore, in the following sections, only the settlement along section A is discussed in order to illustrate the typical characteristics of the settlement along the Saga airport highway.
3.1 Typical section of pavement structure
The Saga airport highway is a typical low embankment highway in a lowland plain in Japan with a design pavement thickness of 0.8 m, including the subgrade base improved by Fe and lime-stabilized clay. A typical section of the road and the pavement structures is shown in Figure 9. The road pavement was designed for two way traffics with a width 11 m, including 0.6 m width of box type concrete drainage in the left and right sides. Adjacent to the road pavement, 1 m space for plants landscaping and 3.5 m width of non asphalt zones are situated in the left and right sides.
The basic properties of the pavement materials such as: Poisson's ratios and moduli of elasticity are shown in Figure 9, along with the design thickness of the pavement structures. The pavement subgrade was improved by Fe and lime-stabilized clay with a thickness of 0.4 m, below which a replaced material (masado) with 0.3 m thick was situated. The subbase and base of the pavement consist of crashed and graded grain materials with a total thickness of 0.3 m. The pavement surface was an asphalt concrete overlay with 0.1 m thick.
3.2 Measurement of pavement surface settlement
The results of the settlement measured along section A from stations No. 215 to No. 225 for various days are shown in Figure 10. The settlement profiles show a similar pattern and gradually increase with time. It can be seen that pavement surface performance shows a non uniform settlement, and a large differential settlement took place in between the two box culverts that were supported by end bearing piles. On the other hand, the differential settlement that was measured on the top of the box culverts remained very small. The characteristics of settlement measured in station No. 221 will be discussed in detail.
3.2.1 Factors affecting settlement profiles
Most of the field circumstances show a separation in the interface between the box culvert and back fill. This caused a sudden big jump in the road surfaces. Consequently, a dynamic impact on the pavement surface may occur when drivers who are approaching the box culvert suddenly reduce their vehicles velocity.
When the drivers again force the velocities of their vehicles just after crossing the box culverts, the highest velocities will be in the central part of the road segment between the two box culverts. Therefore, this dynamic effect is considered to be one of the reasons why the largest differential settlement was observed in station No. 221, as shown in Figure 10.
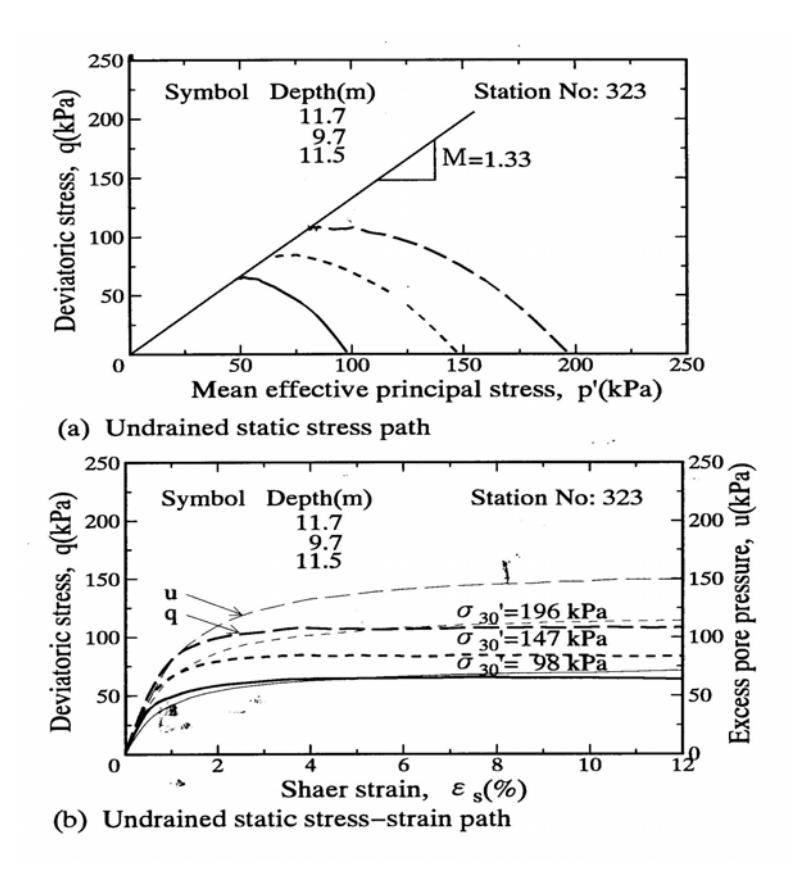
Figure 8. Typical responses of undrained static behaviour of subground in triaxial compression tests
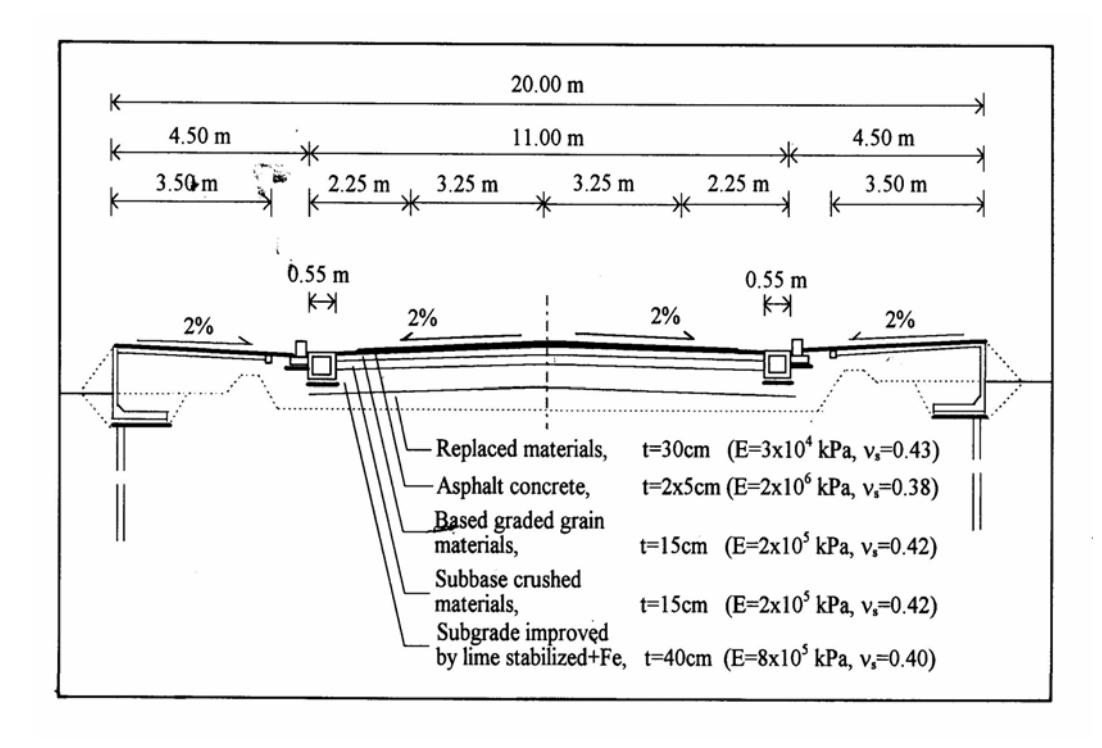
Figure 9. Typical section of road section and pavement structures
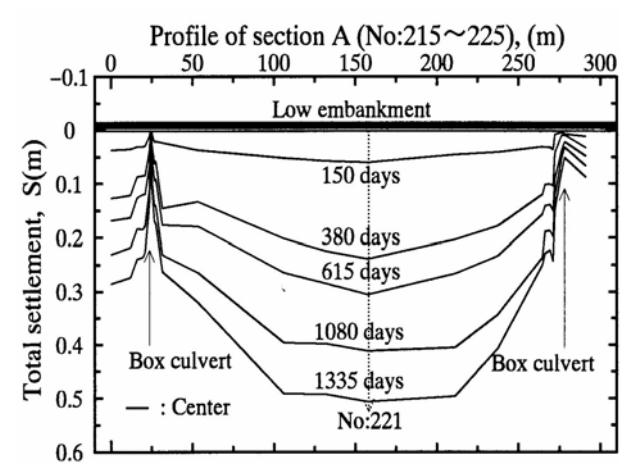
Figure 10. Settlement profiles measured in the road section A, station No. 215 to No. 225
A dynamic impact on the subground stress induced by traffic loading founded on a clay foundation has also been investigated and modelled by Hyodo et al. [1988] as a function of vehicle velocity. The problems of non uniform and large settlement on soft foundations can also result from soft spots in the subground, the insufficient compaction of base materials, and subsidence due to fluctuation in groundwater levels [Miura et al., 1988].
3.2.2 Settlement curves with time in section No. 221
The settlement curves versus elapsed time in station No. 221 are presented in Figure 11. The curves show that during the construction period from May to October 1992 (150 days), settlement took place around 0.1 m. Within a few days of the road section was opened to traffics, the settlement suddenly increased. After this, settlement gradually decreased in small increments of around 970 days.
As for regular road maintenance, the pavement surface was reoverlayed with an additional thickness of 0.1 m around 2 years (970 days) after the road was opened to traffics. The settlement rate (Figure 11) developed slightly after pavement reoverlay completion. Pavement surface settlements were observed in the left and right sides of the road, where the traffics passed. The results were obtained to be higher as compared to that of the settlement observed in the centre of the embankment.
3.2.3 Settlement profiles in section No. 221
Figure 12 shows the settlement profiles in station No. 221 for various days. Settlement was observed around 50 m to the right and left of the centre of the pavement. It is clear that the settlement profiles are not very significant when the distances from the centre of the embankment are higher than 25 m. It seems that most of the settlement profiles have peaks in the central part of the pavement.
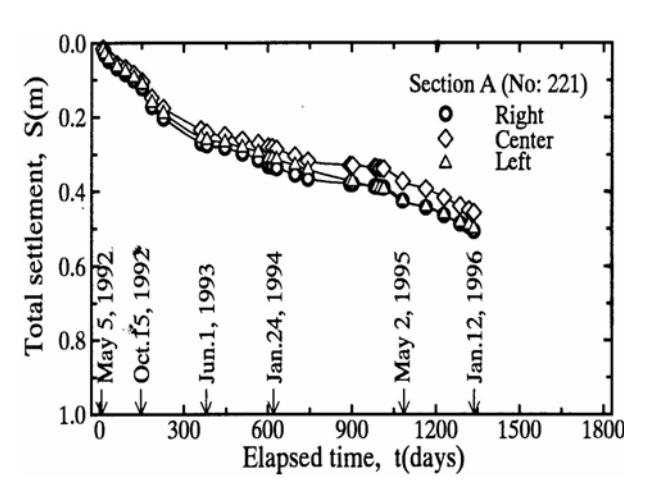
Figure 11. Settlement curves measured in station No. 221 versus elapsed time
3.3 Settlement induced by traffic loading
Ground subsidence in the Saga plain [Miura et al., 1988] around the site of the Saga airport highway is presented in Figure 13. The trends show that the curves of ground subsidence have been in small increments in the last three years (1988-1991). Thus, the effects of ground subsidence due to the drawdown of the groundwater table on the measurements of the Saga airport highway (station No. 221) are negligible.
To examine settlement induced by traffic loading, it was assumed that the total settlement in station No. 221 (Figure 11) mainly accumulated from consolidation settlement due to embankment weight and traffic load induced settlement. As for an estimation of traffic load induced settlement, a consolidation analysis by FEM using a modified cam clay model was conducted [Samang et al., 2005], the calculated settlement curves due to embankment weight are plotted in Figure 14 and are compared with the total settlement measured.
From the geotechnical profiles of the subground (Figure 5 and 6) it was clear that a thin sand layer around 7.5 to 8.5 m below the pavement surface is deposited. To discuss the effects of this sand layer on the settlement, two cases of boundary conditions were used in the analysis, i.e.: (a) without a sand layer and (b) with a sand layer. The results of analysis are shown in Figure 14. The settlement curves reveal that the calculated curves were overestimated during road construction (1 to 150 days). This was caused by the complexities of the loading stages during road construction.
Subtracting the two curves for cases (a) without and (b) with the consideration of a sand layer, the approximate magnitudes of settlement induced by traffic loading are obtained. Figure 14(a) shows that, without a sand layer, the traffic loading effect can
induce settlement that is around 35% of the total settlement at 1350 days. However, in case of with a sand layer (Figure 14(b)), its contribution can be as much as 20% of the total observed settlement (1350 days). The subground conditions in the site are represented by case (b). Finally, it can be concluded that consolidation settlement due to embankment weight is predominant rather than that of settlement induced by traffic loading. It can be approximated that the traffic load induced settlement is around 20% of the total settlement, 3 years after the road was opened to traffic. It seems that this practical method provides a useful tool for evaluating time dependent responses of this typical soft foundation settlement as partially drained behavior due to traffic loading.
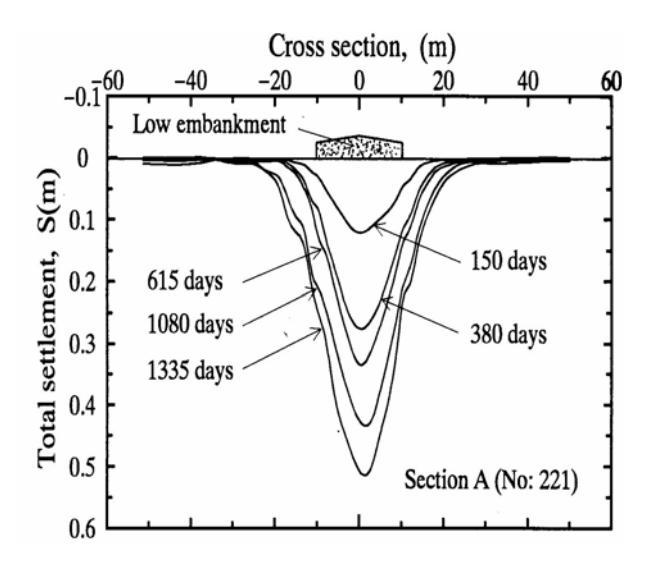
Figure 12. Cross sectional profiles of settlement measured in station No. 221 for various days
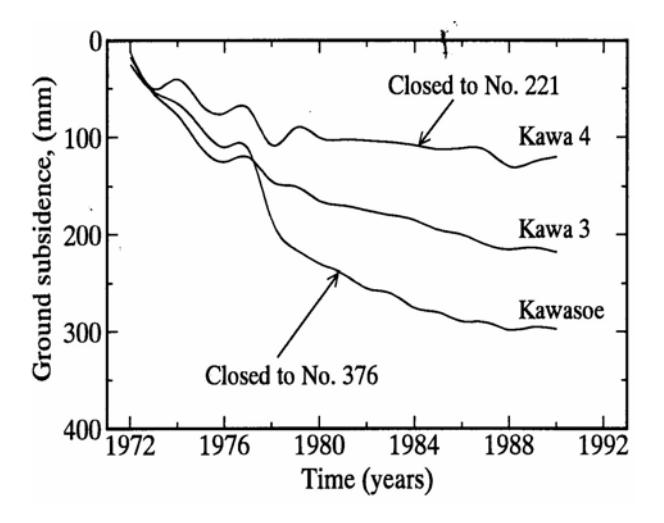
Figure 13. Land subsidence in Saga plain around the site of Saga airport highway
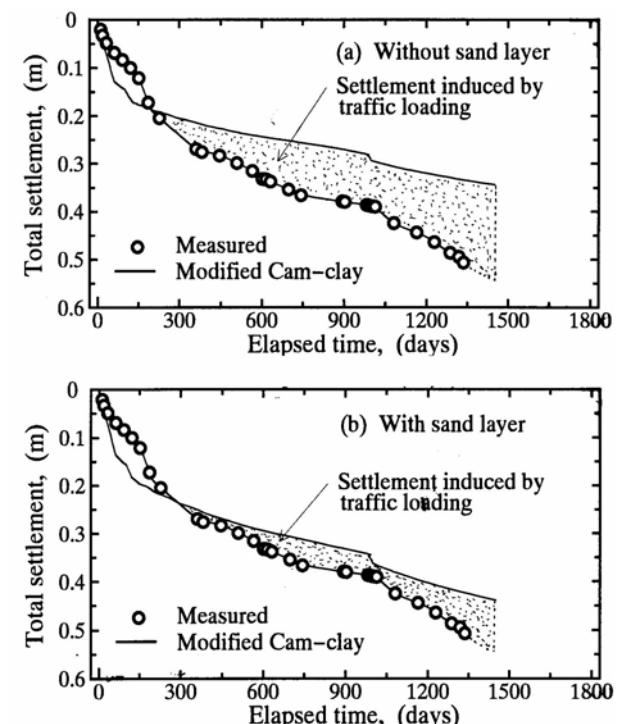
Figure 14. Estimation of settlement induced by traffic loading in station No. 221
4. Conclusions
The field measurements of traffic load induced settlement of pavement surface in Saga airport highway were presented. In addition, the subground characteristics were discussed in associated with their typical properties. The basic findings are summarised as follows.
The geotechnical properties along the access road to the Saga airport are characterized as soft alluvial deposit of three layers varies in thickness from 20 to 25 m. Several thin sand layers were randomly deposited, all of these layers acted as drainage layers. The top layer of soft deposit around 6 m thick was deposited by silty soil, below which the soft silty to clayey soils existed.
These soft cohesive soils have difficult properties such as: very soft, highly sensitive, highly compressible, and low bearing capacity. The natural water contents are much higher than their corresponding liquid limits. The permeability of the silty clay is approximated 3 to 5 times that of the soil permeability of the Ariake clay in general.
The settlement profiles along the Saga airport highway showed a non uniform settlement. Large differential settlement occurred in between the two box culverts supported by end bearing piles. A dynamic impact is considered as one factor affecting the large observed settlement in the central part of the road section between the two box culverts.
The total observed settlement was around 0.5 m after 3 years open for traffic; it was mainly accumulated from consolidation settlement due to embankment weight. Settlement induced by traffic loading is approximately around 20% of the total settlement, three to four years after the road was opened to traffic.