
Abstrak
Dalam rangka pengembangan korelasi antara tahanan konus \(q_c\) dan kecepatan rambat gelombang geser \(V_s\)untuk tanah Indonesia, hasil dari uji sondir mekanik dan uji seismic downhole dari daerah Depok, Jawa Barat dikumpulkan dan dianalisis. Tanah dari lokasi pengujian adalah tanah lanau-lempung. Hasil dari kedua jenis pengujian digunakan untuk mengembangkan korelasi antara q dan V. Korelasi tersebut kemudian dibandingkan dengan korelasi sejenis dari beberapa negara.
Kata-kata Kunci: Kecepatan rambat gelombang geser, uji sondir, tahanan konus.
1. Introduction
The shear wave velocity of soils plays an important role in the design of geotechnical structures under dynamic loads. It is used mostly for determining the seismic site categories (e.g., BSN, 2002) and for an initial reference value for large strain problems related to seismic loading. In Indonesia, the shear wave velocity is typically measured using the seismic downhole test. However, the equipment is not widely available and, consequently, the test is generally too expensive to perform for most construction projects. On the other hand, mechanical cone penetration tests are the most common in-situ test because it is lightweight and easy to perform.
No direct cone penetration resistance q<sub>c</sub> and shear wave velocity V<sub>s</sub> correlations of soils from Indonesia are currently available. Furthermore, unlike correlations for standard penetration test results N-SPT and \(V_s\), the available direct \(q_c - V_s\) correlations from other countries are limited (Andrus et al., 2003; Madiai and Simone, 2004; and Sun et al., 2008). Therefore, it is of interest to develop a q<sub>c</sub> - V<sub>s</sub> correlation of soils from Indonesia. To initiate this development, \(q_c\) and \(V_s\) data from the University of Indonesia complex in Depok, West Java are analyzed. In this paper, the database of the two parameters and the analysis conducted are described, followed by a discussion on the proposed correlation and on the comparison of q<sub>c</sub> - V<sub>s</sub> correla-
2. Test Program
The test program considered in this study consisted of three locations (A, B, and C), with one mechanical cone penetration test (CPT) and one seismic downhole test (SDHT) conducted at each location. The locations were within the University of Indonesia complex in Depok, West Java. The distance between locations A and C was about 250 m, while the distance between locations B and C was about 180 m.
The mechanical CPTs were conducted in accordance with ASTM D3441 (2008). The cone with an apex angle of 60° is 10 cm<sup>2</sup> in cross-sectional area and has a 150 cm<sup>2</sup> friction sleeve. The cone penetration resistance q<sub>c</sub> and the associated friction ratio R<sub>f</sub> readings and calculations were taken and performed at 0.2 m interval. The Robertson (1990) procedure was modified to further interpret the CPT results; the normalized cone resistance O and the normalized friction ratio F respectively are given by the following:
\[Q = (q_c - s_v) / s'_v\] (1)
\[F = f_s / (q_c - s_v)\] (2)
in which σv = total vertical stress and σ'v = effective vertical stress, and fs = sleeve friction.
The seismic downhole tests were conducted using OYO Borehole Pick Model 3315 and McSeis–SX 48 Model 1126C. The shear wave velocity was measured at 1.0 m interval.
3. Test Results
3.1 Location A
The cone penetration resistance qc and the friction ratio Rf of the cone penetration test (CPT) for Location A are shown in Figure 1. The normalized cone resistance Q and the normalized friction ratio F are also shown in Figure 1. The shear wave velocity Vs from the seismic down-hole test (SDHT) in an adjacent deep boring is shown in Figure 1 as well. Based on the results, three geomaterial layers can be identified: c depth = 0 – 3.0 m, d depth = 3.0 – 7.0 m, e depth = 7.0 – 18.0 m, and f depth = >18.0 m. In addition, the groundwater table in the deep boring was found at a depth of 6.2 m.
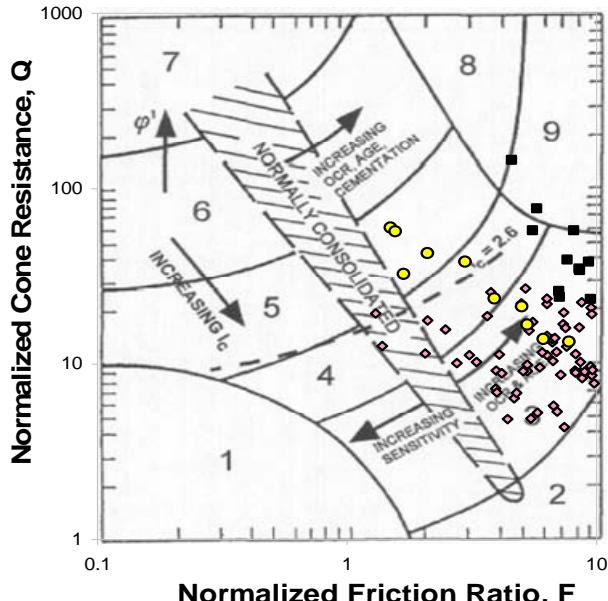
The Robertson (1990) procedure was used to further interpret the CPT results of the four layers. As shown in Figure 2, the first layer is predominantly in Zone 3 (clay to silty clay) with higher overconsolidation ratio (OCR), the second layer is predominantly in Zone 4 (clayey silt to silty clay), the third layer is predominantly in Zone 3 with lower OCR, and the fourth layer is predominantly in the Zone 4 and Zone 5 (silty sand to sandy silt) with relatively low OCR. It is noted that the particle size analysis (ASTM, 2002) of an undisturbed sample from depth of 5.5 – 6.0 m resulted in clay = 24%, silt = 75%, sand = 1%, while that of an undisturbed sample from depth of 14.0 – 14.5 m resulted in clay = 23%, silt = 76%, sand = 1%.
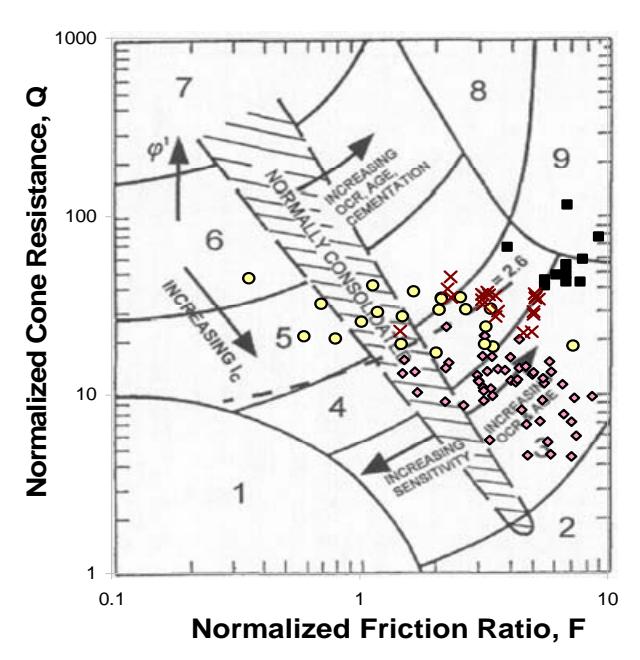
Figure 2. Q-F analysis for Location A (■: 0-3.0 m, ×: 3.0-7.0m, ◊: 7.0-18.0m, {: >18.0m)
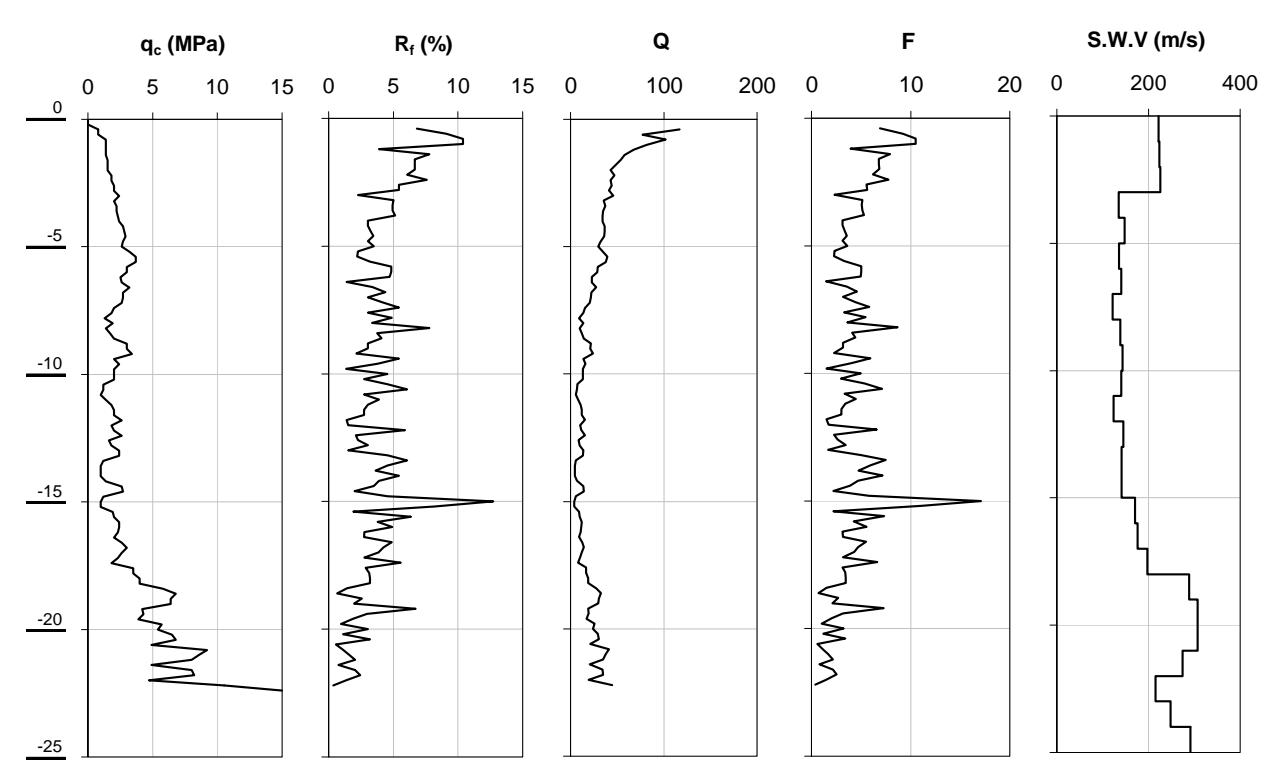
Figure 1. Mechanical CPT and SDHT results for Location A
3.2 Location B
The qc and Rf profiles of the CPT for Location B are shown in Figure 3. The Q and F profiles are also shown in Figure 3. The Vs from the SDHT in the adjacent deep boring is shown in Figure 3 as well. Based on the results, three geomaterial layers can be identified: c depth = 0 – 3.0 m, d depth = 3.0 – 7.5 m, e depth = 7.5 – 20.0 m, and f depth >20.0 m. In addition, the groundwater table was found at a depth of 9.1 m.
Based on the Robertson (1990) procedure shown as Figure 4, the first through the third layers are predominantly in Zone 3 (silty clay to clay) with decreasing OCR, and the fourth layer is predominantly in the Zone 4 (clayey silt to silty clay) and Zone 5 (silty sand to sandy silt) with relatively low OCR. It is noted that the particle size analysis (ASTM 2002) of an undisturbed sample from depth of 1.5 – 2.0 m resulted in clay = 23%, silt = 75%, sand = 2%, that of an undisturbed sample from depth of 8.5 – 9.0 m resulted in clay = 25%, silt = 74%, sand = 1%, and that of an undisturbed sample from depth of 17.0 – 17.5 m resulted in clay = 23%, silt = 76%, sand = 1%.
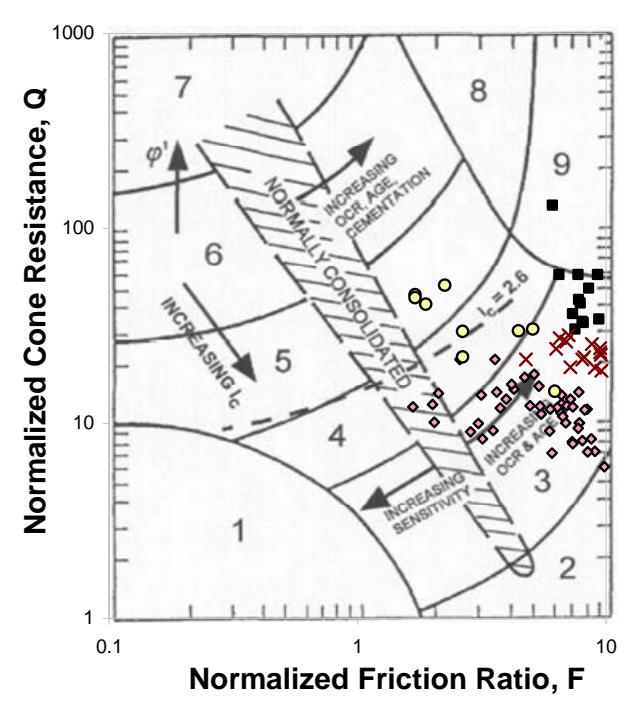
Figure 4. Q-F analysis for Location B (■: 0-3 m, ×: 3.0-7.5m, ◊: 7.5-20.0m, {: >20m)
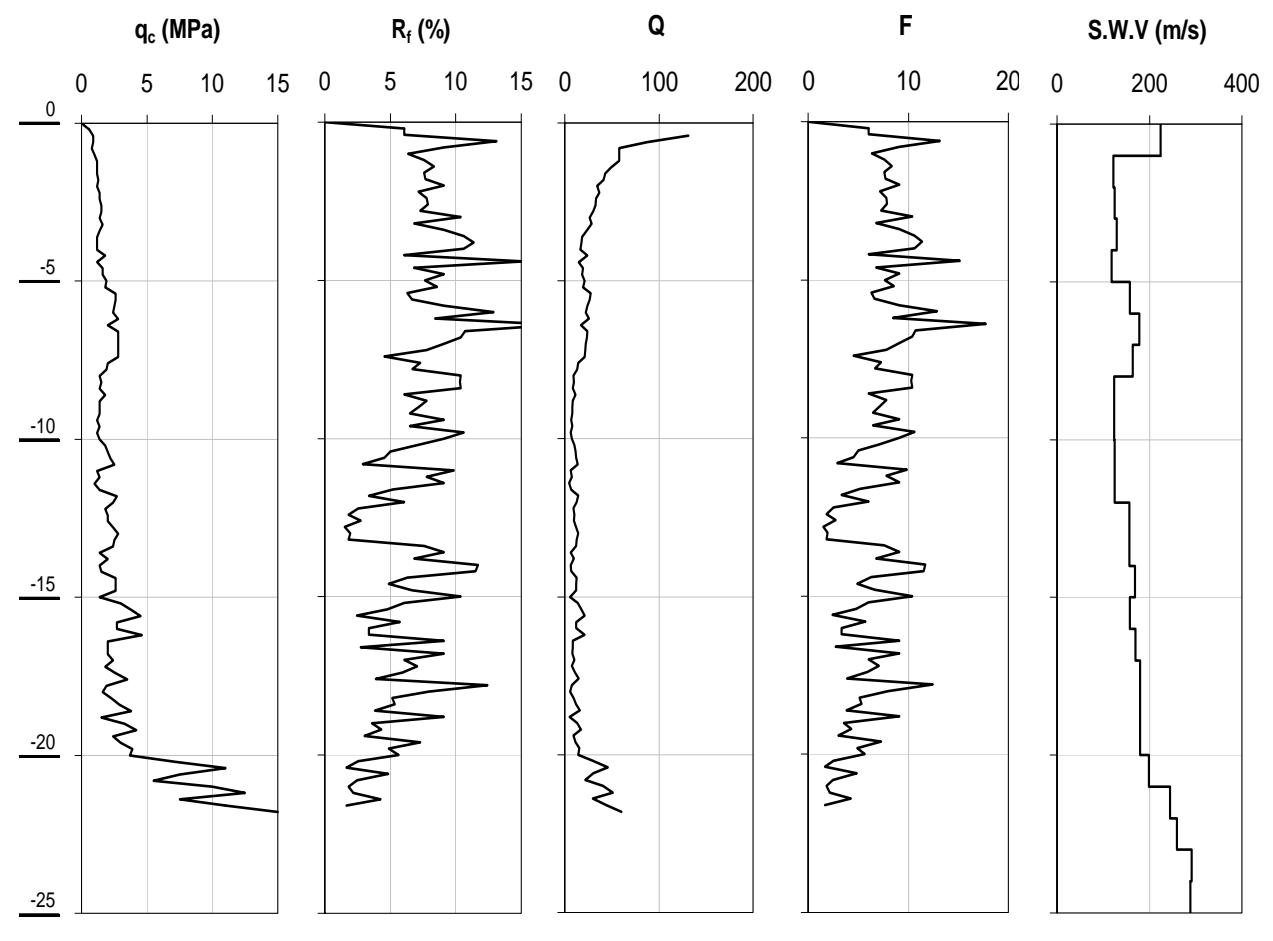
Figure 3. Mechanical CPT and SDHT results for Location B
3.3 Location C
The qc and Rf profiles of the CPT for Location C are shown in Figure 5. The Q and F profiles are also shown in Figure 5. The Vs from the SDHT in the adjacent deep boring is shown in Figure 5 as well. Based on the results, three geomaterial layers can be identified: c depth = 0 – 3.0 m, d depth = 3.0 – 19.0 m, and e depth >19.0 m. In addition, the groundwater table was found at a depth of 6.2 m.
Based on the Robertson (1990) procedure shown as Figure 6, the first and the second layers are predominantly in Zone 3 (silty clay to clay) with decreasing OCR, and the third layer varies between Zone 3 and Zone 5 (silty sand to sandy silt). It is noted that the particle size analysis (ASTM 2002) of an undisturbed sample from depth of 3.0 – 3.5 m resulted in clay = 23%, silt = 75%, sand = 2%, while that of an undisturbed sample from depth of 10.0 – 10.5 m resulted in clay = 23%, silt = 73%, sand = 4%.
4. Correlation Development and Discussion
A simple regression analysis was performed, taking the shear wave velocity Vs as the dependent parameter and the cone penetration resistance qc as the independent parameter. As the qc and Vs were determined at different intervals, five qc values had to be averaged for the associated depth of Vs value. It is noted that the upper 3.0 m of Vs values at Location A, the upper 1.0 m of Vs values of Location B, and the upper 2.0 m of Vs values of Location C were not included in the analysis, as they appeared to be unusually high for relatively low qc values.
Figure 7a compares qc and Vs data for different materials based on the Robertson (1990) criteria. It can be observed that all data cluster in the same general range, and it can be concluded therefore that material types would not have a significant effect on the correlation.
Normalized Friction Ratio, F Figure 6. Q-F analysis for Location C (■: 0-3 m, ◊: 3.0-19.0m, {: >19m)
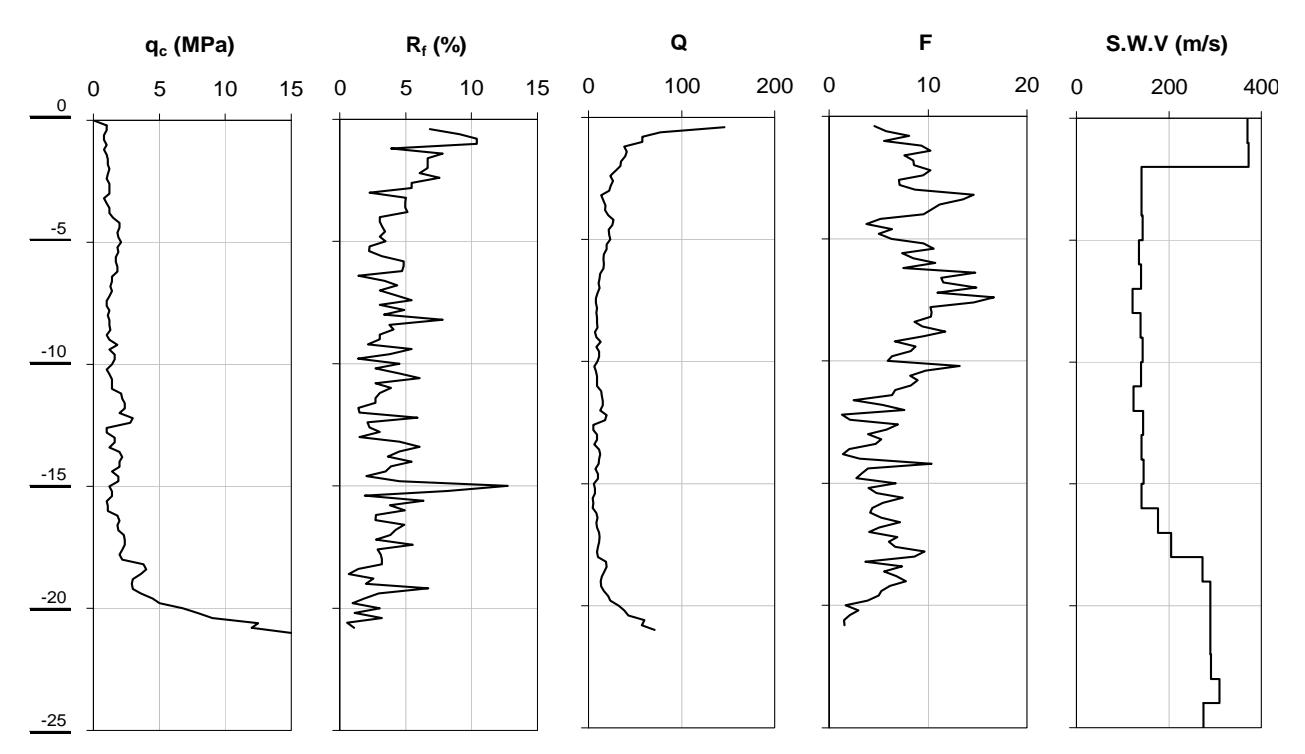
Figure 5. Mechanical CPT and SDHT results for Location C
a) Effect of material types and initial correlation
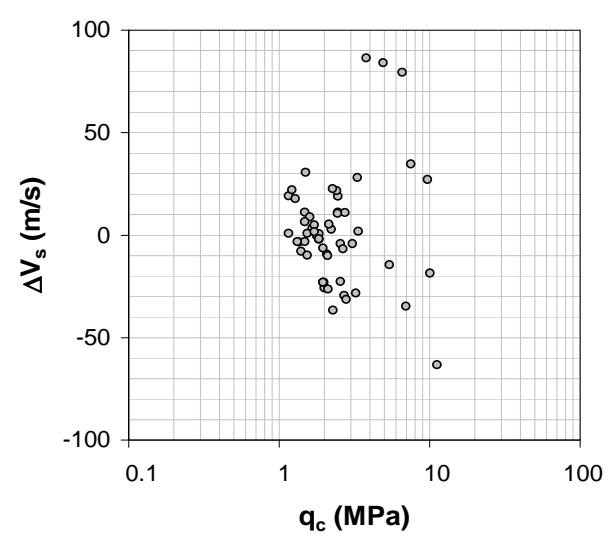
b) Distribution of V<sub>s</sub> deviation
Figure 7. Effect of material types (Materials: O- Zone 3, □- Zone 4, ◊- Zone 5) and results of initial analysis
Figure 7a also shows the initial \(q_c - V_s\) correlation equation based on 56 data points. The distribution of the V<sub>s</sub> deviation from this initial correlation equation is shown as Figure 7b, and the standard error is 27.39 m/ s. There are four data points that deviate significantly (> 60 m/s), and these data points are considered as outliers in the further analysis.
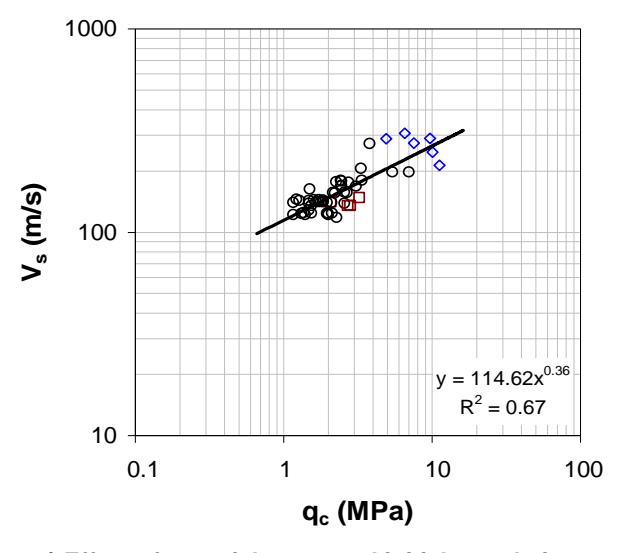
Based on the select V<sub>s</sub> and q<sub>c</sub> data, the following correlation has been derived for the Depok silt-clay:
\[V_{s} = 115.70 (q_{c})^{0.34}\] (3)
in which V<sub>s</sub> in m/s and q<sub>c</sub> in MPa, and the standard error is 18.16 m/s. Note that the number of data is 52 and the r<sup>2</sup> value is 0.69. The data and the regression line and equation are shown in Figure 9, while the distribution of the V<sub>s</sub> deviation from the preposed correlation equation is shown as Figure 10.
The correlation above is compared with similar correlations from other countries. It is noted that direct \(q_c - V_s\)correlations for clayey materials are limited. Andrus et al. (2003) proposed the following correlation for clayey holocene soils from the USA (South Carolina and California), Canada, and Japan:
\[V_s = 6.21 (q_c)^{0.444} (4)\] in which \(q_c\) in kPa (n = 31, \(r^2\) = 0.83). Madiai and Simone (2004) proposed the following correlation for some clayey soils from Italy:
\[V_s = 211.2 (q_c)^{0.231}\] (5)
in which \(q_c\) in MPa (n = 46, \(r^2\) = 0.871). Sun et al. (2008) proposed the following correlation for some clayey soils from South Korea:
\[V_{s} = 17.84 (q_{c})^{0.301}\] (6)
in which \(q_c\) in kPa (\(r^2 = 0.741\)). In addition, Mayne and Rix (in Mayne, 2007) developed a clayey soil database for the \(q_t - V_s\) correlation. Although their database is a qt database, but this database can be used to compare the above-groundwater-table data.
The comparison is shown as Figure 11. It can observed that the present \(q_c - V_s\) data and the associated correlation equation are slightly lower than the correlation proposed by Andrus et al. (2003) for \(q_c < 2\)MPa and are slightly lower than the correlation proposed by Sun et al. (2008) for \(q_c > 2\) MPa. However, the present data and correlation equation appear to be in the lower bound of the Mayne and Rix's database (in Mayne, 2007) and are significantly lower than the correlation proposed by Madiai and Simone (2004).
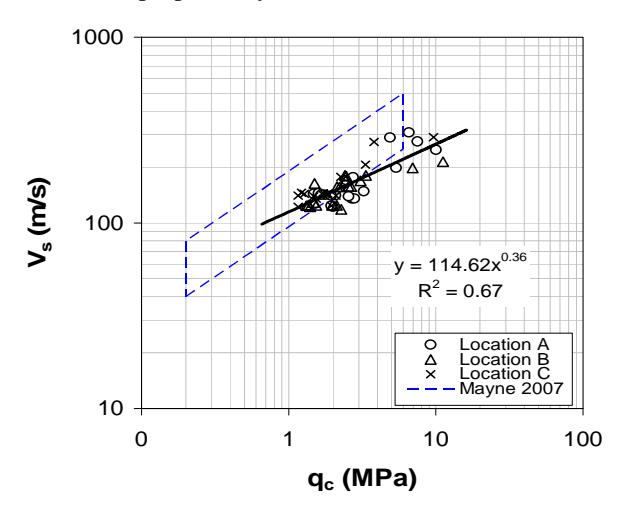
Figure 8. Correlation between Vs and qc for Depok silt-clay
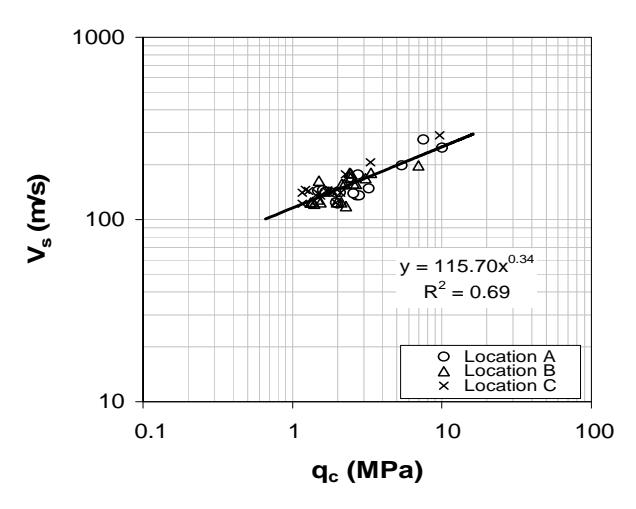
Figure 9. Correlation between Vs and qc for Depok silt-clay
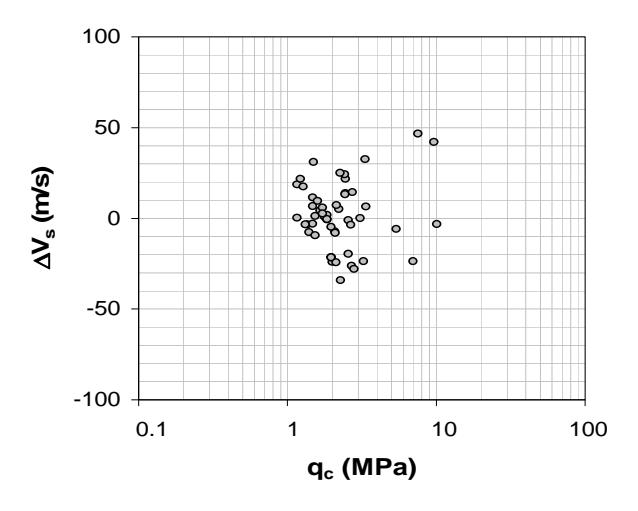
Figure 10. Deviation of V<sub>s</sub> from proposed correlation equation
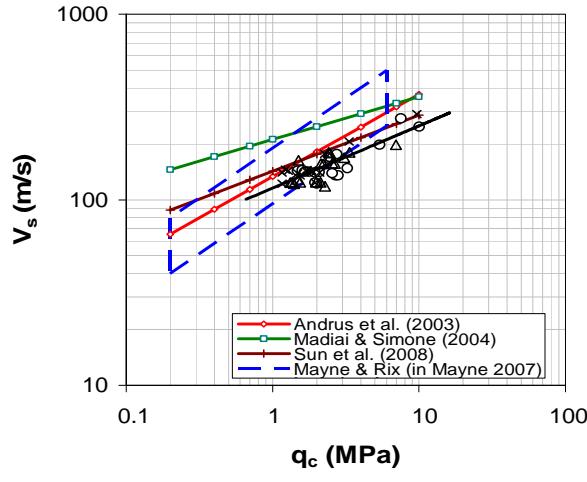
Figure 11. Comparison of present correlation to correlations from other countries
5. Conclusions
- Cone penetration resistance q<sub>c</sub> data obtained from mechanical CPTs and shear wave velocity V<sub>s</sub> data obtained from seismic downhole tests from three locations within the University of Indonesia complex in Depok were evaluated.
- 2. The materials were predominantly silt-clay, determined using the Robertson's criteria and confirmed by particle size analysis results.
- 3. Based on the results, a site-specific trend that correlates measured \(q_c\) to \(V_s\) for Depok silt-clay materials was developed.
- The proposed correlation between V<sub>s</sub> and q<sub>c</sub> can be used for rough estimates of V<sub>s</sub> from q<sub>c</sub>, particularly for preliminary studies and/or noncritical projects are under consideration.
- 5. From the comparison to similar correlations from other countries, the proposed correlation appears to be lower bound.