
1. Introduction
The shear-wave velocity of soils plays an important role in the design of geotechnical structures under dynamic loads. It is used mostly for determining the seismic site categories (e.g., BSN 2002) and for an initial reference value for large strain problems related to seismic loading. In Indonesia, the shear-wave velocity is typically measured using the seismic down hole test and multi-channel analysis of surface waves (MASW) test. However, the equipment is not widely available and, consequently, the test is generally too expensive to perform for most construction projects. On the other hand, the standard penetration test method (SPT) is one of the most common in-situ tests because its equipment is widely available and it is easy to perform.
A study to develop correlations among penetration test results and shear-wave velocity for soils from Indonesia is currently being conducted. Prakoso (2010) proposes a correlation between the resistance obtained from cone penetration tests (CPT) and shear-wave velocity. This present paper focuses on the development of a correlation between the resistance obtained from SPT and shear-wave velocity for cemented soils from Jakarta area. The database of the two parameters and the analysis conducted are described, followed by a discussion on the proposed correlation.
2. Test Program
The test program considered in this study was conducted in three locations; in each location a series of standard penetration tests and a series of shear-wave velocity measurements performed using the seismic down hole test method were conducted in one borehole. The locations were in Tanjung Priok area, Universitas Indonesia Depok campus, and MH Thamrin street area.
The SPT was performed in accordance with ASTM D1586 (2008). The SPT was performed by dropping a 623 N, cable-hoisted, donut hammer a distance of 760 mm to impact the top of the sampling rods. The blows required to drive the 51 mm diameter split spoon sampler for each of three 150 mm intervals were counted. The N-SPT value is the sum of the number of blows required to drive the sampler through the second and third intervals.
The seismic downhole tests were performed in accordance with ASTM D7400 (2008). The tests were conducted using 3-component, OYO Borehole Pick Model 3315 geophone and McSeis 24-channel portable engineering seismograph. The shear-wave velocity was measured at 1.0 m interval. The seismic shear-wave was generated using the 28-kgf, T6-6061 aluminium alloy shear-wave source equipped with ground
coupling spikes developed by the Geophysics Laboratory of Universitas Indonesia.
3. Test Results
3.1 Location: Tanjung Priok
The soil descriptions, shear-wave velocity vs, and N-SPT values from the borehole in Tanjung Priok area are shown in Figure 1. Cemented soils were found at depth ranges of 17.0 m to 22.0 m and 25.0 m to 28.0 m. For the first depth range, the vs was interpreted as 384 m/s, and the N-SPT values varied from 60 blows for 230 mm penetration to 60 blows for 70 mm penetration. For the second depth range, the vs was interpreted as 408 m/s, and the N-SPT values varied from 60 blows for 190 mm penetration to 60 blows for 180 mm penetration. Further discussion on this location can be found in Prakoso et al. (2011).
3.2 Location: Universitas Indonesia Depok Campus
The soil descriptions, N-SPT values, and shear-wave velocity vs from the borehole in Universitas Indonesia Depok campus are shown in Figure 2. Cemented soils were found at depth ranges of 19.0 m to 25.0 m and 26.0 m to 30.5 m (end of boring). For the first depth range, the vs was interpreted as 429 m/s, and the N-SPT values varied from 41 blows/0.3m to 60 blows for 190 mm penetration. For the second depth range, the vs was interpreted as 661 m/s, and the N-SPT values varied from 60 blows for 160 mm penetration to 60 blows for 80 mm penetration. Further discussion on this location can be found in Prakoso et al. (2011).
3.3 Location: MH Thamrin Street
The soil descriptions, N-SPT values, and shear-wave velocity vs from the borehole in MH Thamrin street area are shown in Figure 3. Cemented soils were found at a depth range of 25.0 m to 31.0 m. The vs was interpreted as 368 m/s, and the N-SPT values varied from 36 blows/0.3m to 53/0.3m.
4. Correlation Development and Discussion
The database of cemented soils described above consists of only eighteen (18) pairs of shear-wave velocity, vs and N-SPT value. The vs varied from 368 m/s to 661 m/s, and the N-SPT values varied from 36 blows/0.3m to 60 blows for 70 mm penetration; all data are summarized in Table 1. It is noted that, following the approach proposed by Sun et al. (2008), in the case of N-SPT value 60 blows for penetration depth less than 300 mm, the N-SPT values were extrapolated linearly into corresponding 300 mm penetration depth. The database was then compared to the available vs – N-SPT databases and correlations available in the literature; there are only four (4) vs – N-SPT
correlations clearly developed by including N-SPT values greater than 50 blows/0.3 m. Those correlations are as follows:
\[v_s = 97.0 \text{ (N-SPT)}^{0.314}\] [Imai and Tonouchi 1982 for all soils (in Hasancebi and Ulusay 2007)] (1)
\[v_s = 100.5 \text{ (N-SPT)}^{0.290}\]
[Sykora and Stokoe 1983 for sandy soils (in Hasancebi and Ulusay 2007)] (2)
\[v_s = 75.76 \text{ (N-SPT)}^{0.371}\] [Sun et al. 2008 for sandy weathered residual soils] (3)
\[v_s = 107.94 \text{ (N-SPT)}^{0.418}\] [Sun et al. 2008for sandy weathered rocks] (4)
Figure 4a compares the present database to the database of Imai and Tonouchi 1982 (in Hasancebi and Ulusay 2007); both databases are in the same general range. Figure 4b shows the deviation of the present database to the correlation of Imai and Tonouchi 1982 (Equation 1). The present database tends to be greater than their correlation; the mean deviation is 66.9 m/s, and the standard error is 103.9 m/s. Figure 5a compares the present database to the database of Sykora and Stokoe 1983 (in Hasancebi and Ulusay 2007); both databases again are in the same general range. Figure 5b shows the deviation of the present database to the correlation of Sykora and Stokoe 1983 (Equation 2). The present database tends to be greater than their correlation; the mean deviation is 96.3 m/s, and the standard error is 103.9 m/s.
Figure 6a compares the present database to the database of Sun et al. (2008); both databases are in the same general range. Figure 6b shows the deviation of the present database to the correlation for sandy weathered residual soils (Equation 3). The present database tends to be greater than this correlation; the mean deviation is 60.4 m/s. and the standard error is 104.3 m/s. Figure 6c shows the deviation of the present database to the correlation for sandy weathered rocks (Equation 2). The present database tends to be less than this correlation; the mean deviation is -258.1 m/s, and the standard error is 146.4 m/s.
A simple regression analysis was subsequently performed, taking the shear-wave velocity vs as the dependent parameter and the N-SPT values as the independent parameter. As also shown in Figure 7, the following correlation has been derived for cemented soils of Jakarta:
\[v_s = 150.4 \text{ (N-SPT)}^{0.248}\] (5)
in which v<sub>s</sub> in m/s and N-SPT in blows/0.3m, and the standard error is 102.0 m/s. The r<sup>2</sup> value is 0.315; this value is low, suggesting that a better correlation should be developed in the future. In addition to the low r<sup>2</sup> value, it is noted that the two measured parameters are inherently different, and the linear extrapolation approach for the N-SPT value carries an additional uncertainty. In conclusion, the nature of the proposed v<sub>s</sub> - N-SPT correlation is approximate, and it should be used for rough estimates of v<sub>s</sub> for preliminary studies and/or noncritical projects.
The proposed correlation is compared with existing correlations discussed previously. The comparison is shown in Figure 8. It can be observed, based on the limited number of present data, that the proposed correlation is greater than the correlations for soils, but it is less than that for weathered rocks. The r<sup>2</sup> value for Equation 3 and Equation 4 are 0.282 and 0.220, respectively, while that for Equation 1 and Equation 2 is not available.
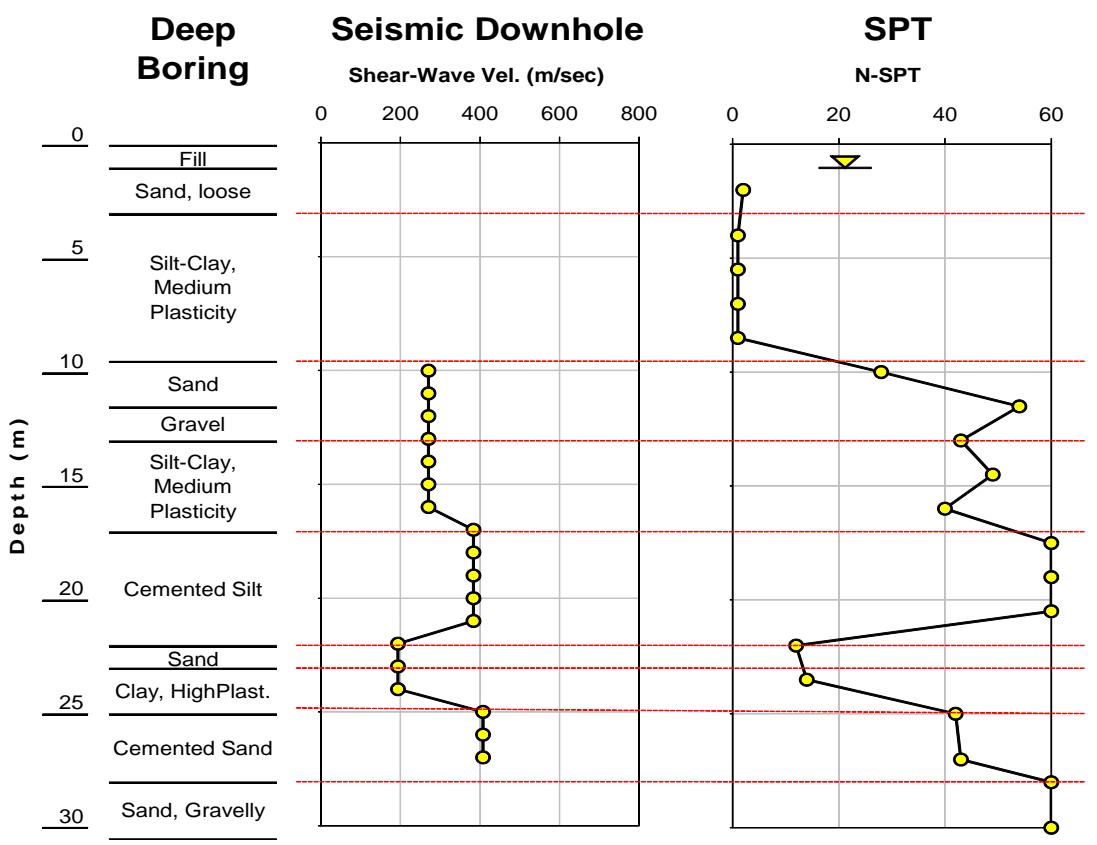
Figure 1. Soil Descriptions, vs., and N-SPT for Tanjung Priok
Table 1. Summary of all data
| Location | Soil Type | Shear-Wave Velocity, vs (m/s) | N-SPT | |
|---|---|---|---|---|
| Actual (blows / penetration depth in mm) | Linearly Extrapolated (blows / 300 mm penetration depth) | |||
| Tanjung Priok | Cemented Silt | 384 | 60 / 210 | 86 |
| 60 / 80 | 257 | |||
| 60 / 230 | 78 | |||
| Cemented | 408 | 60 / 190 | 95 | |
| Sand | 60 / 180 | 100 | ||
| Universitas Indonesia Depok Campus | Cemented Sand | 429 | 41 / 300 | 41 |
| 60 / 240 | 75 | |||
| 60 / 210 | 86 | |||
| 60 / 190 | 95 | |||
| 60 / 200 | 90 | |||
| 60 / 160 | 113 | |||
| Sand-Silt, | 60 / 160 | 113 | ||
| varying degree | 661 | 60 / 90 | 200 | |
| of cementation | 60 / 80 | 225 | ||
| 60 / 160 | 113 | |||
| MH Thamrin Street | Cemented Sand | 368 | 48 / 300 | 48 |
| 53 / 300 | 53 | |||
| 36 / 300 | 56 | |||
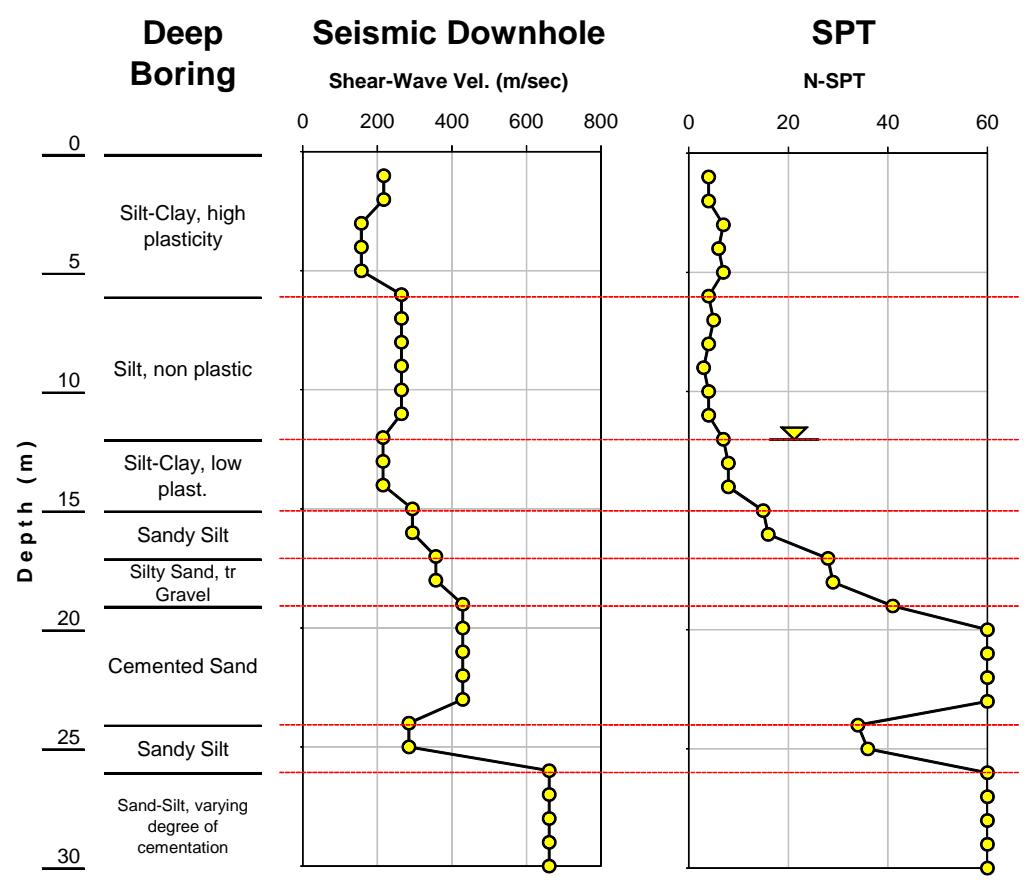
Figure 2. Soil Descriptions, vs, and N-SPT for Universitas Indonesia Depok Campus
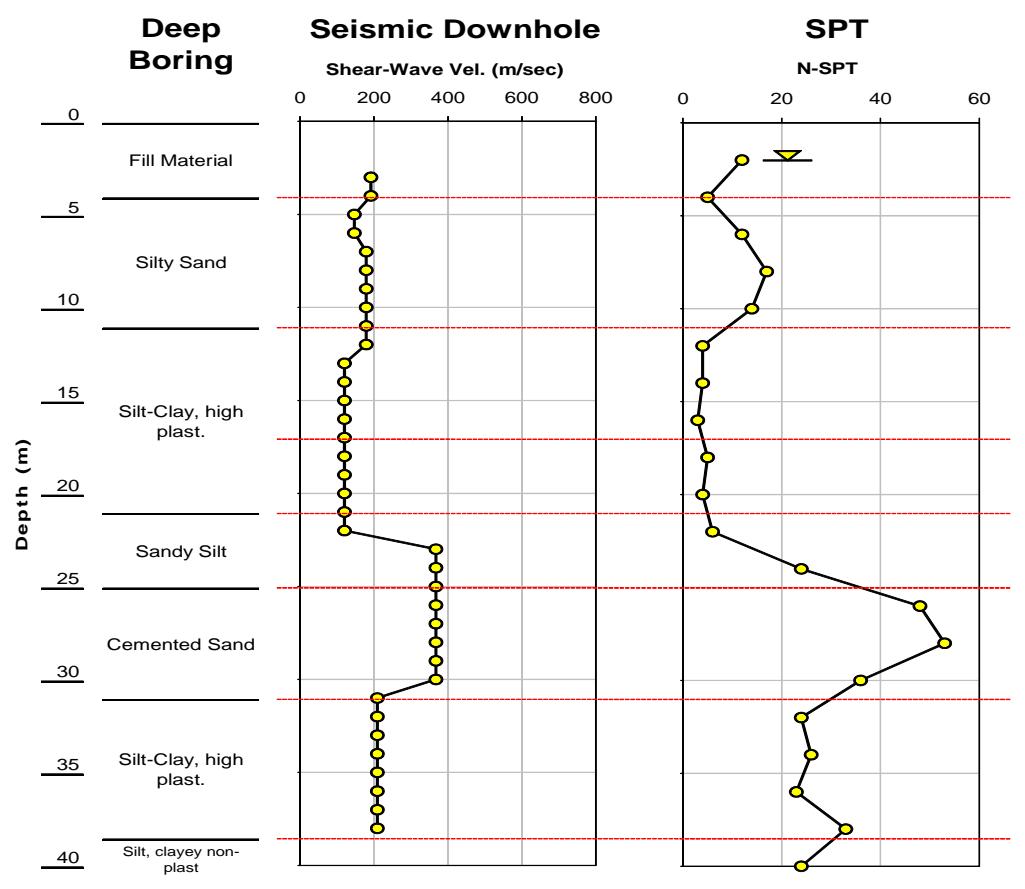
Figure 3. Soil Descriptions, vs, and N-SPT for MH Thamrin Street
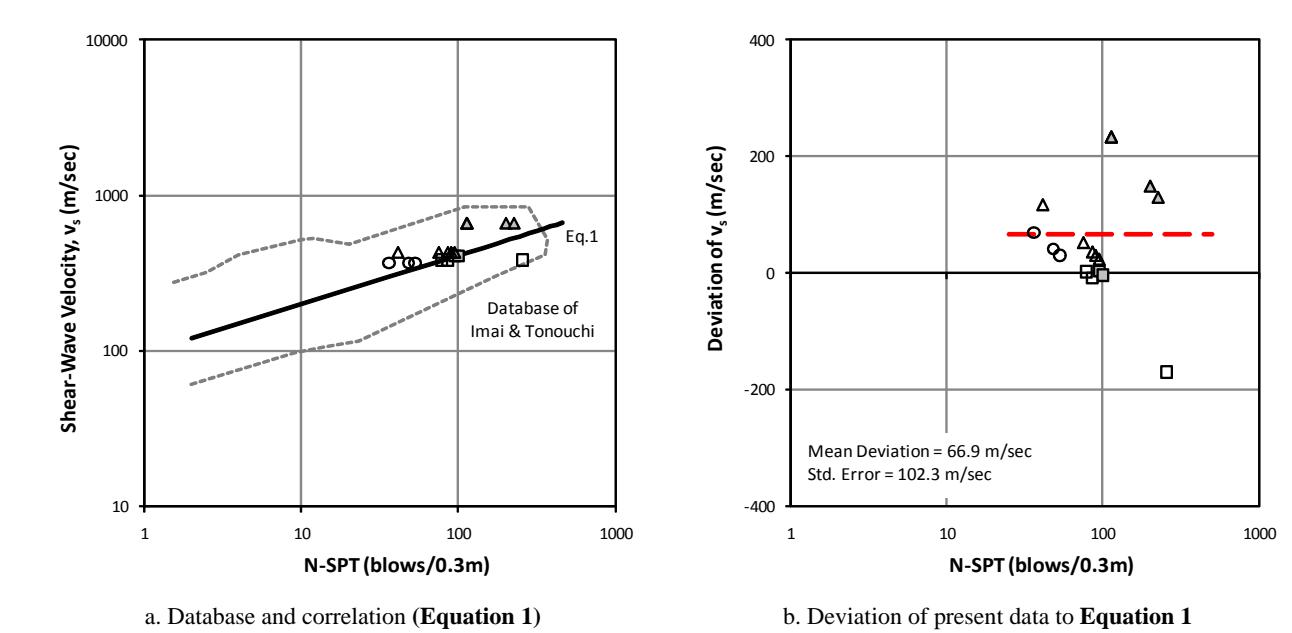
Figure 4. Comparison to database and correlation by Imai and Tonouchi (1982)
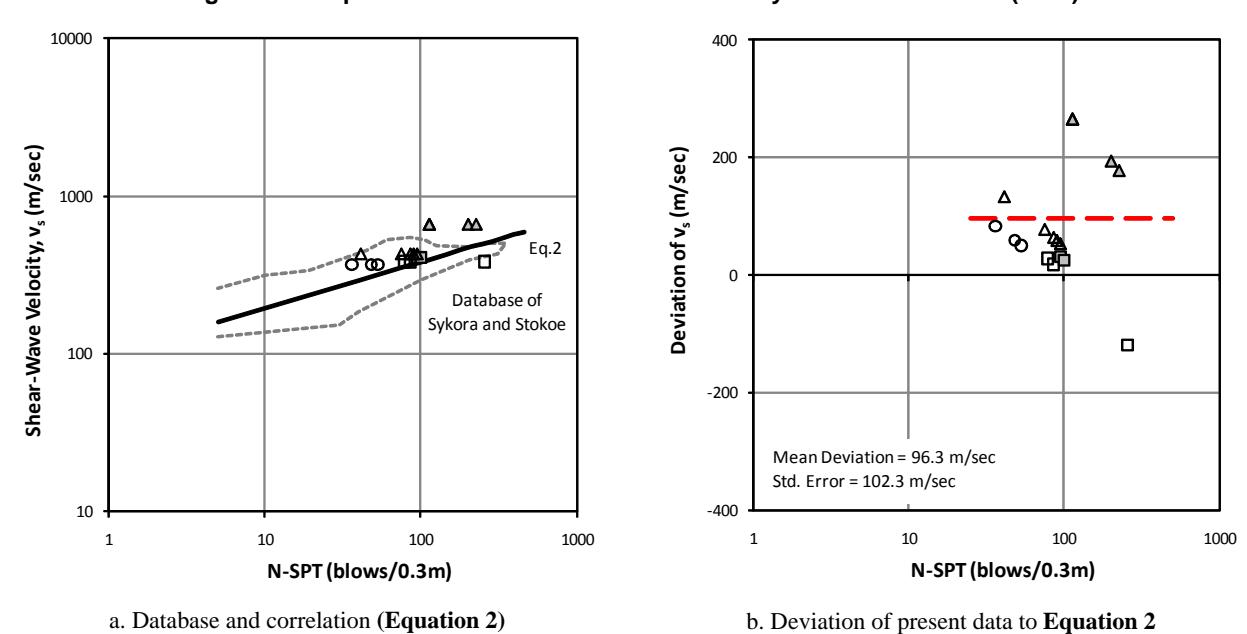
Figure 5. Comparison to database and correlation by Sykora and Stokoe (1983)
5. Conclusions
- 1. Shear-wave velocity vs and standard penetration resistance N-SPT data of cemented soils from three locations in Jakarta area were evaluated.
- 2. Though limited in number, the present database is within ranges of existing databases available in the literature.
- 3. Based on the results, a simple regression equation correlating measured N-SPT to vs for cemented soils was developed. From comparisons to existing correlations, the proposed correlation appears to be
6. Acknowledgment
The work described in this paper was supported by Universitas Indonesia under Grant No. DRPM/Hibah Riset Berbasis Laboratorium Internal/2010/I/10034. This financial support is gratefully acknowledged. The author thanks Dr. Daud Yunus and Surya A. Pratama of Geophysics Laboratory, Universitas Indonesia for their seismic downhole test expertise.
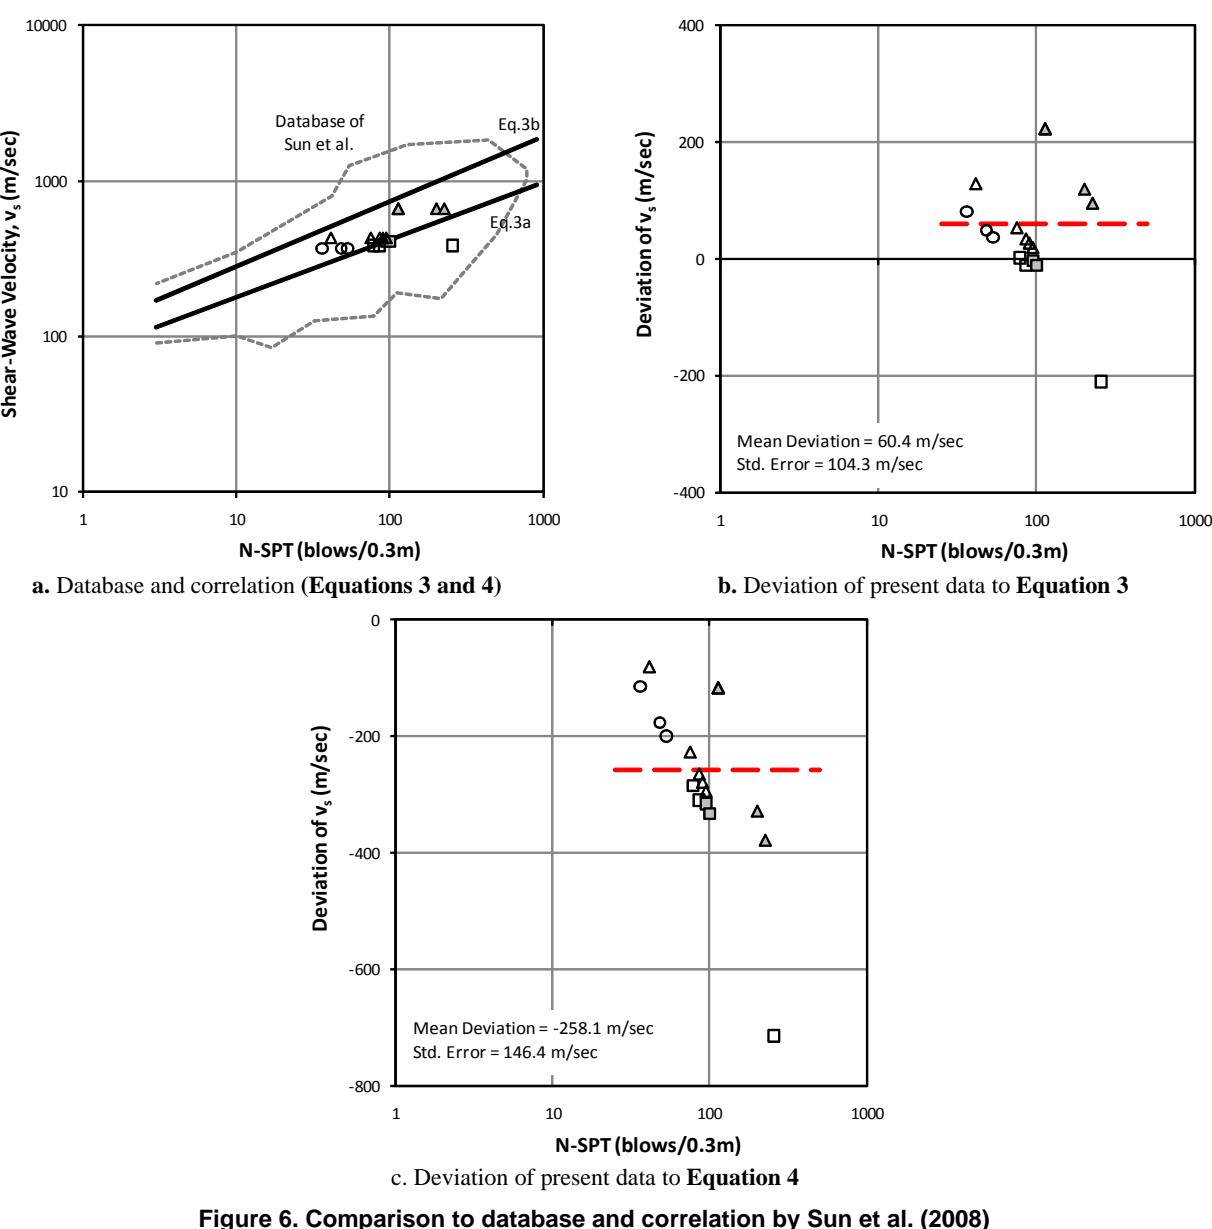
Figure 6. Comparison to database and correlation by Sun et al. (2008)
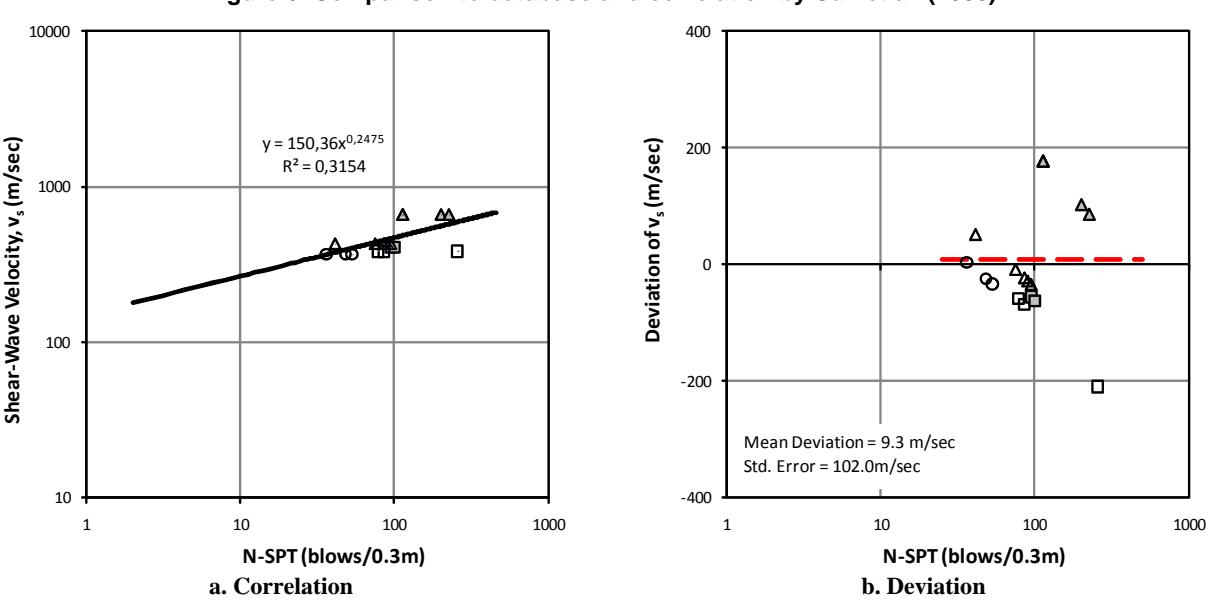
Figure 7. Correlation between Vs and N-SPT for cemented soils of Jakarta
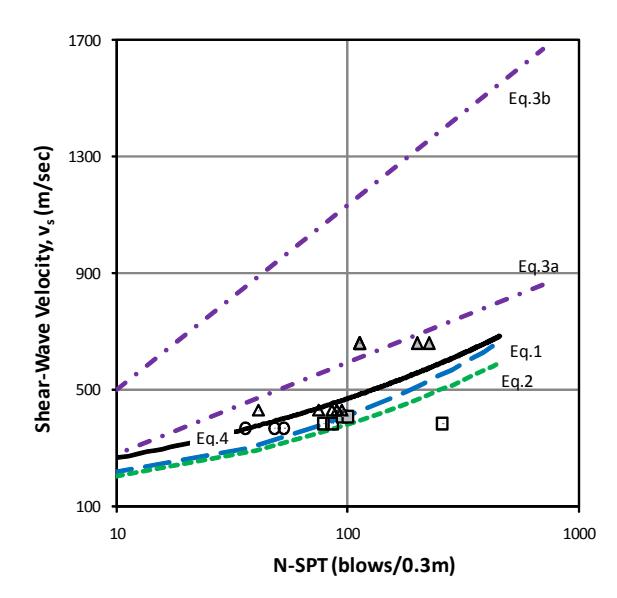
Figure 8. Comparison of present correlation to existing correlations