
Abstrak
Paper ini menyampaikan hasil studi eksperimental dan numerik untuk memperkirakan besarnya kecepatan rambat gelombang (ppv) akibat pemancangan tiang pancang. Dengan bantuan software Plaxis ver. 8.2 Dynamic, studi ini menganalisis sejumlah model dengan berbagai variasi kekakuan pada tanah, khususnya tanah lempung (clay) dan berbagai kedalaman fondasi tiang tertanam. Hasil analisis software Plaxis ver. 8.2 Dynamic ini telah diverfikasi dengan hasil studi eksperimental pada sebuah proyek pemancangan fondasi tiang pancang di Kalimantan Timur. Berdasarkan analisis numerik dan data dari pengujian lapangan yang mempunyai hasil yang hampir sama, nilai ppv bergantung dari jarak dari pemancangan dan kekakuan tanah. Hasil dari penelitian ini adalah usulan formulasi prediksi besarnya kecepatan rambat gelombang (ppv) dalam bentuk chart untuk mempermudah menentukan nilai ppv yang akan terjadi akibat pemancangan di tanah lempung. Sedangkan keluarannya akan berupa besaran nilai ppv (peak particle velocity) terhadap jarak pemancangan tiang.
Kata-kata Kunci: Pile driving, Peak Particle Velocity (PPV).
1. Introduction
Vibration of soils is a phenomenon which can be harmful to surrounding structures. It is usually caused by either natural phenomena or human activity. Human activity can generate soil vibration with variation in intensity, which mainly depends upon the source of vibration. Pile driving currently becomes the main source of vibration of the human activities.
Unfortunately, building constructions in close proximity will be more often in denser population such as in big cities in the future. This issue causes potential damage of existing building induced by vibration
effect from near building construction. Therefore, vibration effects against existing building during construction process in the future should be well known and well predicted to prevent disturbance to the existing surrounding infrastructures.
Hitherto, current analysis method of vibration level in soil generated by pile driving still needs to be improved for more accurate prediction. Mechanism of vibration and seismic wave during pile driving is ilustrated in Figure 1. Figure 2 shows an illustration of wave propagation in soils caused by a 5 ton hydraulic hammer pile driving process.
During driving process of a pile into ground, shear wave is generated and vertically polarized along the surface of driven pile. It is outward propagated by creating a cone with small angle along surface of cylinder (Asthanospoulos & Pelekis, 2000).
The purpose of the research presented in this paper are, assessing the mechanism of vibration of soil induced by a pile driving from collected field data; conducting numerical analysis using finite element analysis to obtain a more comprehensive understanding of vibration of soil's behaviors and producing a general formulation in predicting peak particle velocity (ppv) value, particularly in the vicinity area of a vibration source, in this case a pile driving.
Figure 1. Mechanism of seismic wave propagation during pile driving (Madheswaran, et al., 2005)
Due to the complexity of issue which is to be discussed and time limitation, several limitations of analysis are set: dynamic load is perfectly harmonic, vertical driven pile, soil material is assumed to be linier elastic, slip between foundation and soil is neglected
2. Vibration
The general assumption taken in the calculation of this research is theory of time-dependent movement under the influence of a dynamic load which is expressed by equation below.
\[\underline{\underline{M}}\,\underline{\ddot{u}} + \underline{\underline{C}}\,\underline{\dot{u}} + \underline{\underline{K}}\,\underline{\underline{u}} = F \tag{1}\]
Where M is mass matrix from material in which soil, water, and any constructions, C is damping matrix, K is stiffness matrix, and F is load. Displacement function is expressed as u which can differentiate into velocity (ů) and acceleration (ü). By using finite element calculation, damping matrix can be calculated from function of mass and stiffnes mass matrices.
On the other hand, by basing the vibration of damping, four categories of a vibration are as follows: undamped free vibrations, damped free vibrations, undamped forced vibrations, and damped forced vibrations.
A vibration source, such as a machine foundation, will generate waves in soil mass (Figure 3). Practical illustration can be seen in vertically vibrated of circular foundation case which is lied on the surface of a semiinfinite elastic medium. Transfered energy into the soil consists of body wave of 33% (comprising P-wave of 7%, S-wave of 26%), and R wave of 67% (Miller & Pursey, 1955).
Wave energy from the machine will then be absorbed by the geometrical damping which is represented by reduction of the amplitude of motion. Body wave will propagate radially with half-sphere trajectory, while Rayleigh wave will propagate with cylindrical trajectory as well (Figure 3).
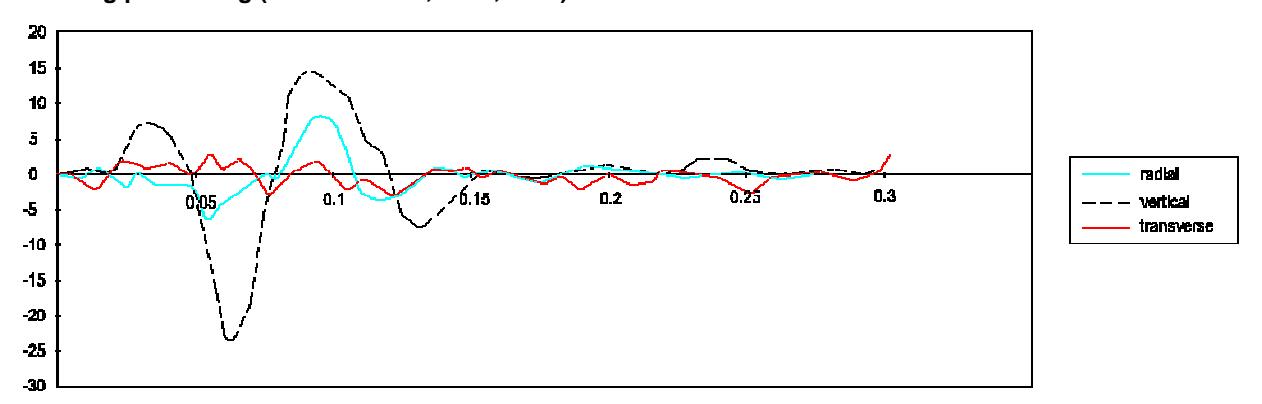
Figure 2. Sample of wave propagation in soils caused by pile driving process using Hydraulic Hammer 5 ton (Ramshaw & Selby, 2003)
Figure 3. Distribution of wave propagation from surficial foundation through homogen, isotropic, and semi-infinite medium (Woods,1968)
3. Dynamic Parameters of Soil
Foundation analysis against dynamic loading reqiuires better understanding of dynamic parameters of soil. Soil parameters which affect wave propagation in term of dynamic loading are modulus (E, G), damping ratio (ζ), Poisson ratio (v), and cyclic resistance. Several parameters which are required for machine foundation design are dynamic shear modulus (Gmax), Poisson ratio (v), and damping (ζ).
Foundation movement caused by operating machine will be damped by two (2) types of damping system: material damping and geometrical damping. Material damping develops due of friction between particles inside a soil mass (material/internal damping), whereas geometrical damping happens due to geometrical configuration of foundation and soil system (dispersion/geometrical damping) on an infinite or semi-infinite soil medium.
The pile foundation system which is supported by end bearing will bear reduction of natural frequency as the increasing pile length (Figure 4).
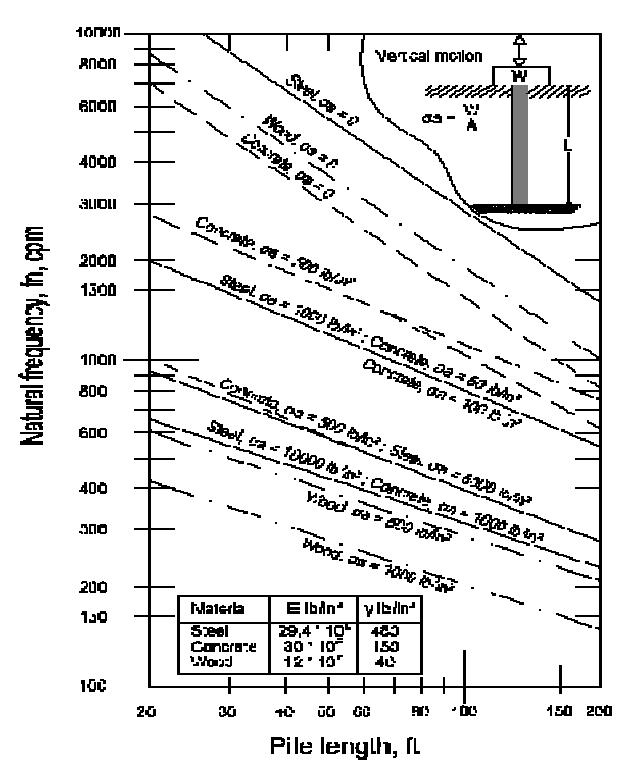
Figure 4. Natural frequency vs foundation length on end-bearing foundation (Richart et al., 1970)
There are several methods for dynamic response analysis for layered soils:
- a. Element Discretization Model
- b. Continuum Model
- c. Finite Element Model
Some influence factors that influence dynamic shear modulus value are (Hardin & Black, 1968):
- 1. Type of soil, properties (ω, γδ) and degree of disturbance.
- 2. Initial static stress (confining stress).
- 3. Strain level.
- 4. The influence of time.
- 5. Degree of saturation.
- 6. Frequency and number of cycle of dynamic loading.
- 7. Magnitude of dynamic stress.
- 8. Dynamic pra-strain.
4. Plaxis Dynamic
A professional software Plaxis2D Dynamics (8.2 version) is capable to analyze vibration effect in soil. Calculation of vibration uses dynamic analysis if frequency of dynamic loading are higher than natural frequency of soil medium, whereas for vibration with low frequency will be calculated by pseudostatic. The Plaxis2D Dynamics models the inertia of soil layer and dynamic variation against time which are inputted into dynamic model. The vibration magnitude depends on the distance from vibration source. If the distance from vibration source is far, the vibration will significantly be adsorbed by the geometrical damping. The soil was assumed in the undrained condition by considering excess pore pressure.
5. Case Study
5.1 Research data
Input data for this research were obtained from PT KPC, consisting of soil investigation data and vibration monitoring data. These data, particularly vibration
monitoring data, were taken during pile driving process and intended to know the disturbance impact to the existing conveyor which still operating during construction process.
5.1.1 Soil investigation data
Soil investigation was conducted in January 2005 by PT KPC comprising tem (10) deep borings along conveyor line. The deep boring was performed to an approximate depth of 50 meters with the ground water elevations of 1 to 2 meters below the existing ground surface. The simplified soil profiles are presented in Figure 5.
Soil parameters for analysis were selected based on field soil investigation and laboratory tests performed in 2005. Thickness of soil layers and related parameter (shear strength parameter) are summarized in Table 1 and Table 2.
Table 1. Summary of soil layer thickness
| Layer | Thickness (m) |
|---|---|
| Fill material | 0.5 – 2 |
| Firm to stiff clay/clayey silt | 3.5 – 12 |
| Very stiff silty clay/clayey silt | 2 – 22 |
| Dense to very dense silty sand/clayey sand | 2.5 – 4 |
| Very stiff to hard silty clay/clayey silt | 13 – 20 |
| Dense to very dense silty sand/clayey sand | 1 |
Table 2. Summary of shear strength parameters
| No | Material | Phi o ( ) | Cu (kPa) |
|---|---|---|---|
| 1 | Fill material | 26 – 40 | - |
| 2 | Firm to stiff silty clay/ clayey silt | - | 24 – 192 |
| 3 | Very stiff silty clay/clayey silt | - | 84 – 280 |
| 4 | Dense to very dense silty sand/clayey silt | 34 – 48 | - |
| 5 | Very stiff to hard silty clay/ clayey silt | - | 168 – 400 |
| 6 | Hard silty clay/clayey silt | - | 184 – 400 |
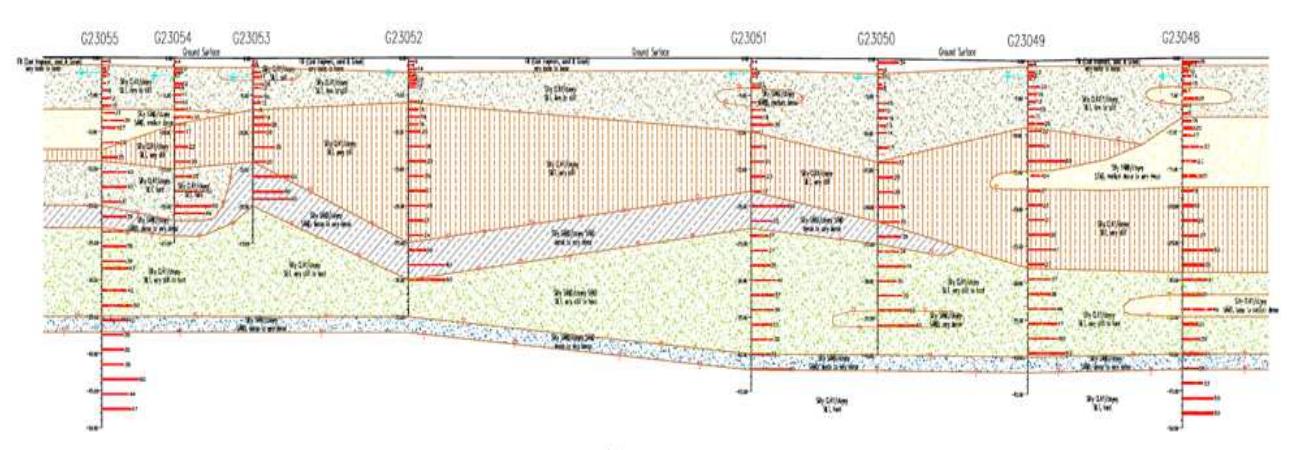
Figure 5. Simplified soil profile (deep boring)
5.1.2 Vibration monitoring data during pile driving
For vibration monitoring, geophone was utilized with digital controller. Prior to pile driving, geophones were placed by using spike in the north and south sides of conveyor. A professional software GRLDAS was also utilized for processing monitoring data. The pile driving process and geophone for field test are shown in Figure 6 and Figure 7, respectively. An example output of vibration monitoring is presented in Figure 7, while the recorded velocity variation during pile driving is shown in Table 3. Maximum velocity variation after pile driving – spun pile diameter 600mm with hydraulic hammer TW-10 Ton (predicted max. ppv = 15.6 mm/sec) During final set of pile driving, vibration recordings were conducted with distance from pile of approximately 2.0 meter. Overall, the final set of pilings were met at depth of about 24 meters.
Figure 6. Pile driving in conveyor area
6. Method of Data Processing
6.1 Method of predicting maximum vibration caused by pile driving
The level of disturbance of pile driving to the surroundings is measured by the Peak Particle Velocity (PPV) which is the vector resultant of velocities in 3D directions:
\[ppv = \sqrt{v_r^2 + v_t^2 + v_v^2} \tag{2}\]
Current prediction methods to calculate particle velocity in general are referred to Attewel and Farmer (1973). Wiss (1981), Heckman & Hagerty (1978), and J. M. Ko, et. al. (1990).
6.1.1 Attewel dan Farmer Method (1973)
Attewell & Farmer (1973) proposed a formulation to calculate particle velocity attenuation:
\[V(mm/\sec) = K \frac{\sqrt{W_0} (joules)}{r(m)}\] (3)
Where K is a constant. The equation shows that particle velocity is directly proportional to the hammer energy (W0) and inversely proportional to the distance. K value varies from 0.25 to 1.50. Measured data form Attewell & Farmer indicate that the average of particle velocity value are achieved with K = 0.75.
6.1.2 Wiss Method (1981)
Wiss (1981) performed an independent research and state that the maximum particle velocity can be closely related to:
\[\frac{\sqrt{W_0(joules)}}{r(m)} \tag{4}\]
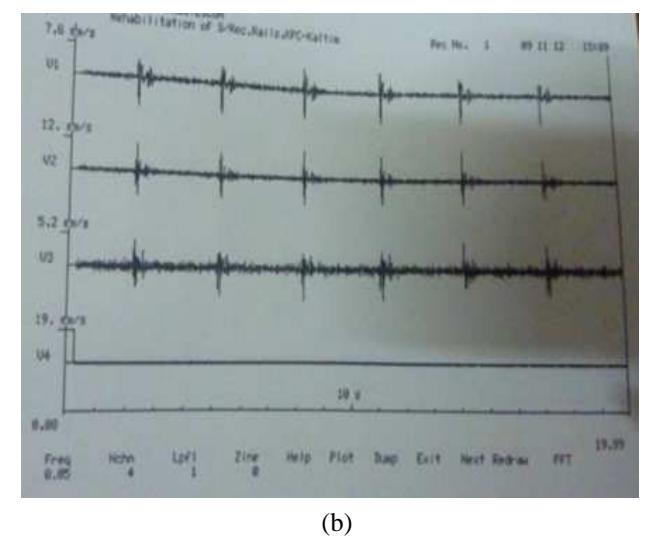
Figure 7. Vibration monitoring (a) Monitoring device (geophone) for field test (b) Sample output of vibration monitoring by using geophone
Table 3. Maximum velocity variation after pile driving – spun pile diameter 600mm with hydraulic hammer TW -10 Ton (predicted max. ppv = 15.6 mm/sec)
| D | Combone distance to Pile (m) | Maximur | |||
|---|---|---|---|---|---|
| During Pilling Pile Id. | Geophone distance to Pile (m) | \(Ver-z(V_v)\) | Hor-y \((V_t)\) | Hor-x (Vr) | |
| #NR-82 | 2 | 13 | 15 | 13 | |
| #NR-83B | 2.5 | 12 | 5.5 | 5.3 | |
| #NR-84 | 2 | 11 | 7.8 | 11 | |
| #NR-86 | 2 | 9.5 | 13 | 6.7 | |
| #NR-87A | 1.5 | 13 | 13 | 11 | |
| #NR-87B | 2.5 | 9.5 | 15 | 6.5 | |
| #NR-90 | 2 | 7.7 | 14 | 6.9 | |
| #NR-91A | 1.5 | 8.1 | 9.5 | 4.6 | |
| #NR-91B | 2.5 | 9.5 | 7.5 | 4.3 | |
| #NR-92 | 2 | 4.1 | 5.1 | 3 | |
| #NR-94 | 2 | 8.6 | 15 | 5.9 | |
| #INN-94 | 15 | 4.8 | 3.9 | 5.9 | |
| #NR-95A | 1.5 | 12 | 11 | 7.8 | |
| #INK-93A | 15 | 2.1 | 2.2 | 1.9 | |
| #NR-96 | 2 | 7.2 | 13 | 9 | |
| 15 | 1.5 | 2.7 | 1.3 | ||
| #NR-97 | 2 | 6.6 | 9 | 3.1 | |
| #NR-99B | 2.5 | 12 | 15 | 6.7 | |
| #NR-100 | 2 | 8.4 | 4.3 | 3.2 | |
| #NR-103B | 2.5 | 12 | 2.4 | 4.8 | |
| 10 | 5.8 | 5.4 | 2.6 | ||
| #NR-106 | 2 | 15 | 4.1 | 8.1 | |
| #INIX-100 | 10 | 7.7 | 6.8 | 4 | |
| #NR-109 | 2 | 7.5 | 4.9 | 2.5 | |
| #NR-111A | 1.5 | 15 | 11 | 13 | |
| #INIX-1117A | 15 | 2.8 | 1.9 | 1.7 | |
| #NR-112 | 2 | 10 | 2.8 | 2.7 | |
| π111-112 | 10 | 7.1 | 4.7 | 4.5 | |
| #NR-106 | 2 | 14 | 14 | 9.4 | |
| #NR-107A | 1.5 | 10 | 12 | 13 | |
| #NR-107B | 2.5 | 6.4 | 13 | 11 | |
Wiss suggested that the value from above equation is scaled energy which is similar with Attewell & Farmer for determining maximum particle velocity:
\[K\frac{\sqrt{W_0}(joules)}{r(m)} \tag{5}\]
Where K is a constant relied on type of soil. Wiss also conclude that vibration level produced by pile driver is different for clay soil and sand soil, and dry sand or wet sand as well. Therefore, Wiss used K factor to distinguish the effect of soil type.
6.1.3 Heckman & Hagerty Method (1978)
Heckman & Hagerty (1978) showed that K value varies for material type of driven pile (spun pile). The variation explained reduction of K value as the energy distribution capacity which is measured from impedance value rise. General equation of Heckman and Hagerty method are:
\[V(mm / sec) = K \frac{\sqrt{W_0} (joules)}{r(m)}\] (6)
The equation gives conservative value of maximum velocity. Additionally, it can be used to predict maximum particle velocity based on the distance and hammer energy. If pile impedance and type of soil are considered, accurate output will be obtained.
6.1.4 J.M. Ko,et. al. Method (1990)
J. M. Ko, et al. (1990) conducted an experimental study for quantifying particle velocity magnitude in a specified From distance from vibration source. measurement, particle velocities were plotted against distance from vibration source. The research yielded attenuation curve which accomodates energy, distance, and damping (geometric and material damping). J. M. Ko et al. used data from study location and obtained α dan V parameters at distance of 1.0 m from driven pile on alluvial silty sand soil. The reference values are \(\alpha = 0\).04 m-1 dan V = 70 mm/sec, so the empirial equation from J. M. Ko et al. is:
\[V(mm/\sec) = 70\sqrt{\frac{1}{r(m)}}e^{-0.04(r-1)}\] (7)
6.2 Limits of Vibration Impact of Building (U.S. Department of Transportation, Jones & Stokes, 2004).
Some of analysis results for vibration level toward human and structure are summarized by U.S. Department of Transportation (U.S. DOT), DIN 4150 (Germany) and Swiss Association of Standardization.
7. Analysis Model and Research Output
7.1 Modelling
Pile driving are numerically modelled by using finite element method with couple formulation. Controlled variables in this modelling are hammer energy (driving hammer) and soil stratification. With a specified distance, vibration mechanism and Peak Particle Velocity (PPV) will be obtained from the model. Output of the model will then be reviewed against the current safety standards to observe the safety level of surrounding existing building in the vicinity of pile driving location.
During pile driving, velocity of soil is measured in specified observation points. To predict ppv value in soil, software Plaxis 2D ver. 8.2 Dynamic is used. The results of ppv prediction will be verified with actual ppv measurement in the field. Therefore, the analysis are undertaken in two phases. Firstly, analysis of field condition is modeled and verified by field observation data from geophone. Secondly, parametric study is conducted by focusing on clay soil. Both analysis are varied with driving length of pile an. This finite element analyses employed 550 elements in which 15 nodes per element are used.
First analysis is performed by using axisymmetry model in which soil stratification is similar to the field condition shown in Figure 5. It covers 34 meters of soil which is generally consisted of 24 meters of clay layer and 10 meters of sand layer, as shown by figure below. Soil parameters are defined from soil investigation data and presented in Table 5.
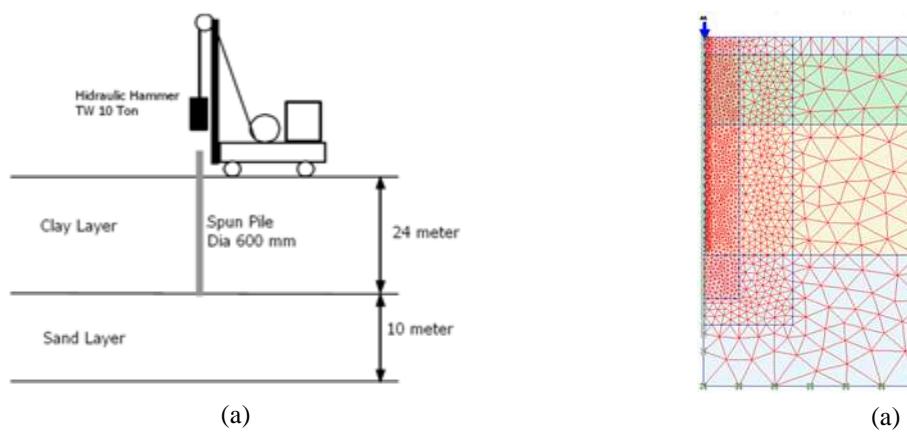
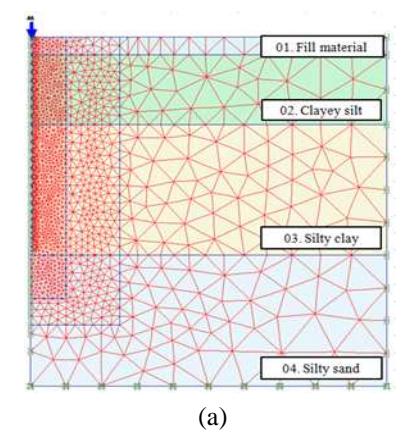
Figure 8. Pile driving model for verification analysis (a) Ilustration of site condition (b) Geometry model on Plaxis 2D version 8.2
Table 4. Vibration effect of structure
| Peak Particle Velocity (in/sec) | Effect on Humans | Effect on Buildings | ||
|---|---|---|---|---|
| <0.005 | Imperceptible | No effect on buildings | ||
| 0.005 to 0.015 | Barely Imperceptible | No effect on buildings | ||
| 0.02 to 0.05 | Level at which continuous vibrations begin to annoy buildings | No effect on buildings | ||
| 0.1 to 0.5 | Vibrations considered unacceptable for people exposed to comtinuous or long term vibration | Minimal potensial for damage to weak or sensitive structures | ||
| 0.5 to 1.0 | Vibrations considered bothersome by most people, however torelable if short term in length | Threshold at which there is a risk of architectural damage to buildings with plastered ceilings and walls. Some risk to ancient monuments and ruins | ||
| 1.0 to 2.0 | Vibrations considered unpleasant by most people | U.S. Bureau of Mines data indicates that blasting vibration in this range will not harm most buildings. Most construction vibration limits are in this range | ||
| >3.0 | Vibrations in unpleasant | Potensial for architectural damage and possible minor structural damage | ||
Table 5. Input parameter for case study analysis
| \(\gamma_{unsat}\) | \(\gamma_{\rm sat}\) | \(\mathbf{k}_{\mathbf{x}} = \mathbf{k}_{\mathbf{y}}\) | \(\nu_{\mathrm{u}}\) | \(\mathbf{E}_{\mathbf{ref}}\) | \(\mathbf{c}_{\mathbf{ref}}\) | phi | psi | \(\mathbf{R}_{\mathtt{inter}}\) | |||
|---|---|---|---|---|---|---|---|---|---|---|---|
| ID | Name | Туре | [kN/ m^3] | [kN/ m^3] | [m/ day] | [-] | [kN/ m^2] | [kN/ m^2] | [°] | [°] | [-] |
| 1 | 01. Fill Material | Drained | 16.5 | 17 | 0.5 | 0.3 | 50000 | 0.5 | 30 | 0 | 0.7 |
| 2 | 02. Clayey Silt | Undrained | 16 | 17 | 0.001 | 0.3 | 9000 | 25 | 1 | 0 | 0.6 |
| 3 | 03. Silty Clay | Undrained | 16 | 17.5 | 0.001 | 0.3 | 28000 | 80 | 1 | 0 | 0.6 |
| 4 | 04. Silty Sand | Drained | 17 | 18 | 0.5 | 0.25 | 20000 | 1 | 34 | 2 | 1 |
Second analysis comprises parametric study of pile driving. The following figures described input model of analysis, output and graph from post-driving analysis with variation of consistency of clay soil.
7.2 Case study - KPC Rail
Manual calculation of ppv value by using Attewell & Farmer (1973), Heckman & Hagerty (1978), J. M. Ko, et al method for pile driving case study give comparable value of ppv.
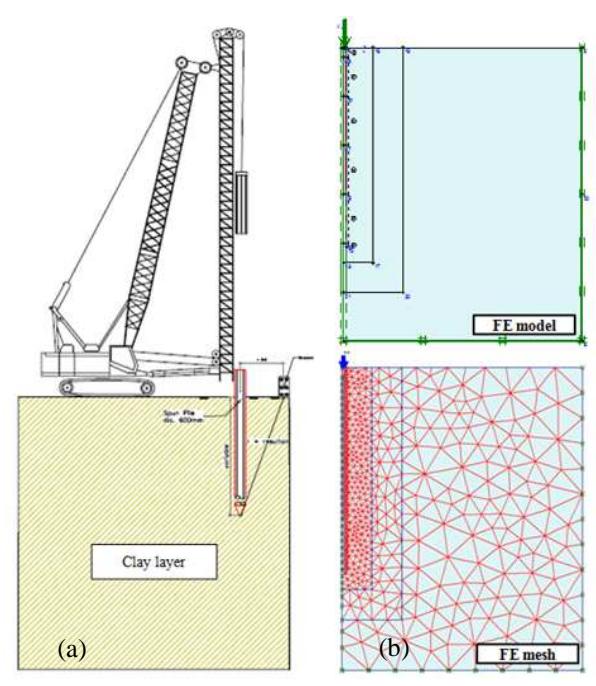
Figure 9. Illustration of pile driving model (single clay soil layer). (a) Ilustration (b) Analysis model
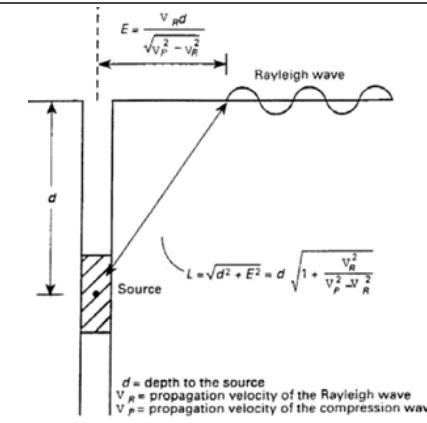
Figure 10. Illustration of pile driving model (Rayleigh Wave)
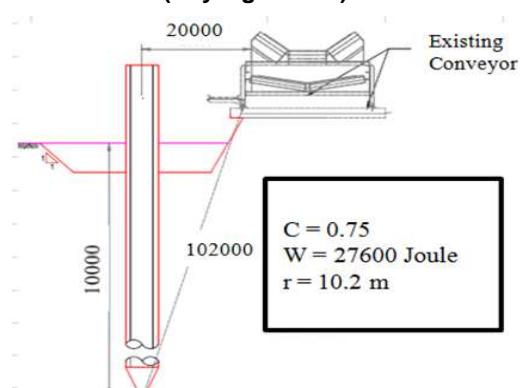
Figure 11. Illustration of pile driving distance (Susila et al., 2009)
Velocity (mm/s) vs time (s) curves during pile driving are obtained from FEM modelling by using Plaxis 2D ver. 8.2. Output of the analysis results for each observation point are presented as follow.
Table 6. PPV calculation results with variation of depth (Plaxis 8.2 Dynamic)
| Distance from Pile (m) | ppv (m/s) | |||||||||
|---|---|---|---|---|---|---|---|---|---|---|
| Driving Length (m) | ` | 2.2 Dynamic) Plaxis - v(v) | Heckman & Hagerty (1978) | Attewell & Farmer (1973) | J. M. Ko et al. | |||||
| 1 | 0.074 | \(\frac{v_{(x)}}{0.031}\) | \[\frac{\text{Flaxis - } v_{(y)}}{0.07}\] | 0.012398 | 0.016605 | 0.015375 | ||||
| 10 | 2 | 0.074 | 0.029 | 0.045 | 0.012338 | 0.016364 | 0.015373 | |||
| 10 | 3 | 0.035 | 0.022 | 0.029 | 0.012216 | 0.015984 | 0.013172 | |||
| 1 | 0.057 | 0.023 | 0.057 | 0.008288 | 0.011101 | 0.010299 | ||||
| 15 | 2 | 0.033 | 0.027 | 0.03 | 0.008234 | 0.011028 | 0.010224 | |||
| 3 | 0.019 | 0.019 | 0.014 | 0.008145 | 0.010909 | 0.010102 | ||||
| 1 | 0.048 | 0.021 | 0.046 | 0.006222 | 0.008334 | 0.007308 | ||||
| 20 | 2 | 0.032 | 0.026 | 0.027 | 0.006199 | 0.008303 | 0.007273 | |||
| 3 | 0.018 | 0.018 | 0.013 | 0.006161 | 0.008252 | 0.007215 | ||||
| 1 | 0.045 | 0.021 | 0.032 | 0.005187 | 0.006947 | 0.005687 | ||||
| 24 | 2 | 0.029 | 0.029 | 0.022 | 0.005174 | 0.006929 | 0.005666 | |||
| 3 | 0.019 | 0.016 | 0.012 | 0.005152 | 0.0069 | 0.00563 | ||||
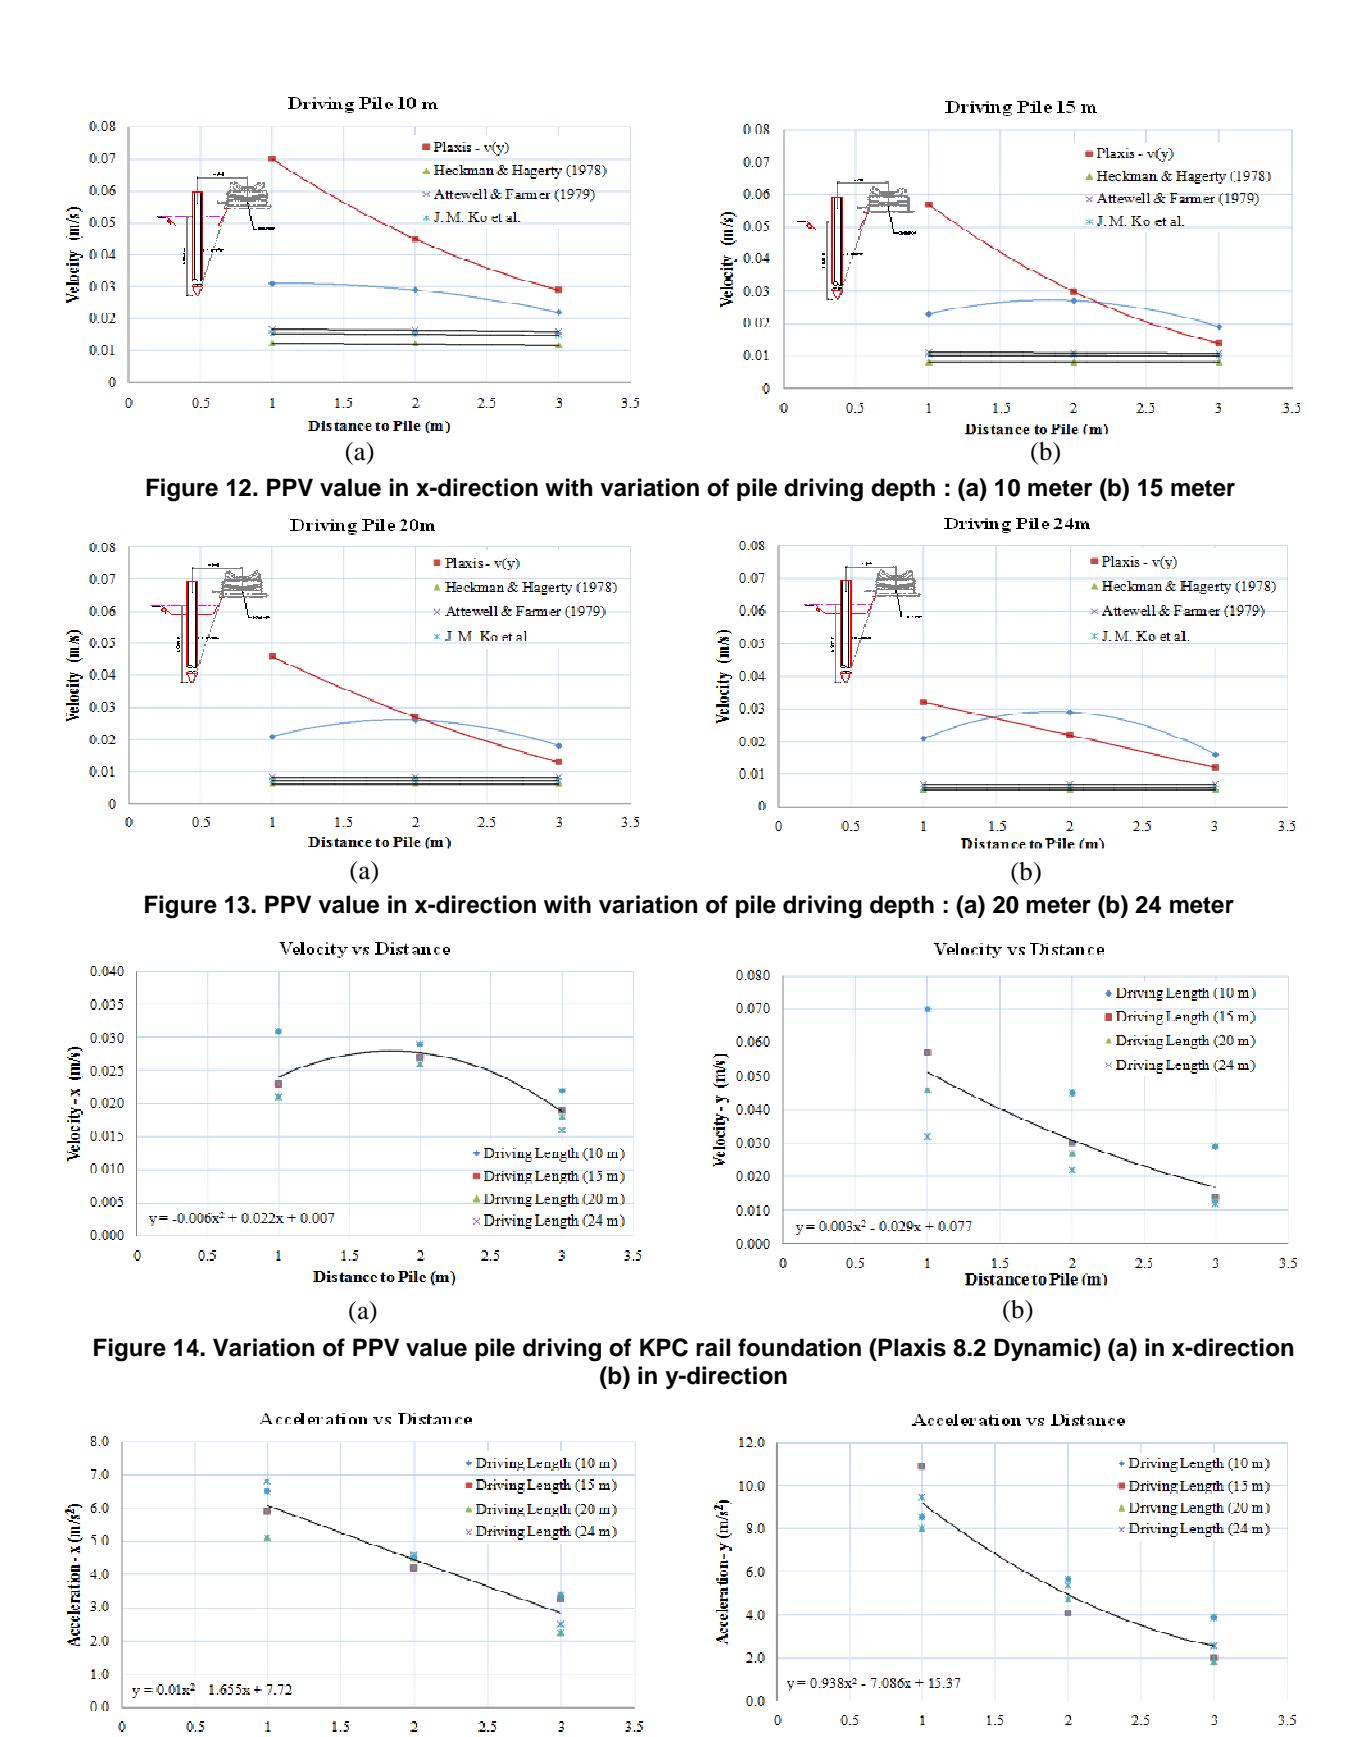
Figure 15. Variation of acceleration value pile driving of KPC rail foundation (Plaxis 8.2 Dynamic) (a) in x-direction (b) in y-direction
(a) (b)
Comparison between field measurement presented in Table 3 and analysis results summarized in Table 6 by considering pile length and distance from piling which are about 24 meter and 2 meter, respectively, show comparable value. Plaxis results tend to produce conservative value (0.029 m/s) compared to maximum recorded field data which is 0.02373 m/s.
7.3 Parametric study of PPV prediction of pile driving on clay layer
Based on peak particle velocity calculation from Plaxis 8.2, with variation of depth within homogeneous clay layer, peak particle velocity value can be determined and presented in figure below.
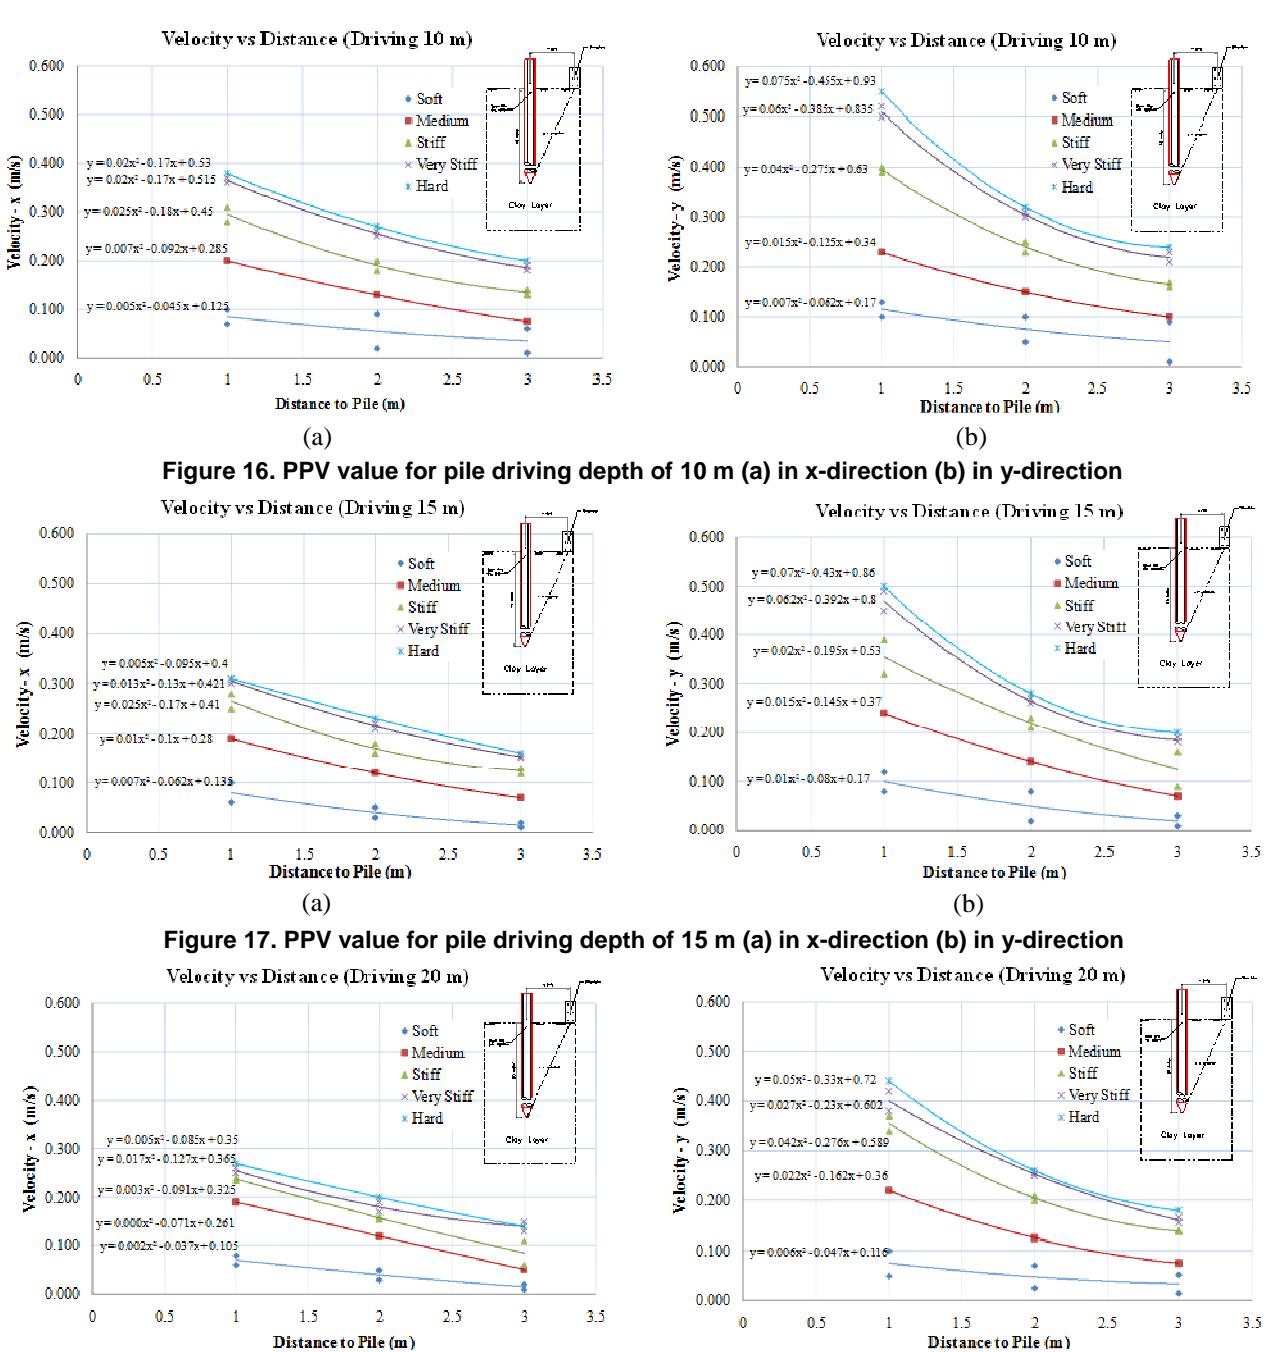
(a) (b) Figure 18. PPV value for pile driving depth of 20 m (a) in x-direction (b) in y-direction
8. Conclusion
- 1. Particle velocity value is used to determine direction of wave propagation which is an approach of displacement function (ds/dt). The approach is an accurate explanation to predict damaging effect to the surrounding structure induced by wave propagation. Acceleration and frequency are contained in the wave propagation velocity. Therefore, for closedistance of vibration source, it is better to estimate the effect in form of velocity because of decay effect. Moreover, decay effect of velocity has fully occured in far distance.
- 2. PPV value from this parametric study proves the relationship between soil stiffness and ppv value, as well as oile driving depth and ppv value. Furthermore, The PPV value is directly proportional to the soil stiffness, and inversely proportional to the pile driving depth. If the observed structure is closely located to the vibration source, time history of velocity will be more useful than time history of acceleration. However, if the vibration source is located in relative, far distance, such as earthquake, time histories of time will be more useful than time history of velocity.
- 3. The case study analysis yields Peak Particle Velocity (PPV) which closely match with the field data. By considering the capability of prediction method of Peak Particle Velocity (PPV) which have been verified with the field monitoring data, parametric study of similar case with homogeneous clay layer is conducted. Although, the variation of this study is solely for clay soil, the results which are presented by graphic can be proposed as a preliminary approach on predicting Peak Particle Velocity (PPV) value on similar condition.
9. Recommended Future Study
Advance soil material model besides linear elastic should be used in further analysis. On the other hand, slip between foundation and soil needs to be considered as well.
10. Acknowledgement
The authors gratefully acknowledge the ITB Research Grant for partially funding this research.