
Abstrak
Makalah ini menyajikan pengembangan model ANN untuk prediksi kapasitas daya dukung axial tiang pancang berdasarkan data uji Pile Driving Analyzer (PDA). Sebanyak 300 set data uji dari uji beban dinamis yang dilakukan pada beberapa proyek konstruksi di Indonesia dan Malaysia dipilih untuk penelitian ini. Variabel bebas yang digunakan adalah karakteristik tiang pancang (diameter, panjang serta kapasitas tekan dan tarik), set, dan karakteristik palu penumbuk tiang (berat palu, tinggi jatuh dan energi yang ditransfer). Model ANN (yang dinamakan: ANN-HM) dikembangkan dalam penelitian ini menggunakan intelligent system dalam ANN untuk memprediksi daya dukung tiang total yang didistribusikan kepada tahanan ujung dan tahanan sisi untuk berbagai jenis tiang dan palu penumbuk tiang. Hasil penelitian menunjukkan bahwa ANN-HM dapat diandalkan untuk memprediksi daya dukung tiang pancang dengan koefisien korelasi (R) mendekati 0,9 dan rata-rata kesalahan kuadrat (MSE) kurang dari 1 % setelah 15.000 kali proses iterasi.
Kata-kata Kunci: Kapasitasaksial, Tahanangeser, Tahananujung, PDA, ANN
1. Introduction
Artificial neural networks (ANN) have been adopted used by researchers as a tool for the development of predictive models on various geotechnical problems including bearing capacity of piles. The neural networks in ANN model attempt to simulate the process by which human brain learns to discern patterns in arrays of data. The ability of the neural network to learn complex association by examples makes it an attractive method for estimating pile capacities based on stress-wave measurements in pile driving analyzer (PDA) test.
Several researchers have attempted using ANN application is to develop optimal models using simple data obtained from PDA test. For example, Lee and Lee (1996) simulated data obtained from model pile using in-situ pile load test. The output of the model prediction is the ultimate bearing capacity while the input includes penetration depth of pile, diameter of pile and the mean normal stress. The study shows that the ANN model gives a maximum error not more than 25%. Similarly, Abu Kiefa(1998) introduced a general regression neural network for predicting the capacity of a driven pile in cohesionless soil. Five variables were selected as input data: angle of friction of soil, effective overburden pressure, pile length, and cross sectional area of the pile. The results show that ANN model gives a better prediction when compared with analytical and empirical methods such as Meyerhoff and Coyle & Castello. Nawari et al. (2005) also studied a method for design and analysis of deep foundation using an artificial intelligence technique utilizing Back-propagation Neural Network (BPNN) models. The inputs of the network for training and testing are N-SPT value and pile dimension. During the training phase, the measured axial pile capacities were compared with the capacities obtained by BPNN. The developed neural network models were capable of reproducing the target output values with minimal error. Furthermore, Teh(1997) also proposed a neural network for estimating the static pile capacity determined from dynamic stress-wave data (PDA) combined with Case Pile Wave Analysis Program (CAPWAP) software for square precast reinforced concrete piles. The study was concerned with predicting CAPWAP output rather than true bearing capacity of the pile. They used back-propagation neural networks (BPNN) for their analysis. The predicted value gives a small error of about 10% when compared to actual data. Park and Cho (2010) applied the ANN model to predict the resistance of the driven pile in dynamic load test. One hundred and sixty five(165) data from dynamic piles load test at various sites in Korea were selected to develop the model. The results indicate that the ANN model served as a reliable and simple predictive tool to predict the resistance of the driven pile with R2 values close to 0.9.
This paper presents the application of the ANN for prediction of axial capacity of driven pile by adopting PDA data collected from several construction projects in Indonesia and Malaysia involving PDA test with CAPWAP analysis. The PDA combined with CAP-WAP software is the most widely employed system for High Strain Dynamic Pile Test (HSDPT) due to its simplicity and quick handling of the data. The procedure is standardized in ASTM-D4945-08 (2008). Detail explanation of the analysis of pile driving formulas and wave equation analysis adopted in PDA test and CAPWAP analysis can be found elsewhere (e.g. Coduto (2001)).
The ability of CAPWAP procedure to accurately predict static capacity from dynamic pile testing has been demonstrated by Robert (1994) and Likins (2004) indicating a good correlation between CAPWAP prediction of pile capacity and Static Load Test (SLT) results. On the contrary, Lok and Che (2004) indicated that the accuracy of HSDPT output relies mainly on the input parameters such as hammer efficiency and damping factor. Similar study was done by Gofar and Angelo (2006) on bored piles in Malaysia and they concluded that the relationship between the results of SLT and PDA test is site specific;hence only after correlation with the static load test, more dynamic test can be carried out as quality control to save cost and expedite construction in large project.
Following Teh (1997), this model was developed based on the capacity obtained from CAPWAP analysis rather than the true bearing capacity of piles. As many as 300high quality load test records were acquired from projects in Indonesia and Malaysia. These data was obtained from projects where at least one SLT was performed, thus correlation was applied to the data before processing.
An ANN system (named ANN-HM) was developed by a computerized intelligent system based on these data for predicting the total axial bearing capacity of the single pile (Qt), as well as shaft resistance capacity (Qs) and end bearing capacity (Qe) based on selected pile and hammer characteristics. The performance of the system was evaluated until the final model characteristics were achieved.
2. Artificial Neural Network (ANN)
ANNs are mathematical inventions inspired by the function of the human brain and nervous system. The ANNs must be trained by inputting data repeatedly together with corresponding target outcomes. After sufficient numbers of training iterations, the ANNs learn to recognize patterns of the data, hence; creating an internal model of the governing data process. The ANNs use this internal model to make predictions for new input conditions. The input variables are called neurons, and neurons send signals to other neurons. Some input to the neuron may have greater importance than the other, and this is modeled by weighting the input to the neuron. Thus, the neuron can be thought of as a small computing engine that takes in input, processes them, and then transmits an output.
Literature study (Priddy and Keller, 2007) indicates that the most popular neural networks model is the Back-Propagation Neural Networks (BPNN). BPNN consists of three inter-connected group of layers, i.e. input layer, hidden layer and output layer. The purpose of BPNN training is to change iteratively the weights of each neuron in a direction that minimizes the error. The number of hidden neurons is important in the BPNN. However, there is no exact method for determining the number for hidden layer neurons. As described by Nawari, et. al (2005), too many hidden layers make the training time longer, but few hidden layers make learning algorithm be trapped in local minimum. Determining the suitable number of hidden layer requires trial and error process. Berke and Hajela (1991) suggested that the rough estimations of the best number of nodes on the hidden layer should be between average and the sum of the nodes in the input and output layers.
Various transfer functions should be investigated to achieve the best performance in training as well as in testing steps. The optimal performance was obtained from tan-sigmoid-log sigmoid-log sigmoid-linear activation functions in the first, second, third and output layers respectively. ANNs have the ability to model the non-linear relationship between a set of input variables and the corresponding outputs without the need for predefined mathematical equations.
Furthermore, ANNs do not need prior knowledge about the nature of the relationship between the model inputs and corresponding outputs. ANNs use the data alone to determine the structure of the model, as well as the unknown model parameters. This enables ANNs to overcome the limitations of the existing methods.
Compared to traditional methods, ANNs tolerate relatively imprecise, noisy or incomplete data. The approximate results are less vulnerable to outliers, have better filtering capacity, and are more adaptive. Moreover, ANNs also use massively parallel processes; therefore the numerous independent operations can be executed simultaneously.
The most important process for artificial neural networks model is dividing the available data into two sets of data. As mentioned by Shahin (2010), the available data are randomly divided by two statistically consistent sets: a training set for model calibration, and an independent testing set for model verification. In this study, the training and testing procedure of the ANN model to predict the ultimate bearing capacity of the single driven pile is mentioned in Figure (1).
3. Data Collection
The data used for this study was collected from various projects involving dynamic pile tests in Indonesia and Malaysia. The tests were performed using PDA test based on ASTM D 4945-08 and CAPWAP software for analysis of bearing capacity. Only high quality data from on concrete pile were used in the study. Three hundred sets of high quality test data from dynamic load test were selected for the subsequent study; as many as 188 load test records were acquired from projects in Indonesia while the other 112 load test records were collected in Malaysia.
The spun piles used in this study are circular with diameter between 300 and 500 mm and square with sides between 200 and 400 mm. Equivalent diameter was calculated for the square piles based on the area of the pile cross section.
As suggested by previous researchers, better selection of input data will significantly improve the accuracy of prediction; thus, in this research, the piles are grouped into small, medium, and large diameter piles. There are 25 (12%) small (diameter less than 200mm) piles, 131 (63%) medium sized (diameter between 200mm and 400mm) piles and 53 (25%) large piles (diameter > 400mm) (Table 1).
Table 1. Grouping of pile data based on diameter
| Group | Diameter | Number of pile | Percentage | |
|---|---|---|---|---|
| Large pile | > 400 mm | 53 | 25% | |
| Medium pile | 200 – 400 mm | 131 | 63% | |
| Small pile | < 200 mm | 25 | 12% | |
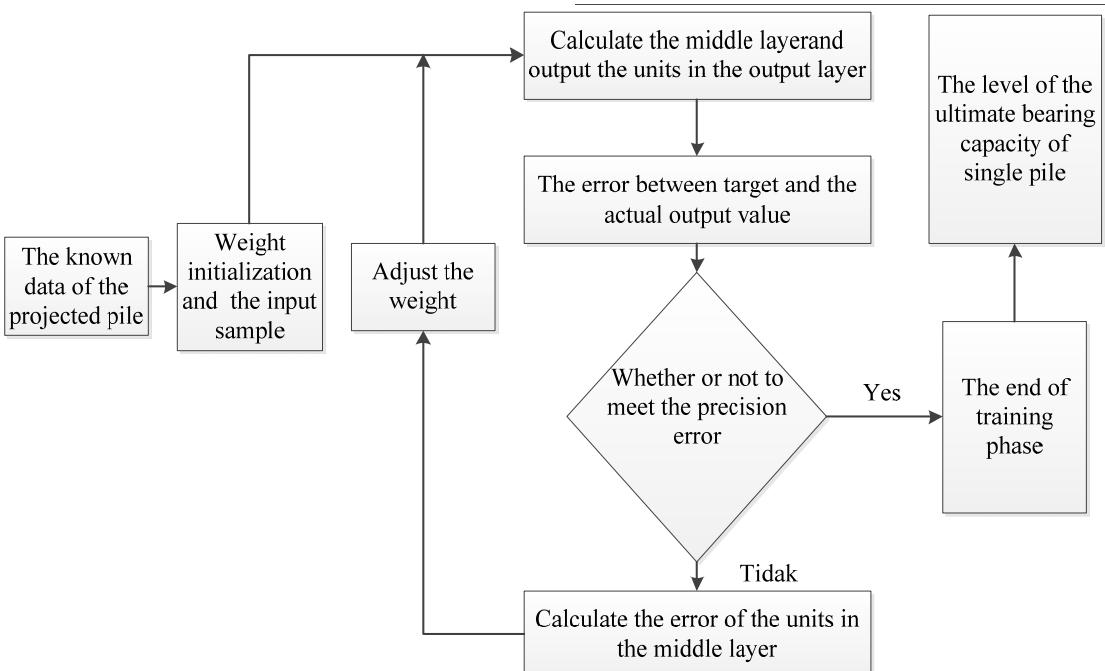
Figure 1. The procedure of training ANNs model (Zhao (2010))
Eight parameters were selected as input parameters for the subsequent study i.e. pile equivalent diameter (D), embedment length (L), compression stress (CS), tension stress, (TS), vertical displacement or set (DFN), ram weight, (WH), drop height, (DH) and energy transferred (EMX). The target output variables for this study are the total axial bearing capacity of the single pile (Ot) which distributed to shaft resistance capacity (Qs), and end bearing capacity (Qe). These target values were obtained from the output of CAP-WAP analysis which was adjusted to the results of SLT test on the related projects.
4. Modeling Process
Based on the collected data, the neural network model developed in this study uses 8 (eight) nodes in the input layer (D, L, CS, TS, DFN, WH, DH, and EMX), 8 (eight) nodes in the hidden layer (q1, q2,....q8), and three nodes in the target output (Qt, Qe, and Qs). Figure 2 shows the architecture of the complete network for this study.
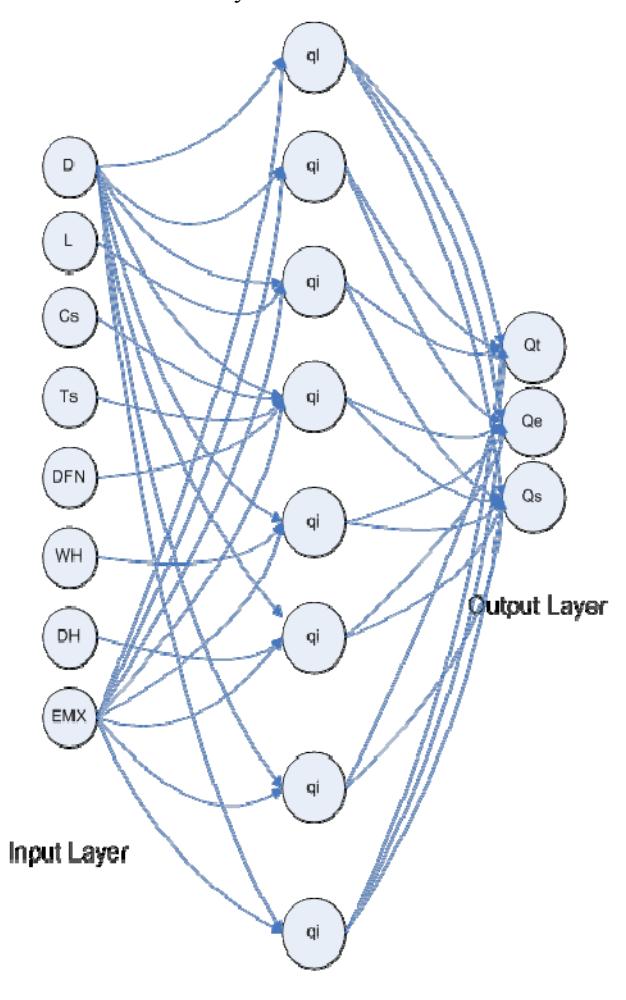
Figure 2. The architecture of the developed ANNs Model
Hidden Layer
Database is prepared for training and testing procedure of the proposed neural network. The input and target output variables were normalized in values ranged between 0 and 1 before training, then data are ready to be used for the training and testing with ANN model. Rescaling is often accomplished by using a linear interpolation formula, as mentioned by Priddy and Keller (2007) given by Equation (1):
\[x_{i}^{'} = \left[ \frac{(x_{i} - min_{value})}{(max_{value} - min_{value})} \right]\](1)
where:
value of data normalization max<sub>value</sub>: maximum data value minimum data value
The training was performed in this study using backpropagation algorithm because BPNN can provide accurate predictions to any continuous function with sufficient neurons. The target of ANN model is not the best training data, but the best responds of the training data to be used for testing data. The selection of hidden nodes size should be done carefully to get the good reliable model. Hecht-Nelson (1980) used Kolmogorov'stheorem in which any function of input (i) variables may represent by the required number of hidden nodes (h) or h = 2i + 1. The value of mean squared error (MSE) is a goal of the analysis and this value varies with the coefficient of determination \(R^2\) of the testing result (Park and Cho (2010). The \(R^2\) value described the contribution of input value in predicting the target output value, which means the lowest MSE value gives the better prediction of axial bearing of driven pile.
Once the ANN model is evaluated in training phase, the measured axial pile bearing capacities are compared with the capacities obtained by BPNN. The developed ANN model should be capable of reproducing the target output values with minimum error. After that, the result of the trained model is used for a new set of data and being examined again. The iterative process was performed until the training, testing and validation phases are successfully accomplished. Finally, the developed ANN model can be used as a tool for predicting axial bearing capacity of single driven pile.
The subsequent step in the development of ANN model is to determine the number of hidden layers and the number of hidden nodes in each hidden layer. In this study, the optimal ANN model is obtained by a trial and error in which the ANN model is trained using one hidden layer with 2, 3, 4,...8 hidden layer nodes, respectively. The procedure of using the ANN model for predicting the ultimate pile bearing capacity of the single driven pile is explained in Figure (3). The ANN output data, should be turned back to the actual value data (un-normalized step), and then, the final output predicted by the ANN result can be compared with the target output from PDA test result. This is called the testing and validation process.
The neural network model was developed by using the software Matlabver 7.10.0.499 (R2010a) licensed under UniversitiTeknologi Malaysia (UTM). During analysis, the 300 test data acquired from construction projects were divided into three categories:training set data (70% or 208); testing set data (15% or 41), and validation set data (15% or 41). The training, testing and validation processes were performed for 20,000 iterations with interval of 5,000 iterations. Table (1) represents the performance of the model in terms of coefficient of correlation (R) and mean squared error (MSE) for different iteration number during the training, testing and validation process. Analysis of output indicates that the best results were obtained for the conditions given in Table (2).
5. Performance of the ANN-HM Model
The ANN model developed in this study to predict the axial bearing capacity of driven pile for conditions mentiond in Table 2 is subsequently referred as ANN-HM. Comparisonbetween the predicted values of total bearing capacity of pile by ANN-HM model during the training, testing and validation phase and the measured bearing capacity using CAPWAP is presented in Figure 3. It should be noted that the coefficient of correlation (R) between the prediction and measured value of total bearing capacity is quite high i.e. 0.9377 after the validation process which gives a coefficient of determination \((R^2)\) value of 0.88. Figure 4 and 5respectively present the same comparison for haft resistance and end bearing capacity. The figures suggest that the prediction using ANN-HM model is remarkably in good agreement with actual data especially for total bearing capacity. The good combination of the experimentation indicated the highest coefficient of correlation (R) and lowest error rate (MSE) for the training, testing and validation phase.
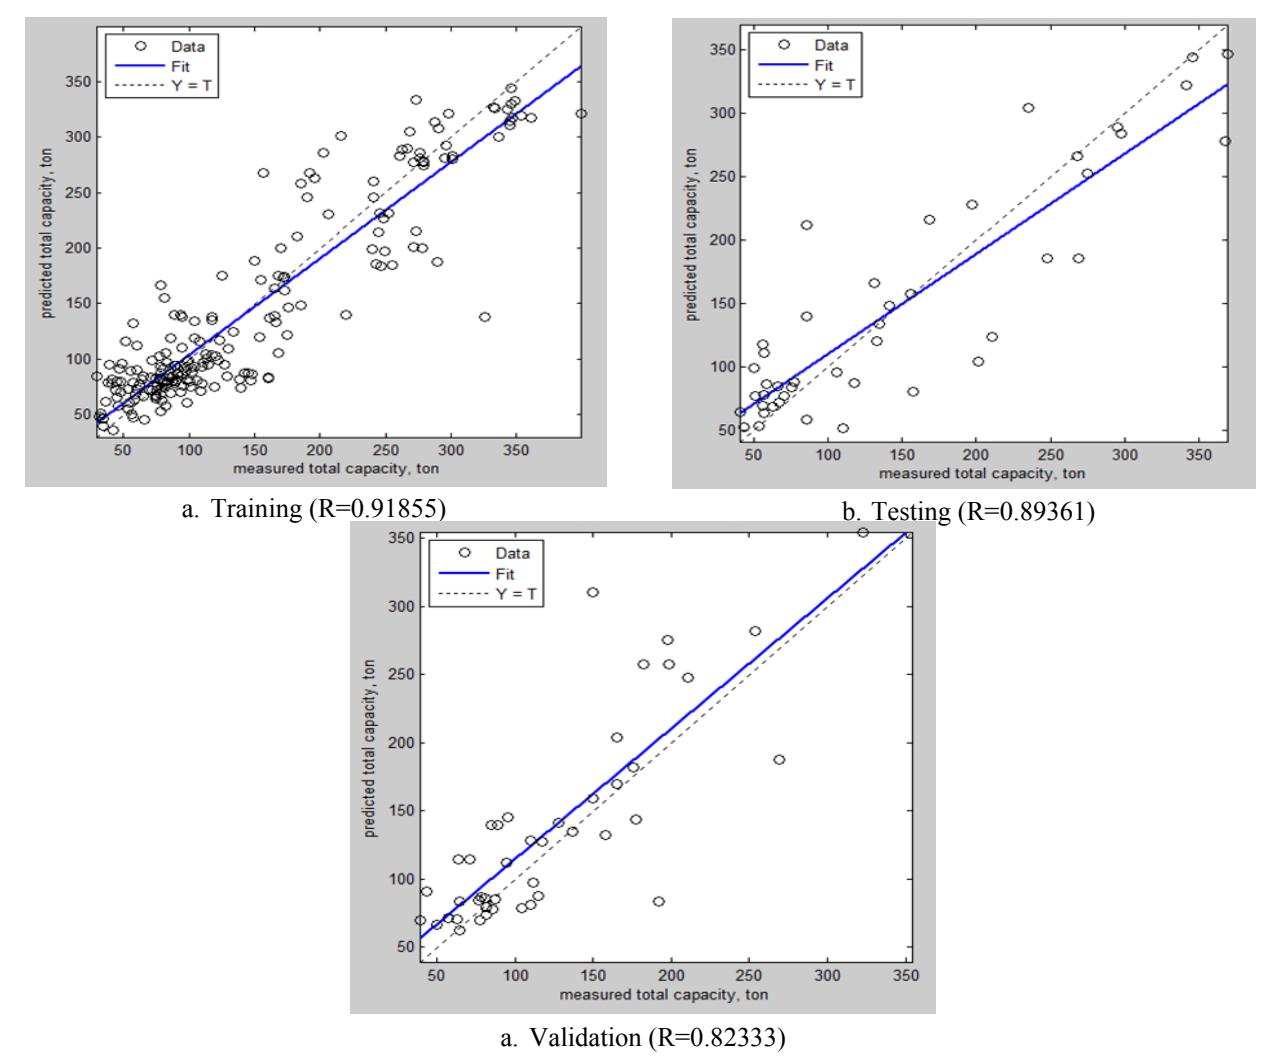
Figure 3. Comparison of predicted and measured total bearing capacity
Table 2. Summary of ANN-HM model performance for different iteration number
| Iteration | Coefficient of correlation (R) | Mean squared error (MSE) | |||||
|---|---|---|---|---|---|---|---|
| Number | Training | Testing | Validation | Training | Testing | Validation | |
| Total capacity | 5,000 | 0.8766 | 0.7746 | 0.9507 | |||
| Shaft resistance | 5,000 | 0.7292 | 0.5688 | 0.7937 | 0.0104 | 0.0111 | 0.0072 |
| End bearing | 5,000 | 0.7634 | 0.7433 | 0.8791 | |||
| Total capacity | 10,000 | 0.9107 | 0.8862 | 0.8124 | |||
| Shaft resistance | 10,000 | 0.8268 | 0.8199 | 0.6399 | 0.0081 | 0.0096 | 0.0079 |
| End bearing | 10,000 | 0.8013 | 0.8013 | 0.7903 | |||
| Total capacity | 15,000 | 0.8894 | 0.9539 | 0.9377 | |||
| Shaft resistance | 15,000 | 0.8615 | 0.8367 | 0.8852 | 0.0075 | 0.0059 | 0.0078 |
| End bearing | 15,000 | 0.7815 | 0.9308 | 0.9098 | |||
| Total capacity | 20,000 | 0.8907 | 0.8429 | 0.9327 | |||
| Shaft resistance | 20,000 | 0.8655 | 0.7429 | 0.8589 | 0.009 | 0.0076 | 0.0064 |
| End bearing | 20,000 | 0.7862 | 0.8129 | 0.8111 | |||
Table 3. Characteristics of the developed ANN model
| Number of iteration | 15,000 |
| Learning rate | 0.15 |
| Target error | 0.005 |
| Number of hidden layer | 1 |
| Number of hidden node | 8 |
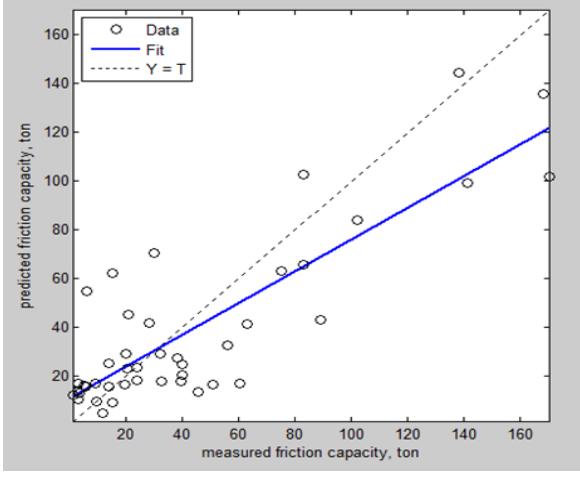

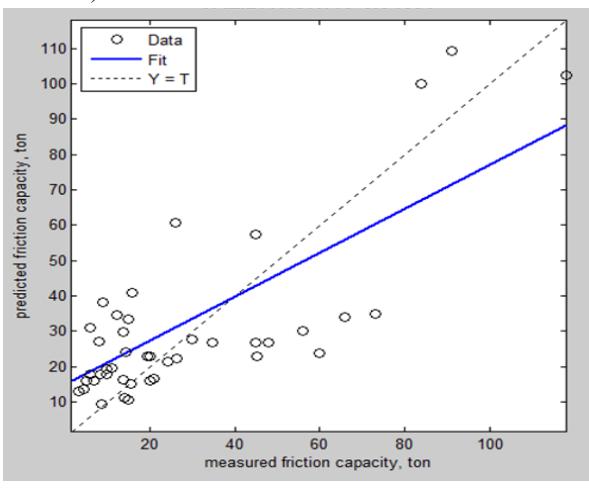
c. Validation (R=0.64696)
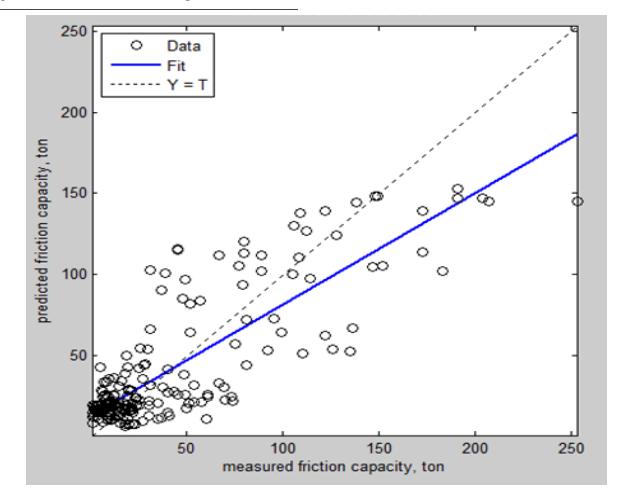
Figure 4. Comparison of predicted and measured Shaft Resistance
a. Training (R=0.82459) b. Testing (R=0.86301)
c. Validation (R=0.80555)
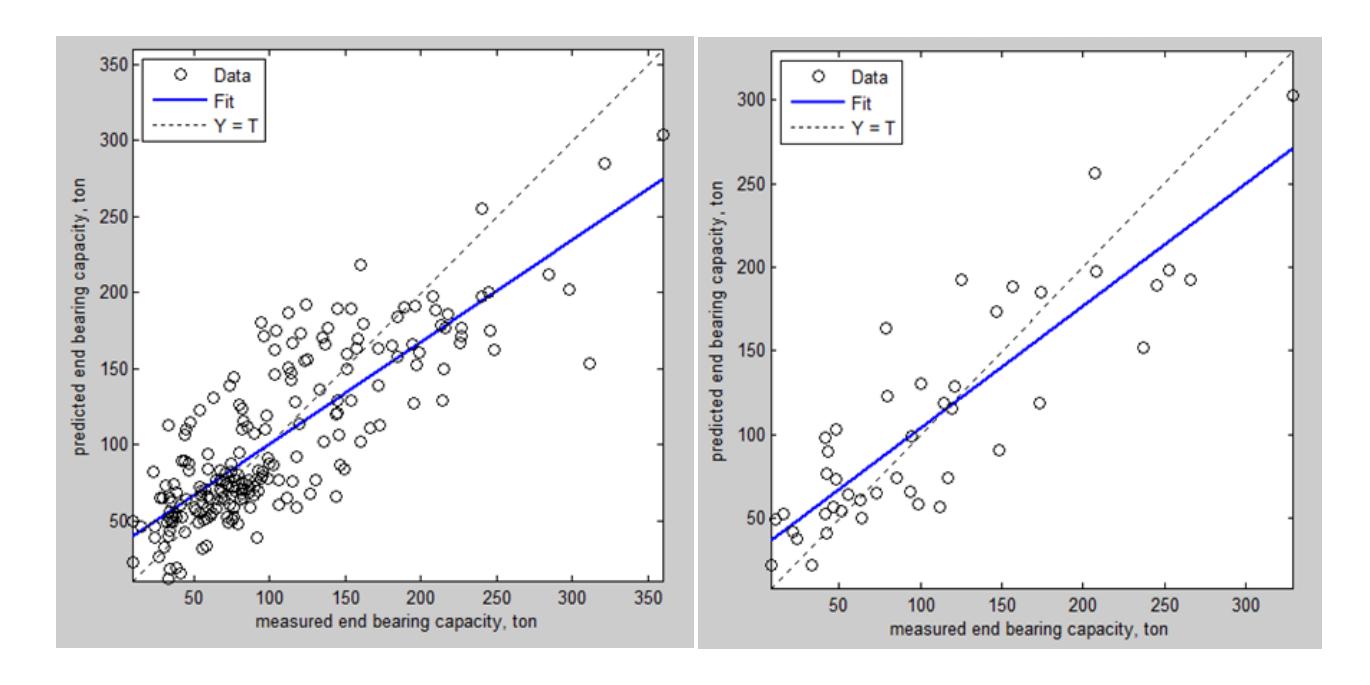
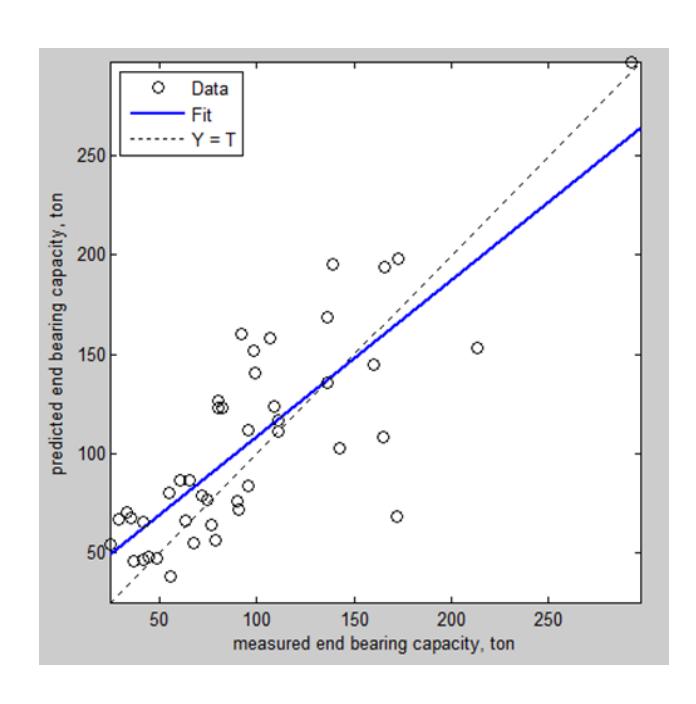
Figure 5. Comparison of predicted and measured end bearing capacity
6. Conclusions
Based on the ANN model (HM) results, the following conclusion can be drawn.
- 1. The ANN-HM model gives a good prediction of axial bearing capacity of driven pile which is implied by the high coefficients of correlation (R) during the training, testing and validation phases.
- 2. The result of mean squared error (MSE) gives more conservative value prediction of axial bearing capacity compare with the result from CAPWAP analysis.
- 3. The ANN-HM serve as a reliable prediction tools to predict the resistance of the driven pile (including shaft resistance and end bearing capacity) with coefficient of correlation (R) values close to 0.9 and mean squared error (MSE) less than 1% after 15,000 number of iteration process. Note this model considers only pile and hammer characteristic while soil parameters are considered similar.
Acknowledgement
The PDA test data used in this study are obtained with permission from PT. Delta Systech Indonesia and Transwaja Technology Company Malaysia.