
Abstrak
Pada analisis pipe-stress dengan beban dari pergerakan tanah yang diakibatkan oleh longsoran, perilaku interaksi antara pipa dan tanah berperan sangat penting. Ketika tanah/lereng mulai bergerak, sebuah pipa atau beberapa pipa yang dipasang di dalam bidang kelongsoran akan menerima beban tambahan yang seringnya menyebabkan buckling/overstress pada pipa. Untuk mempelajari fenomena ini, studi kasus dilakukan dengan memodelkan grup pipa yang dikenai pergerakan tanah secara lateral. ABAQUS, sebuah program berbasis finite element digunakan untuk memodelkan interaksi antara pipa dan tanah secara tiga dimensi selama longsor terjadi. Diskusi mengenai hasil dari analisis ini dilakukan dengan berfokus kepada perilaku displacement dan stress dari pipa akibat longsoran tanah. Berdasarkan hasil analisis, panjang dari bidang longsor menjadi issue utama dalam penentuan lokasi stress maksimum pipa, sehingga ke depannya perlu dilakukan pemeriksaan secara detail.
Kata-kata Kunci: ABAQUS, analisis elemen hingga, model numerik, interaksi pipa-tanah, kelongsoran lereng.
1. Introduction
Landslides have posed serious threats to any pipelines and other facilities in their slope zone. Due to the geographical limitation, many pipelines were constructed in a sloping area. This challenging condition has to be addressed in the design and/or analysis of the pipelines system to preserve the sustainability of the pipelines throughout their service life. In many cases, slope failures cause pipeline system to bending, buckling, wrinkling, and finally failure of the pipelines.
As the driving load(s) has reached the slope ultimate resistance, the slope begin to move/fail. This landslide soil movement can add significant additional load to the pipes. The pipes response depends on the conditions of the surrounding soil, geometrical condition of the slope, pipes characteristics, and interaction between soil and pipelines. When the soils start to move crossing the buried pipes, displacement and stress of the pipes will develop.
Stress limit is widely used to determine the serviceability of the pipeline structure in conventional analysis. It depends on several factors such as geometrical specification, material specification, and internal operational pressures. On the other hand, stress limit can be replaced by strain limit if soil movement is considered. ASME B31.4 [1] states that maximum tensile strain for pipeline must not exceed 2 %., while CSA [2] uses 2.5 % for the tensile strain limit.
2. Pipe-Soil Interaction
A comprehensive investigation of the soil-pipe interaction was carried out by Trautmann and O'Rourke [7] by using full-scale experiments of laterally loaded pipelines. The experiments focused on the response of the pipeline system buried in sand in term of lateral soil force and force displacement behaviour. Based on this study, as the displacement of the pipes increased by the ground deformation, force in dense soil exhibits residual force after reaching its peak force at a small dimensionless displacement parameter, Y/D (ratio of lateral displacement and pipe diameter), for H/D (ratio of pipeline depth and pipe diameter) more than 1.5. On the contrary, pipes buried in loose soil and medium dense soil did not show force reduction until the end of the experiments loading sequence. Interestingly, comparison of the lateral soil force between smooth and rough pipe surface shows small differences, only about 10 %.
A simplified solution for pipeline design due to transversal ground movement was proposed by Rajani, et al [5] assuming the pipes which are buried in elastic perfectly plastic soils still behave elastically. This solution provides analytical tools to perform quick calculations to verify pipelines integrity due to transversal ground movement by considering the development of pipe-soil interaction from the beginning of the landslide event where soil and pipes initially undergo elastic response until a condition where the soil develop ultimate passive resistance. As the ground movement increases, the pipes will begin to develop plastic response. Rajani, et al [5] also mentioned that the analytical solution was made by assuming that the small displacement and strain occur. The analytical solution can be used to determine maximum stress () which is affected by ultimate force per unit length (R), non-dimensional end displacement ( ), nondimensional end load ( ), and non-dimensional moment ( ) as expressed by following equations.
\[R = \overline{N}_c b S_u \tag{1}\]
\[\overline{w} = \frac{k_s \, w}{s} \tag{2}\]
\[\overline{P} = \frac{P\beta}{hc} \tag{3}\]
\[\overline{M} = \frac{M\beta}{R} \tag{4}\]
\[\sigma = \frac{Mb}{2I} \tag{5}\]
\[\beta = \sqrt[4]{\frac{k_z b}{4EI}} \tag{6}\]
Where is horizontal bearing capacity factor, b is pipe diameter, is undrained strength of soils, is soil subgrade modulus, w is landslide end movement, P is applied load, M is maximum moment due to P, and I is moment of inertia of the pipeline (Rajani, et al [5]). is defined by using chart proposed by Rowe and Davis [6], while Rajani, et al [5] provided chart to determine and .
Kliszczewicz [4] conducted a 3D numerical analysis of pipe-soil interaction with the Z_Soil software. In this model, the location of the PVC flexible pipeline was 3 meters below ground surface, while distributed load of 100 kPa was applied onto the surface. To model the behavior of soil, Hardening Soil Small isotropic strengthening model was used. The results show that the ratio between maximum vertical displacement of the pipe and the soil was approximately 15.7 % (Rajani, et al [5]). Moreover, the maximum internal
force of the pipe occurred on the top portion of the PVC pipeline.
3. Numerical Model of Pipe-Soil Interaction
To observe pipe-soil interaction insitu, a case study was taken on a group of pipes constructed in a sloping zone with an approxiate height of 20 meters. There are three (3) pipeline spans considered, two with a diameter of 0.4064 m (16 inches), and the last one with a diameter of 0.508 m (20 inches). The soil failure direction is modeled to be perpendicular to the pipe axis.
The field condition including the pipeline system was modelled by using a finite element software called ABAQUS. Basically, the three-dimensional model established in this analysis was an extruded twodimensional (plane-strain) model as shown in Figure 1. The model is divided into three parts, centre part and both side parts with a total length of 300 meters. Landslides mechanism was only modelled in the centre part, while 100 meter length parts were added at both sides. Figure 1 also shows that the pipeline configuration was set along the x-axis.
Similar to the other finite elements programs, finite element codes inside Abaqus solves the equilibrium problems called weak form of the equilibrium equation, as shown which depends on internal force acting on the elements and external forces. It is solved by Newton-Raphson's iterative operation in which imposing displacement and applying stress onto the elements. This equation is solved when summation between internal and external forces close to zero, or in other words, internal force equal to external force with no residual.
\[Z_e^T \int_{\Omega} B^T \sigma \, d\Omega + f_{ext} = 0 \tag{7}\]
Consistent tangent operator of the kth iteration for equilibrium is then introduced. This procedure focuses on derivative of the equilibrium equation which considers residual as shown by following equation.
\[Z_{\varepsilon}^{T} \left( \int_{\Omega} B^{T} \frac{\partial \sigma_{n+1}}{\partial \varepsilon_{n+1}} B d\Omega \right) Z_{\varepsilon} = R'(d_{n+1})\] (8)
Jacobian containing material parameter defined in the elements is also involved in the consistent tangent operator. In particular, FE code with updated stress and consistent tangent operator must be provided by the solver used for the finite element formulation (Hibbit [3]).
\[\frac{\partial \sigma_{n+1}}{\partial \varepsilon_{n+1}} = \frac{\partial (\sigma_{n+1} - \sigma_n)}{\partial (\varepsilon_{n+1} - \varepsilon_n)} \tag{9}\]
Because of the significant discrepancy between pipe thickness and the whole soil model, three-dimensional reduced shell continuum element with four nodes as a first-order (or linear) interpolation (S4R) was assigned for pipeline model. The continuum element type is known for its capability of saving computation time with 6 degree of freedoms per node. For soil model, three-dimensional continuum element with six nodes and first-order interpolation (C3D6) which allow three
translation degree of freedom in x, y, and z direction were used. Maximum element size of the soil model is 15.0 meter and it is re-meshed into smaller elements (up to 0.1 meter size) in the area where the pipeline is placed to improve the accuracy of generated pipe stress. With this mesh configuration, there are approximately 27333 elements employed in the model. On the base of the model, fixed boundary condition was applied, while displacement perpendicular to the side planes (x-planes and y-planes) were restricted.
Soil behaviours were modelled by using the elasticperfectly plastic Mohr-Coulomb model. Input parameters for each soil layer are shown in Table 1. On the other hand, material parameters of pipes were assumed to be elastic with parameter as listed in Table 2. In order to model interaction between pipe and soil, tangential behaviour was assigned with a friction coefficient of 0.3.
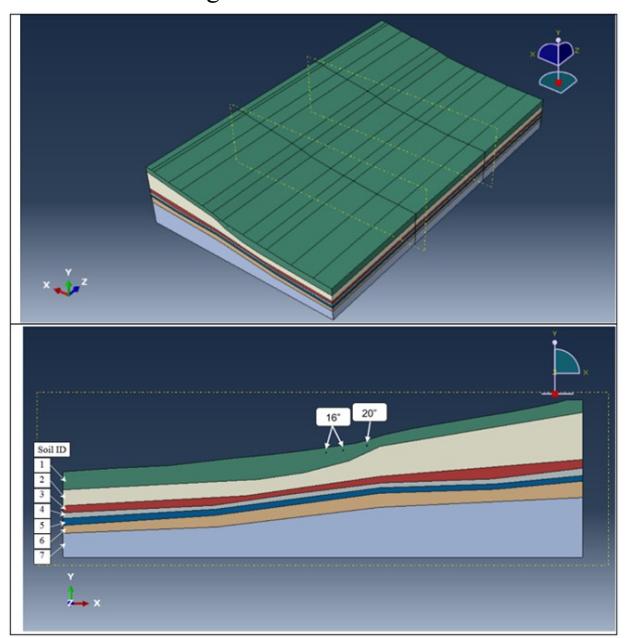
Figure 1. Finite element model.
Table 1. Input parameters of soils (Mohr-Coulomb model).
| No | Identification | | E | c | φ |
|---|---|---|---|---|---|
| kN/m3 | kN/m2 | kN/m2 | o | ||
| 1 | Soft clay | 14 | 4,800 | 24 | 0 |
| 2 | Med. stiff clay | 15 | 18,000 | 90 | 0 |
| 3 | Stiff clay | 16 | 20,600 | 103 | 0 |
| 4 | Hard clay | 16.5 | 100,000 | 500 | 0 |
| 5 | Loose sand | 16 | 15,000 | 7 | 21 |
| 6 | Med. dense sand | 18 | 19,600 | 5 | 32 |
| 7 | Very dense sand | 19 | 55,000 | 1 | 38 |
Table 2. Input parameters of pipes (elastic).
| No | Identification | | E | |
|---|---|---|---|---|
| kN/m3 | GPa | |||
| 1 | Pipeline | 76.5 | 202 | |
Calculation steps for this simulation are divided into three stages. First, geostatic step was defined by generating overburden stress through gravity in soil model. However, soil displacement resulted from gravity loading was kept minimum until stress equilibrium was achieved. Second, the pipeline was inserted by activating pipeline model into soil mass without considering trenching and installation process. Finally (third), strength parameter reduction was conducted to generate landslide movement.
4. Results
Discussion about the results of this study is focussed on pipe-soil responses: soil displacement, pipe displacement, and pipe stress for a pipe with diameter 0.508 m (20") and two pipes with diameter of 0.4064 m (16") – 16" (1) refers to the middle pipeline, while 16" (2) pipe is located near slope toe. In output presentations, Strength Reduction Factor (SRF) was used to monitor the analysis progress during the final step of the calculation. It can be defined as ratio between existing shear strength of soils and shear strength of soils at failure.
The typical pipe displacement profiles along the pipeline span captured in this analysis are shown in Figure 2. Comparison between these profiles on the last increment of the analysis is presented by Figure 3. According to the results, the maximum pipe displacement value was recorded on both pipes 16" (1) and 16" (2). One of the potential factors that lead to this condition is the progress of failure mechanism modelled by Abaqus through Strength Reduction Method on the soil surrounding the pipelines.
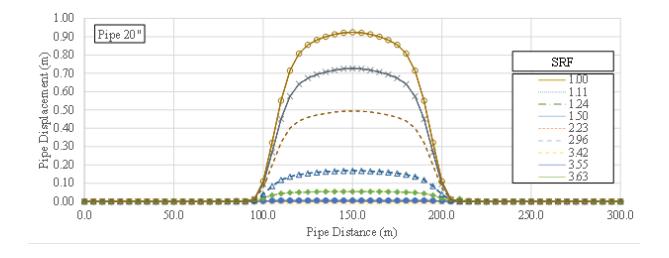
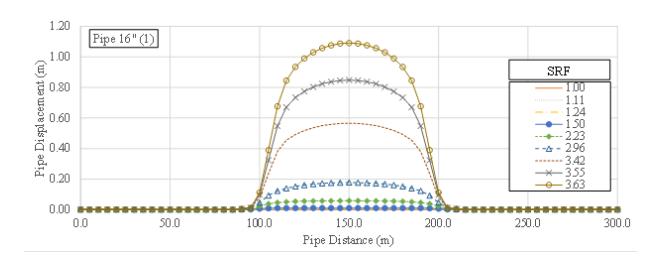
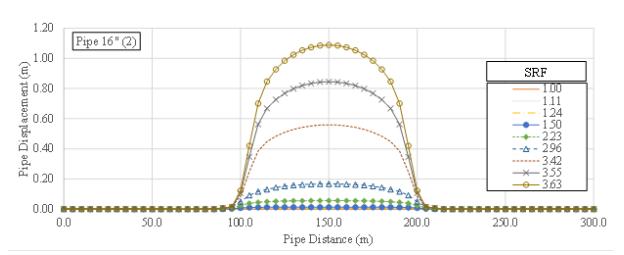
Figure 2. Pipe-displacement profile induced by slope movement perpendicular to pipe axis.
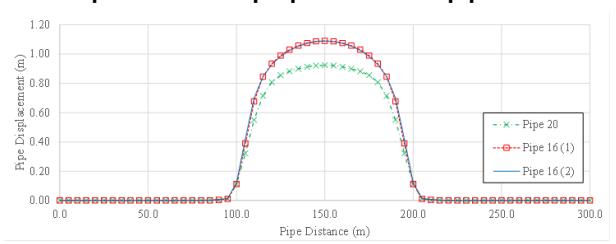
Figure 3. Comparison between displacement profiles of each pipe.
Besides pipe displacement, slope failure mechanism also affect the stress built up of the pipe subjected by soil movement. Similar to the previous condition (displacement profile), pipe 16" (1) and 16" (2) undergo larger stress than pipe 20" as shown by Figure 4. Initially, stress occurred on the pipe 20" is relatively larger than other pipes. However, as the soil continued to move, stress recorded on pipe 16"s significantly exceeded that of pipe 20". At the end of analysis step, pipe 16" (2) which is located at the lowest part has the largest stress (compared to others), followed by pipe 16" (1) in the middle, while pipe 20" stress was slightly larger than half of pipe 16" (2).
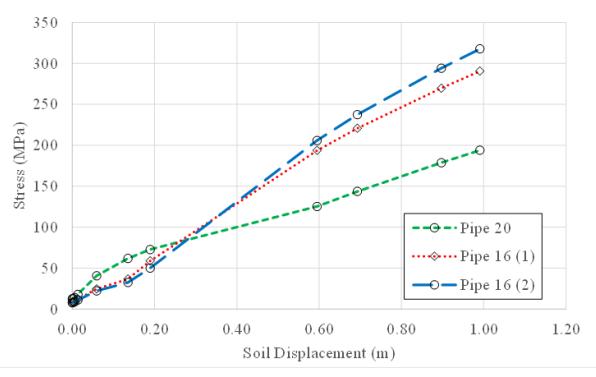
Figure 4. Comparison between stress-built up of pipelines.
As shown by Figure 4, the maximum pipe stress on the pipe 20", pipe 16"-1, and pipe 16"-2 are 218.9 MPa, 324.5 MPa, and 361.4 MPa, respectively. Comparison study of the maximum stresses between analysis in this study and analytical method proposed by Rajani, et al [5] is then conducted. By using similar geometrical and material configurations for pipe 20" and both pipe 16", combined with assumption for Ks values for soft soil which is 7200 kPa/m, the calculated maximum stress using analytical method (Rajani, et al [5]) for pipe 20" is 204 MPa, while for pipe 16" is 244 MPa. The stress values for pipe 20" agree quite well between
both analyses. However, finite element analysis tends to give more conservative results than the analytical method for both pipes 16" by addressing the failure process of the slope.
Figure 5 shows how the slope failure was generated by simultaneously reducing soil shear strength. At the early stage, failure occurred on the lower part of the slope where the slope is relatively less inclined than the upper part. It also implied that a group of pipes modelled in this analysis acted as reinforcing system to the slope because slope failure basically occurs on the steepest part of the slope geometry. However, additional analysis should be conducted to observe this condition. Due to initial soil movement induced by failure at the bottom of the slopes, pipe 16" (1) and pipe 16" (2) placed at near bottom part were affected and forced to move, while the pipe 20" remained undisturbed. As the failure mechanism slowly progressed upward, pipe 20" started to be affected, yet the stress was not as large as that of both pipe 16" since the failure has not reached pipe 20" in the beginning of analysis stage. This condition also applies to the pipe response in term of displacement profile.
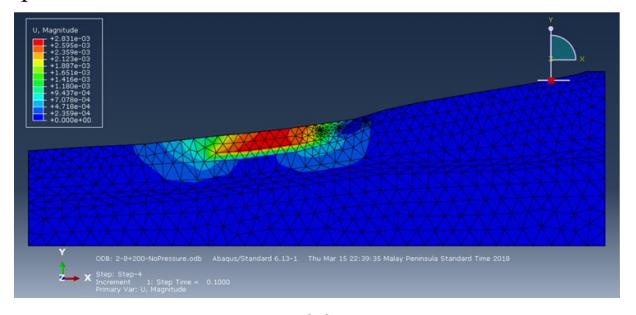
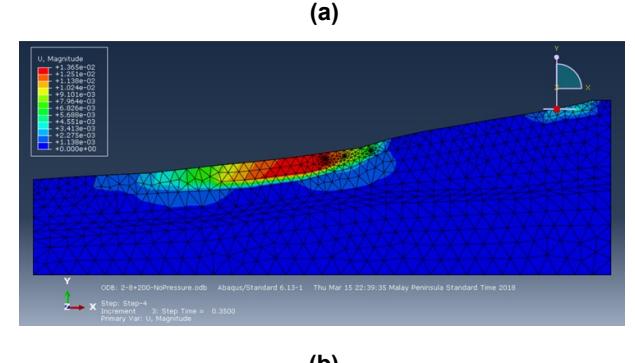
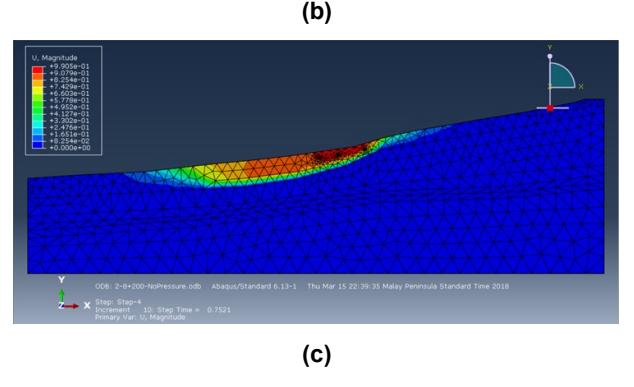
Figure 5. Slope failure progress resulted from the analysis: (a) SRF = 1.11 (b) SRF = 1.50 (c) SRF = 3.58
As shown by Figure 6, it is obvious that the pipe stress caused by soil movements were concentrated on the pipe distance of 100 and 200 meters where the boundary between middle soil part (failure) and side soil part was located. Similarly, the highest tensile strain also occurred in this location. The recorded strains at the end of the analysis (SRF = 3.63) for pipe 20", pipe 16" (1), and pipe 16" (2) are 0.11 %, 0.16 %, and 0.18 %, respectively. These values are far below than the criteria for tensile strain which is 2.0 %. However, it should be noted that during the analysis, the pipe was modelled as an elastic material. Thus, strains which were captured in the model are elastic strains as material yielding was not considered in the analysis. Based on the analysis, it is crucial to predict or determine the length of slope failure to locate the maximum stress of the pipes.
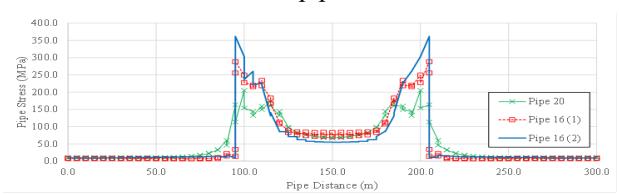
Figure 6. Comparison of stress profile along the pipeline system.
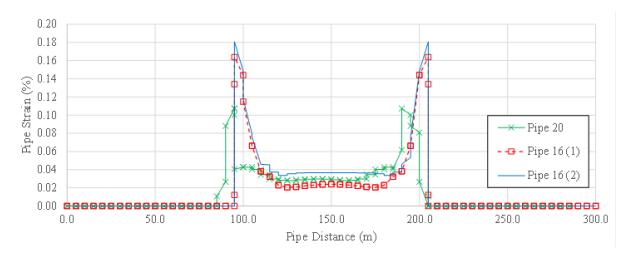
Figure 7. Comparison of strain profile along the pipeline system.
5. Summary and Conclusion
- 1. Numerical modelling was performed to study behaviors of pipe-soil interaction subjected to slope failure. Results of simulations conclude that the failure mechanism, especially length and depth of slope failure, defines the pipe-soil responses - displacement and developed stress. Moreover, the failure mechanism of the slope also captures the reinforcing effect of the slope. However, it is recommended to conduct slope stability analysis without pipelines to comprehensively assess the influence of pipelines system toward slope stability.
- 2. Since the location of maximum stress of the pipelines is greatly influenced by geometrical characteristic of slope failure, it is important to predict the length of slope failure where the pipelines are buried inside this failure plane. It can be done by conducting visual observation and/or installing field instrumentation such as inclinometer(s) and surface movement monitoring.
- 3. The other two influencing factors are failure depth and pipe position (inside) relative to the failure zone. Slope failure generally will unlikely be harmful